 A recent report highlights that the collective short interest in stocks from 15 bitcoin mining companies has approached the billion mark. The performance of these mining stocks has declined compared to their stronger start earlier this year, coinciding with the proximity of just 663 blocks remaining until the next reward halving. Impending Bitcoin Halving […]
Bitcoin News
Algorand Explorer Powered By ChatGPT launched, Will ALGO Find Reprieve From Aggressive Sellers?
GoPlausible, a team of developers building tools for people to create and use Algorand, has launched AlgorandExplorer. This explorer fuses the capabilities of ChatGPT to ease interaction with the public, proof-of-stake blockchain. Algorand is a smart contract platform similar to Ethereum, allowing users to deploy decentralized applications (dapps).
In a Medium post on October 10, the team said the plugin aims to solve challenges facing Algorand indexers and eventually simplify exploring the smart contract platform. Ordinarily, users rely on indexers through which users can search and query the blockchain. This is because indexers have to create a searchable database holding all data, such as transactions, blocks, and more.
Besides offering an interface for users to explore Algorand, the AlgorandExplorer supports “semantic conversational searches, enriching data with logs and related transactions,” allowing on-chain searches to “reason with data” more effectively. The explorer will integrate a language translation tool, meaning users from across the globe can explore Algorand using their native language.
Still, the AlgorandExplorer is under development. Eventually, in the coming version, the GoPlausible plans to include more enhancements, including Algorand Request for Comments (ARCs) and technical documentation.
Algorand is far from the only platform investing in AI; a few months ago, Solana announced their integration of a ChatGPT plugin focused on non-fungible tokens (NFTs). The plugin, the foundation said, facilitates the buying and listing of NFTs. At the same time, it can interpret data and find the floor price of NFT collections listed on the blockchain. The floor price is the lowest price an NFT in a given collection can be sold.
The ALGO Sell-Off Continues: Will Prices Sink To New Lows?
While the move by the Algorand Foundation could see more users explore and analyze transactions on the smart contract platform, there has been no significant impact on prices. The ALGO sell-off was made worse by allegations made by the United States Securities and Exchange Commission (SEC) in June that ALGO and other coins, including Axie Infinity (AXS) and Cardano (ADA), are unregistered securities.
Presently, ALGO remains under pressure, consolidating within a tight range defined by the sell-off recorded in August. Based on that formation, the coin is technically bearish and trending within the bear bar of August 17, a bearish engulfing bar that had high trading volume.
Thus far, looking at trackers, the coin is down by over 70% in the past year of trading. From the daily chart, ALGO is also edging lower, wiping gains posted in the first week of October.
Technically, ALGO is edging closer to all-time lows registered in August, a net negative. The primary supports remain at .08. If broken in Q4 2023, the odds of ALGO sinking even lower, completely reversing gains of 2021, will be on the table.
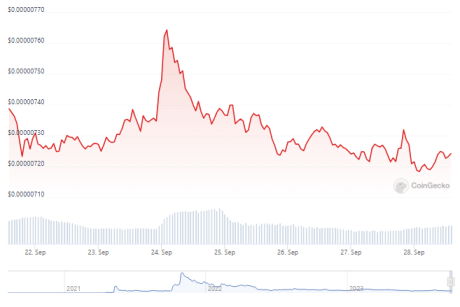
Shiba Inu At $0.0000072: Sellers Push For Breakout From Compact Zone
Shiba Inu (SHIB) has been navigating turbulent waters in the crypto market since mid-April. With its price oscillating between the lows of .0000068 and the highs of .0000076, SHIB holders have been eagerly awaiting a breakout from this sideways movement. The question on everyone’s mind: Will sellers succeed in pushing SHIB out of its current zone?
Price analysis shows that since mid-August, SHIB has been grappling with a bearish market structure on both higher and lower timeframes. The ominous signs began with a sharp price rejection at the .00001 price zone, triggering a cascade of sell-offs that brought the price crashing below the once-strong support at .0000080.
The Relative Strength Index (RSI) has consistently remained below the neutral 50 mark, underscoring the relentless selling pressure. Furthermore, the Chaikin Money Flow (CMF) plummeted from positive to negative during this prolonged range-bound period.
Current SHIB Stats
As of the latest data available on CoinGecko, SHIB is trading at approximately .000007258220, showing a minor 0.2% decline in the past 24 hours and a seven-day dip of 3.1%. These figures indicate the prevailing bearish sentiment surrounding SHIB.
The .0000080 level, which had previously acted as a stronghold for bulls, has now transformed into a formidable resistance barrier due to the sustained selling pressure. While SHIB has maintained a sideways trajectory since this resistance flip, the looming threat of further bearish activity cannot be ignored.
A successful bearish breakout could potentially lead SHIB to target the June low of .000006, the analysis notes. Conversely, if Bitcoin (BTC) stages a rally beyond ,000, it might just be the catalyst for an unexpected bullish surge in SHIB’s current range.
SHIB Bulls Hold On To Optimism
On a more optimistic note, some analysts believe that if SHIB manages to hold support at .0000070, in conjunction with an ascending trendline, it could pave the way for a sentiment shift and potential price recovery, aiming for levels beyond .00001. The first crucial step towards this ascent is conquering the immediate seller congestion at .0000074.
Shiba Inu (SHIB) remains firmly entrenched in a bearish market structure, with several indicators pointing to sustained selling pressure. However, the crypto world is known for its unpredictability, and market sentiment can shift rapidly.
Traders and enthusiasts alike will be closely monitoring these critical levels, hoping for a change in SHIB’s fortune, but with caution as they navigate the treacherous crypto waters.
(This site’s content should not be construed as investment advice. Investing involves risk. When you invest, your capital is subject to risk).
Featured image from iStock
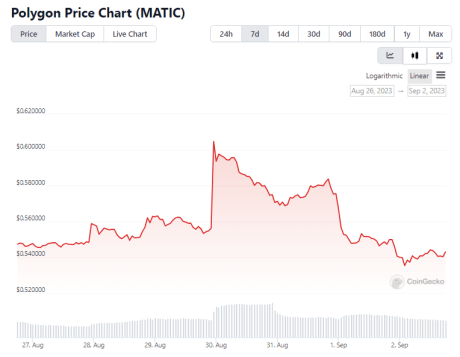
Polygon (MATIC) Drops Below Crucial Level – Will Sellers Exit?
Polygon (MATIC), one of the prominent players in the cryptocurrency market, has faced a turbulent period as it lost its grip on the .60 mark, leaving investors and traders on edge.
As of the latest data available, MATIC was trading at .540840 on CoinGecko, reflecting a 1.4% slip in the past 24 hours and a 0.6% decline over the last seven days. This dip in price has sparked discussions about the coin’s immediate future.
The cryptocurrency market has been characterized by considerable uncertainty, with Bitcoin (BTC), the bellwether of the industry, also grappling with price fluctuations. Analysts suggest that BTC might enter a narrow consolidation phase before establishing a clear direction in the coming week.
Given this backdrop, MATIC could follow suit by consolidating above the critical support level of .50 before attempting an upward move toward the 50-EMA (Exponential Moving Average) at either .60 or .65.
Polygon Key Chart Indicators Raise Concerns
Technical indicators have painted a cautious picture for MATIC. The Relative Strength Index (RSI) remains in the lower range, signifying bearish momentum, while the Chaikin Money Flow (CMF) has struggled to breach the zero level, indicating limited capital inflows and heightened selling pressure.
Additionally, the On-Balance Volume (OBV) has slightly dipped, further suggesting a waning demand for MATIC in the current market conditions.
In the midst of this market turbulence, Polygon has made an intriguing proposition. In July, the project unveiled plans for a token upgrade aimed at enhancing the capabilities of MATIC holders within the Polygon ecosystem.
Polygon’s Ambitious Proposal
The proposal seeks to enable MATIC holders to validate transactions on multiple blockchain networks, potentially increasing their utility and influence. However, it’s important to note that this proposal is currently pending approval from the Polygon community.
If this proposal receives the green light, it would mark a significant shift for Polygon, as the coin would transition from MATIC to POL. Such a transition could have far-reaching implications for both the Polygon network and its community of users, potentially influencing MATIC’s price dynamics in the long run.
Polygon finds itself at a critical juncture amid the recent market turbulence. While the short-term outlook remains uncertain due to negative chart indicators and wavering demand, the potential token upgrade proposal from Polygon offers a glimmer of hope for MATIC holders.
As traders and investors closely monitor market developments, the path forward for MATIC will largely depend on broader market trends and the community’s decision regarding the proposed upgrade.
(This site’s content should not be construed as investment advice. Investing involves risk. When you invest, your capital is subject to risk).
Featured image from Bizz Buzz
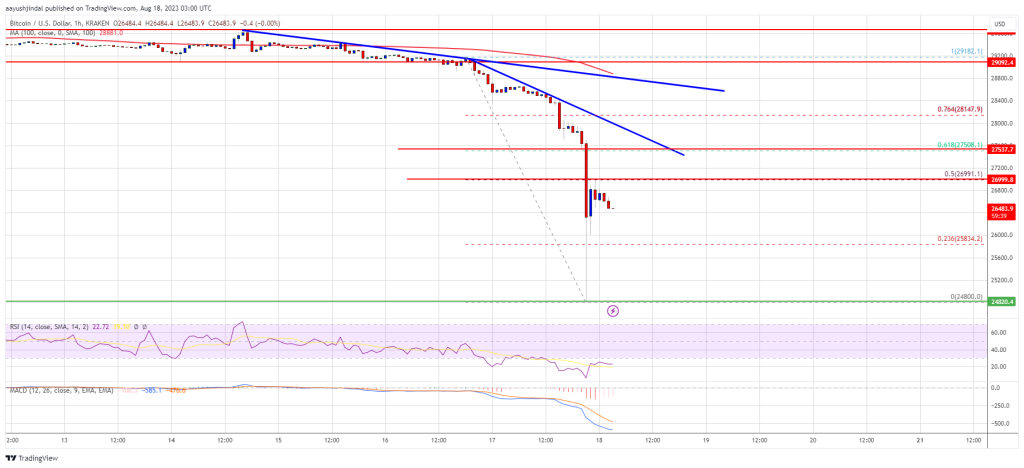
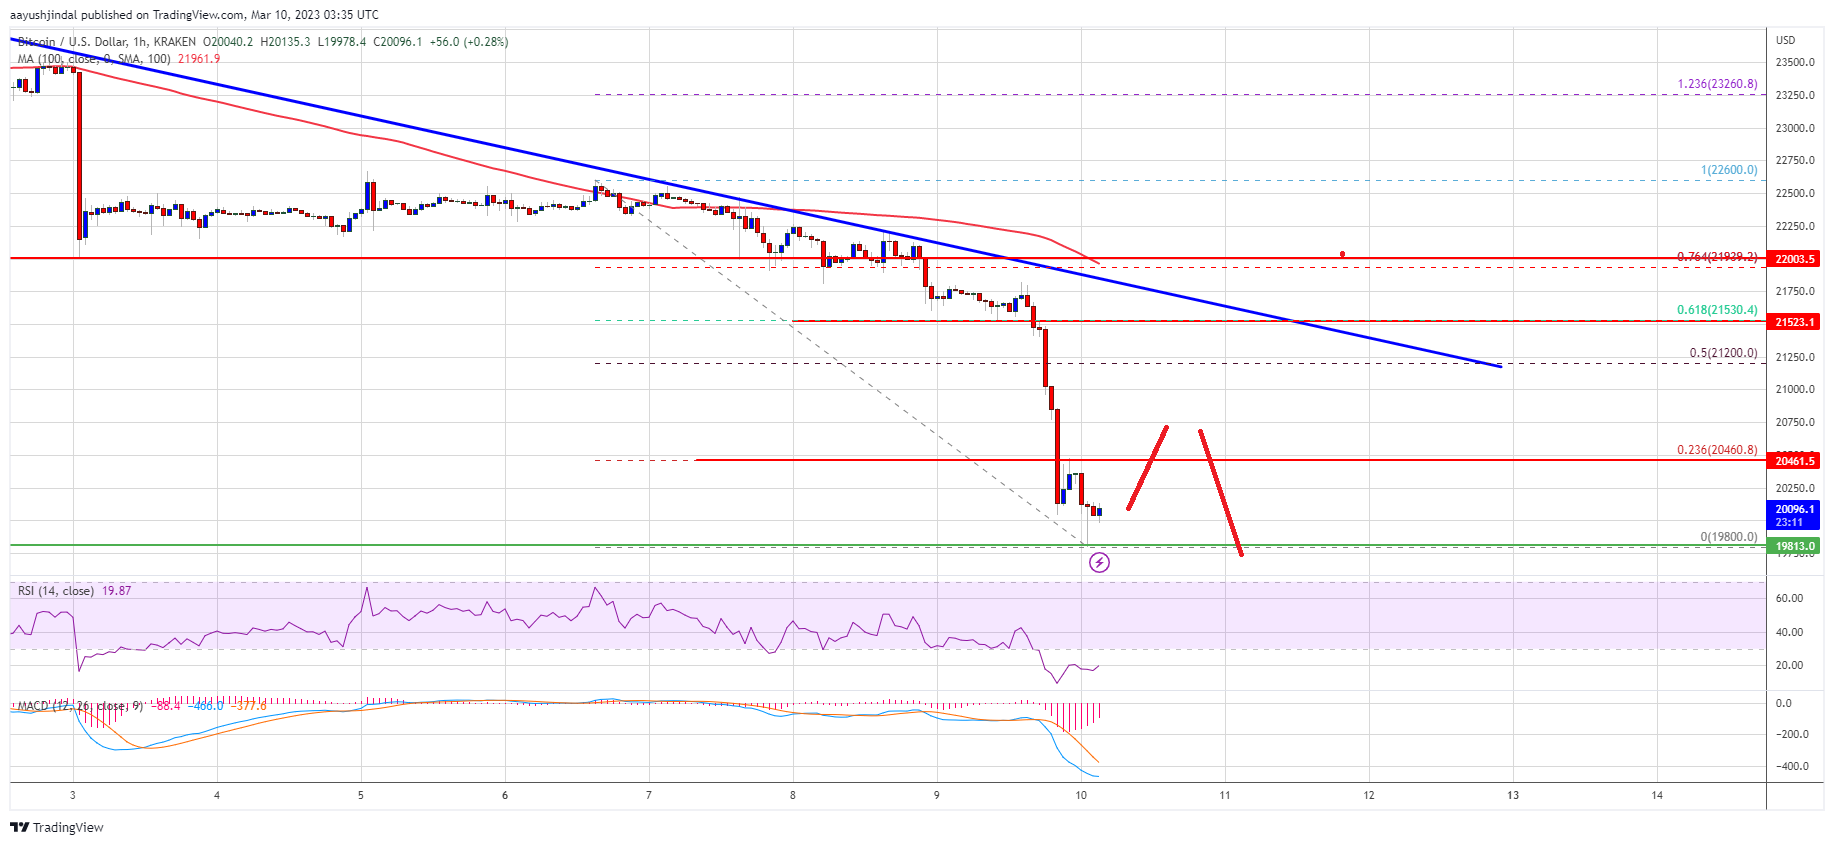
Bitcoin Price Nosedives and Turns Attractive To Sellers On Recovery
Bitcoin price tumbled below the ,400 support. BTC tested ,800 and is currently attempting a recovery wave toward ,000.
- Bitcoin is down over 6% and trading below the ,000 support zone.
- The price is trading below ,800 and the 100 hourly Simple moving average.
- There are two bearish trend lines forming with resistance near ,500 and ,500 on the hourly chart of the BTC/USD pair (data feed from Kraken).
- The pair could continue to move down and trade below the ,800 support.
Bitcoin Price Breaks Support
Bitcoin price started a fresh decline after it failed to stay above the ,400 support zone. BTC declined heavily after it broke the ,000 support zone.
It is down over 6% and there was a spike below the ,500 support zone. A low is formed near ,800 and the price is now attempting a recovery wave. It recovered above the ,000 and ,000 levels. However, the bears are now protecting the 50% Fib retracement level of the downward move from the ,182 swing high to the ,800 low.
Bitcoin is now trading below ,000 and the 100 hourly Simple moving average. There are two bearish trend lines forming with resistance near ,500 and ,500 on the hourly chart of the BTC/USD pair.
Immediate resistance is near the ,000 level. The next major resistance is near ,500 and the trend line. It is close to the 61.8% Fib retracement level of the downward move from the ,182 swing high to the ,800 low. The main resistance is now forming near the ,500 zone and the 100 hourly Simple moving average.
Source: BTCUSD on TradingView.com
A close above the ,500 resistance could start a decent increase toward the ,200 resistance zone. Any more gains might set the pace for a larger increase toward ,000.
Another Decline In BTC?
If Bitcoin fails to clear the ,500 resistance, it could continue to move down. Immediate support on the downside is near the ,800 zone.
The next major support is near the ,500 level. A downside break below the ,500 level might push the price further into a bearish zone. In the stated case, the price could drop toward ,800.
Technical indicators:
Hourly MACD – The MACD is now gaining pace in the bearish zone.
Hourly RSI (Relative Strength Index) – The RSI for BTC/USD is now below the 40 level.
Major Support Levels – ,800, followed by ,500.
Major Resistance Levels – ,000, ,500, and ,500.
Bitcoin Sellers Out Of Ammo? BTC Price Hangs By A Thread At $28,500
The price of Bitcoin is finally on the move after weeks of being stuck in a tight trading range. The number one cryptocurrency by market cap stands at support with the potential for another re-test of the lows if bulls cannot push it higher.
As of this writing, Bitcoin trades at ,500 with a 2% loss in the past 24 hours. Over the previous week, the cryptocurrency recorded a 3% loss, while other assets in the top 10 underperformed and trended lower. The nascent industry could be a short-term crossroads.
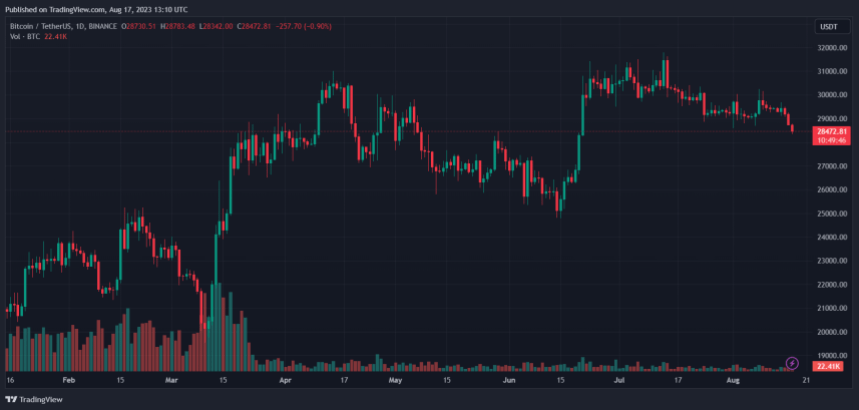
Bitcoin Price Loses ,000 Level, But A Recovery Is Likely?
As NewsBTC has been reporting, Bitcoin’s volatility reached a multi-year low after all major narratives previously influencing it diminished its strength. Now, the spike in volatility favored the downside, but how much pressure can the bears exercise?
According to a CryptoQuant analyst, the recent price action marks one of the highest in recent months. As seen in the chart below, the last time that Bitcoin saw similar selling pressure was in late July. The analyst stated:
This marks the strongest surge in selling since July 15th. It wouldn’t be surprising to witness the pinnacle of selling pressure at this very moment.
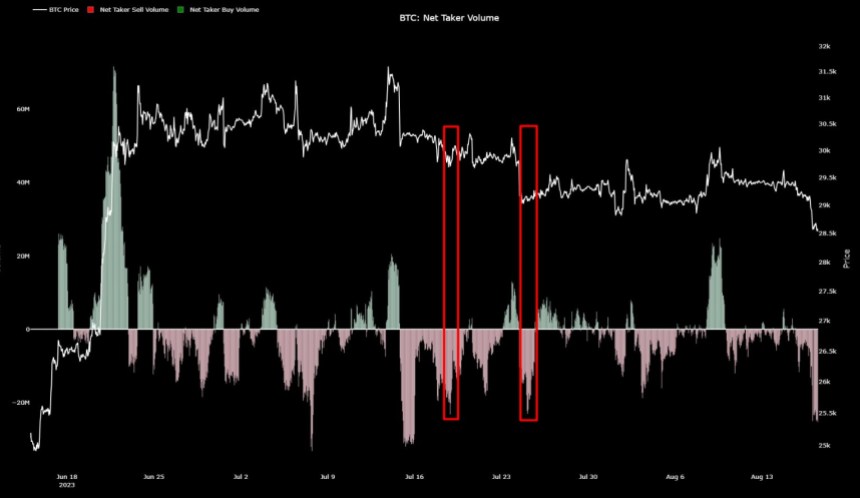
As seen in the chart above, the price of Bitcoin bounced back from support each time that sellers pushed into the current levels, as measured by the Net Taker Volume. However, sellers could still push the metric into the July 15th levels and induce a capitulation event.
There is some evidence to support the above. The chart below shows that BTC’s long positions have fueled the downside price action by providing liquidity and accelerating the fall.
If this continues, Bitcoin could continue trending downwards into the liquidity pool created by long positions at ,000 and ,700 if bulls give it. On the latter, crypto analytics firm Material Indicators noted:
Bitcoin price and liquidity continuing to erode and a critical test of support is eminent. IMO… Losing k would be purely psychological. Losing .5k would be technical. Holding .3k is critical. Losing the buy wall at .9k would cause a cascade.
Cover image from Unsplash, chart from Tradingview
Biggest Movers: DOGE Sellers Scupper Rebound, as LTC Remains Near 3-Week Low
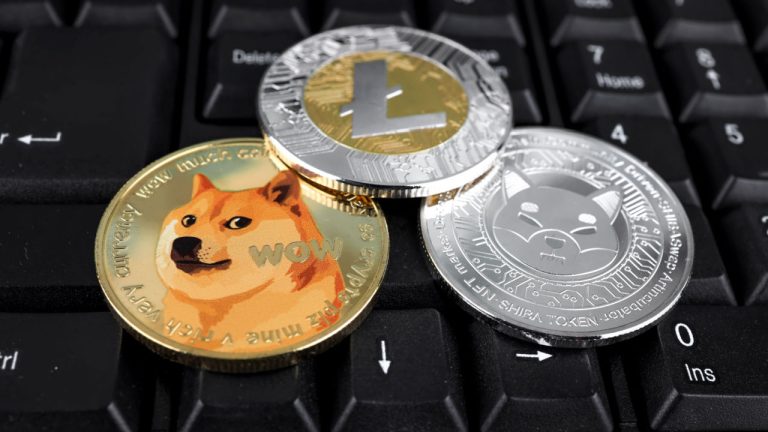
Dogecoin rebounded from Wednesday’s drop, with the meme coin briefly climbing back above .090 in today’s session. However as the day progressed, bearish sentiment heightened, with price declining. Litecoin was also down today, and continues to trade near a multi-week low.
Dogecoin (DOGE)
Dogecoin (DOGE) was volatile on Thursday, as prices moved back into the red, after an earlier rebound.
DOGE/USD fell to an intraday low of .08685 in today’s session, following an earlier high of .09297.
The meme coin has been volatile in recent sessions, after a week-long bull run was snapped on Wednesday.
Looking at the chart, today’s candlestick has printed a large doji, with dogecoin now trading close to its open price.
In addition to this, the relative strength index (RSI) has found a floor at the 53.00 mark, which has helped maintain the uncertainty.
Should this floor give way, there is a good chance that DOGE will move towards a support point at .08000.
Litecoin (LTC)
Litecoin (LTC) traded near a three-week low in today’s session, as the token moved below 0.00.
Following a high of 1.95 on Wednesday, LTC/USD plunged to a low of .38 earlier today.
This is the lowest level that litecoin has hit since March 31, with bears now potentially targeting a long-term floor at .00.
As a result of today’s decline, the RSI has fallen to a point of support of its own at the 45.00 mark.
If price strength were to fall below this point, it is likely that LTC could head closer to .00.
Register your email here to get weekly price analysis updates sent to your inbox:
Do you expect further declines in litecoin this week? Let us know your thoughts in the comments.
Bitcoin Price Crashes To 20K, Why Upsides Turned Attractive To Sellers
Bitcoin price declined over 8% and tested the ,000 support. BTC might correct higher, but upsides might be limited above the ,200 zone.
- Bitcoin down over 8% and there was a spike below the ,000 support.
- The price is trading below ,000 and the 100 hourly simple moving average.
- There is a crucial bearish trend line forming with resistance near ,300 on the hourly chart of the BTC/USD pair (data feed from Kraken).
- The pair could correct higher, but the bears might be active near ,000.
Bitcoin Price Takes Major Hit
Bitcoin price failed to rise above the ,200 resistance zone. BTC faced a strong rise in selling interest, resulting in a drop below the ,500 support zone.
The price is down over 8% and there was a crash towards the ,000 support. The price even spiked below the ,000 support zone. A new monthly low is formed near ,800 and the price is now consolidating losses near the ,000 zone.
Bitcoin price is now trading below ,000 and the 100 hourly simple moving average. An immediate resistance is near the ,400 level. It is near the 23.6% Fib retracement level of the recent decline from the ,600 swing high to ,800 low.
The next major resistance is near the ,200 zone. There is also a crucial bearish trend line forming with resistance near ,300 on the hourly chart of the BTC/USD pair. The trend line is close to the 50% Fib retracement level of the recent decline from the ,600 swing high to ,800 low.
Source: BTCUSD on TradingView.com
The main resistance is now near the ,000 zone. A close above the ,000 resistance might start a decent increase in the coming days. The next key resistance is near the ,600 zone, above which the price might gain bullish momentum and test ,000.
More Losses in BTC?
If bitcoin price fails to clear the ,000 resistance and the trend line, it could continue to move down. An immediate support on the downside is near the ,000 zone.
The next major support is near the ,800 zone, below which the price might drop to ,250. The next major support is near the ,000 level. Any more losses might send the price towards the ,400 level.
Technical indicators:
Hourly MACD – The MACD is now losing pace in the bearish zone.
Hourly RSI (Relative Strength Index) – The RSI for BTC/USD is now below the 30 level.
Major Support Levels – ,000, followed by ,800.
Major Resistance Levels – ,400, ,000 and ,000.
VET Price Retraces, But Sellers Should Short At These Levels
The price momentum of VeChain (VET) registered a halt over the last 24 hours after the altcoin started to trade laterally. In the same time frame, the coin dipped 0.9%, which is minor meaning that VeChain was in consolidation.
The coin had picked up bullish momentum at the beginning of this year, but the bears could not sustain the price above the .021 mark. The technical outlook of VeChain still points towards bullishness. The altcoin was overvalued at the time of writing, which emphasizes that a price correction is on the way.
A price correction also presents a shorting opportunity for traders. The accumulation on the chart also noted a downtick, but despite the downtick, demand for VET was substantial. However, VET will soon lose its current price level if buyers continue to lose interest.
At the moment, VeChain has secured the .019 price level as its current support mark. Moving below the price above the mark will make VeChain come under the influence of bears again. The VET price is 92% lower than its all-time high secured in 2021.
VET Price Analysis: One-Day Chart
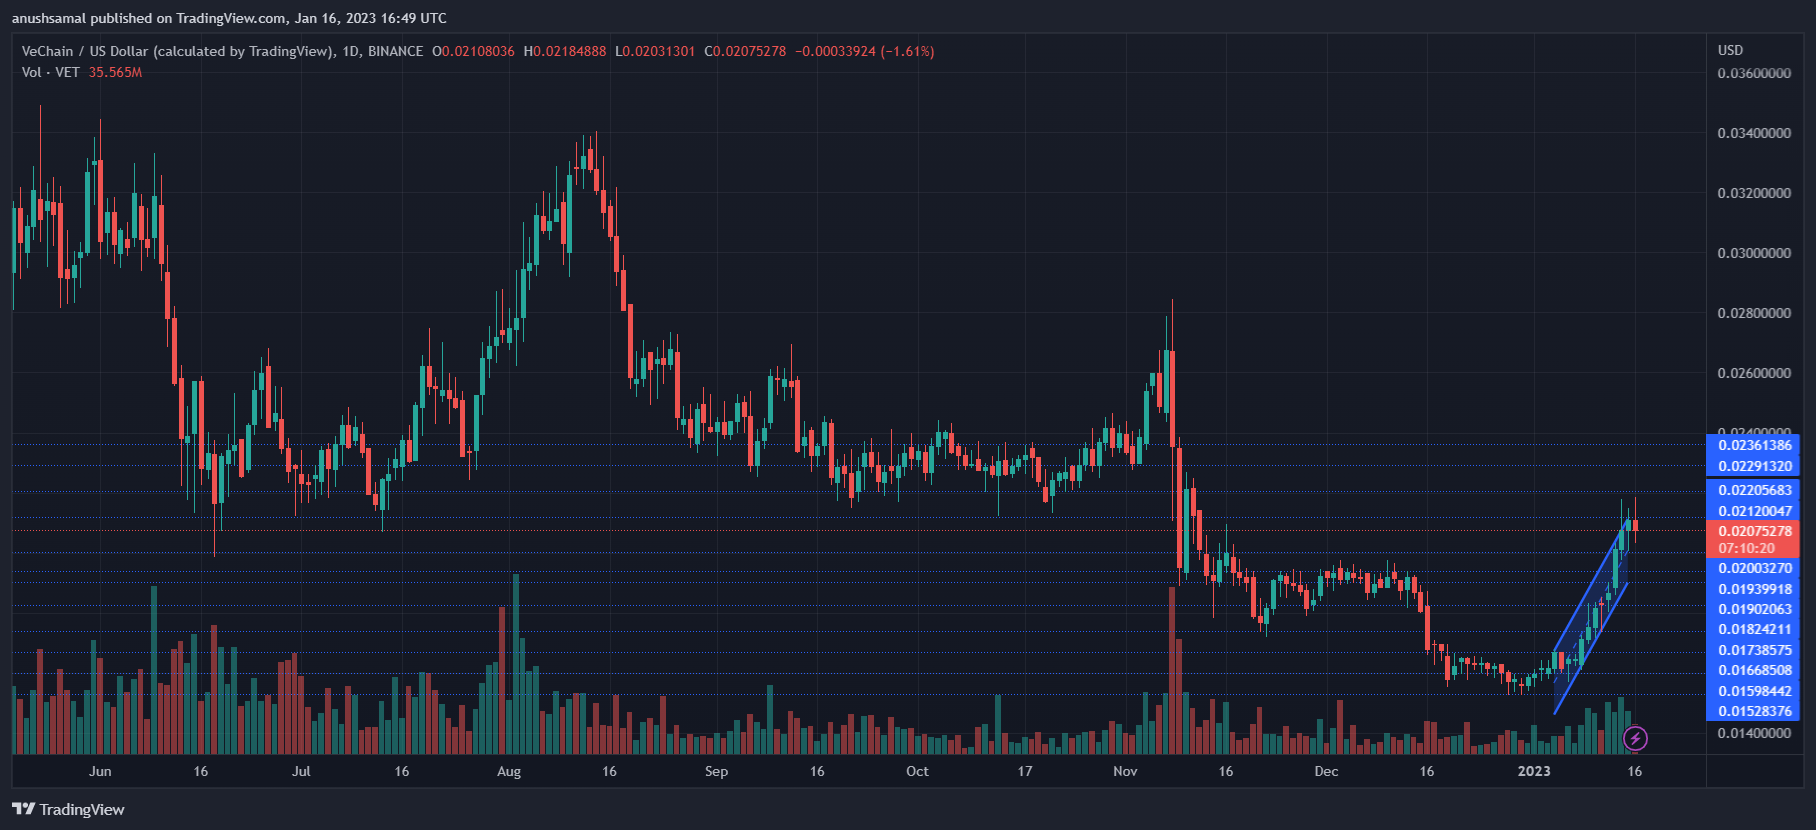
VeChain was trading at .0207 at the time of writing. The altcoin was trading within an upward parallel channel, which showed bullishness. However, VET traded outside the parallel chain over the past trading sessions.
As the coin moved outside of the parallel chain, the bulls failed to cross the .0212 price level, which acts as the current resistance price level for the coin. Local support for the coin stood at .020, and as VeChain depicted a correction, it is expected to fall below the .0193 level.
Both the .020 and the .0193 price levels can act as shorting levels for the coin. The amount of VeChain traded in the last session declined, which meant a slight fall in demand.
Technical Analysis
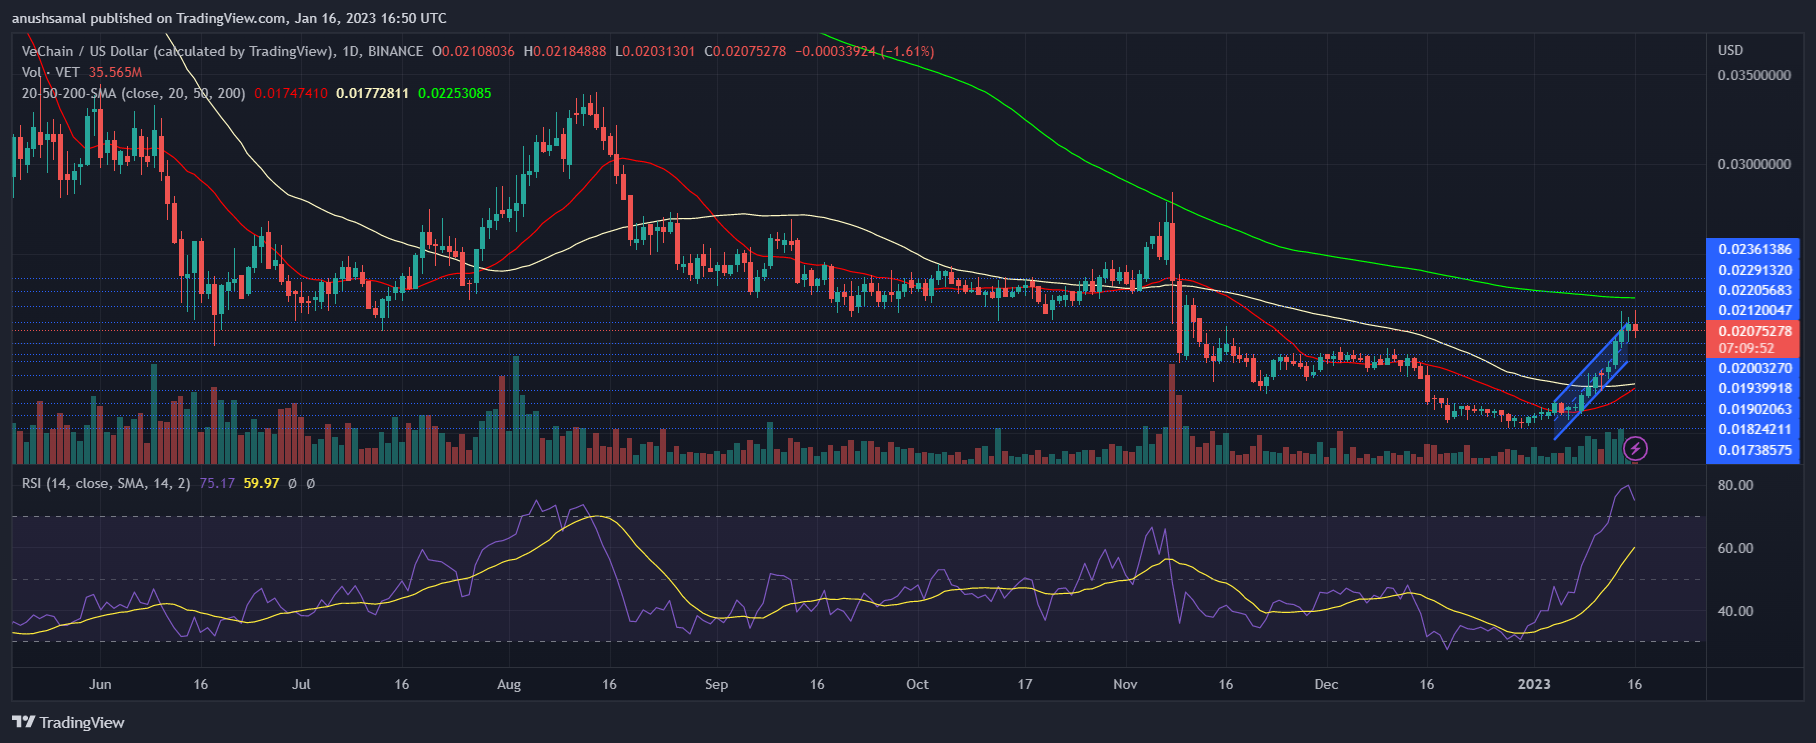
The altcoin was overvalued on the daily chart, and although demand for the coin registered a fall, the bulls were still hovering in the market. The Relative Strength Index was a few points below 80, indicating that the coin was under the influence of buyers.
With a price correction, VET can dip to .0193 before it starts to pick up momentum. On the same note, the VET price was above the 20-Simple Moving Average line (SMA), which meant that buyers were driving the price momentum in the market.
It was also above the 50-SMA line (yellow); however, another pull from the bears will drag VET below the 50-SMA line.
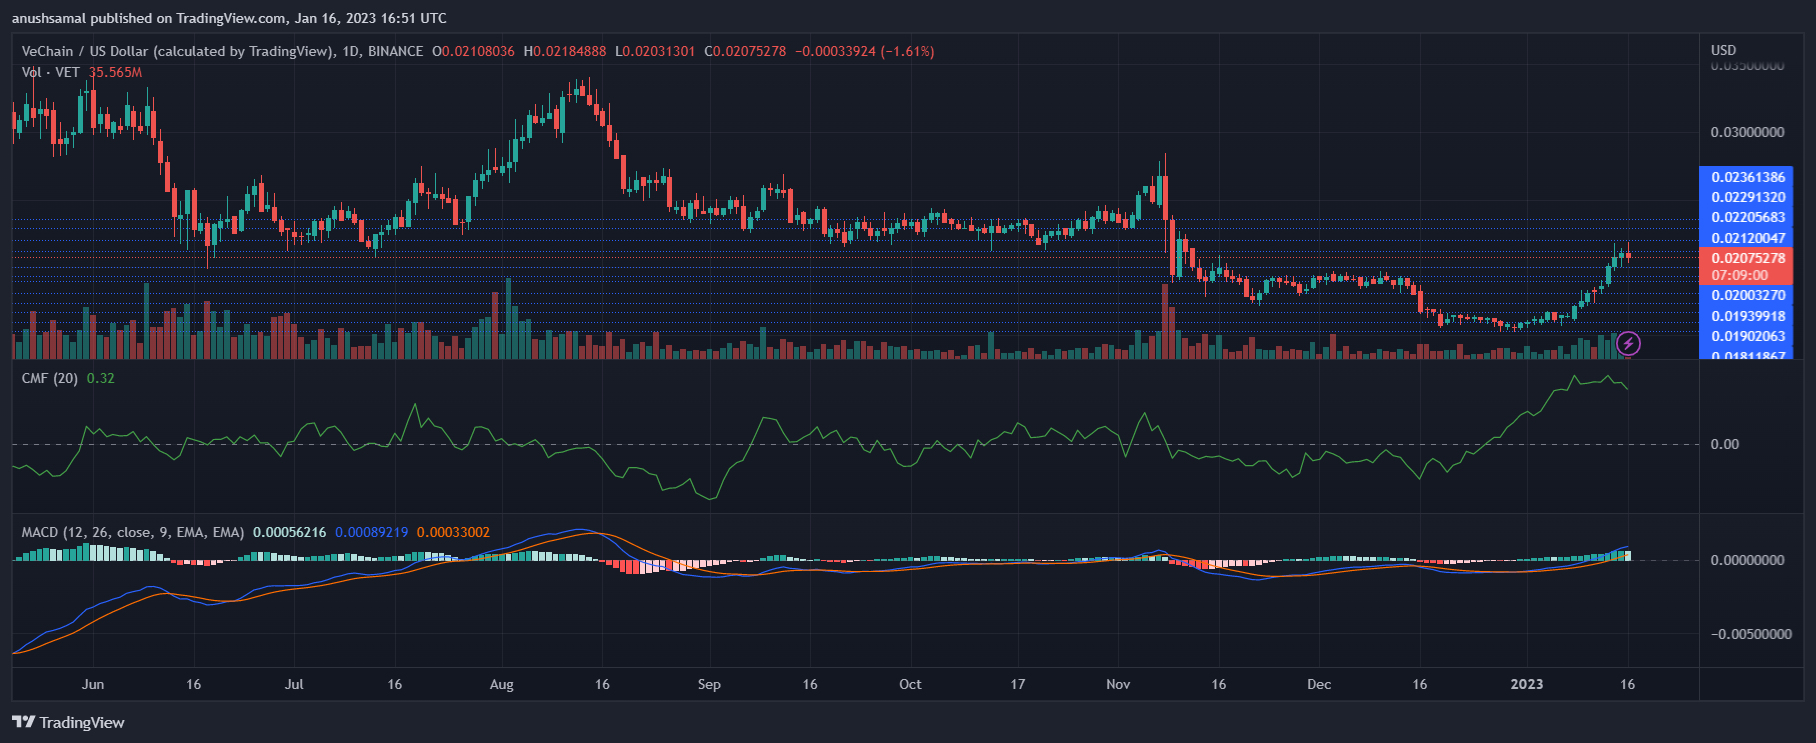
Technical indicators continued to suggest that VET hasn’t lost its bullish steam. The Moving Average Convergence Divergence, which indicates price momentum and reversals, showed green signal bars.
Green signal bars are tied to a buy signal, but the recent bar was declining in strength, implying that traders should skip buying the asset right away. The Chaikin Money Flow was above the half-line and registered a fall; the capital inflows were far higher than capital outflows despite the fall.
Overall, the market remains on the bulls’ side, but VET has to stay above its crucial support line to keep the bears from returning.
Uniswap Sellers Stop But RSI Develops Bearish UNI Price Divergence
Cryptocurrencies have been suffering higher volatility since the bear took control. For example, the fledgling crypto coin Bitcoin price plummeted to a low of ,363 on Oct 13 and then reversed to ,354 today. Unlike the other top coins creeping, Uniswap’s native token, UNI, marks higher gains. Although its price touched .50 when BTC plummeted on Thursday, UNI added over 14% following the day and claimed a .49 high.
At the time of writing, the token’s value hovers around .20, up by 0.96% in the last 24 hours. The Uniswap market cap also indicates a bullish trend, signifying the crypto winter started to ignore the project. Its capitalization has increased to .70 billion, representing a 0.24% gain.
Financial Indicators MACD Line And RSI Suggest Bearish Divergence
In line with the daily price analysis, UNI against USD presents a bullish trend ahead. The price actions form a high-low pattern which signs an uptrend for the token. As recent price moves show, investors did not miss any opportunity and connected with all swing lows. Likewise, Uniswap ended its retracement phase below in the last week and now seems to find resistance above this. The expected price range for the token in October remains between .3 to .
Opposite to the positive happenings within the UNI network, the Moving Average Convergence/Divergence (MACD) line, an oscillator used to indicate market trends, currently points toward the bearish signal for the token and crosses the line. Likewise, the Relative Strength Index (RSI) shows a bearish divergence as its peak continues falling toward the 50 zone.
UNI’s price is currently trading at .15. | Source: UNIUSD price chart from TradingView.com
Uniswap To Deploy On zkSync For Cheaper Fee And Enhanced Security
UNI is the governance token of the decentralized exchange Uniswap, which allows users to trade and sell cryptos using smart contracts. It seems users and organizations are pushing for privacy in the sector, driving adoption and positively affecting prices. For example, on Wed, 12 October 2022, Coin Center, a think tank on cryptocurrencies, filed a suit against OFAC over restrictions against Tornado Cash, a privacy mixer (decentralized cryptocurrency tumbler). In return, almost the whole market reacted by going green as the news spread.
Notably, today’s announcement by the Uniswap platform might become a catalyst to pump the token’s price further. The Uniswap exchange has declared to build on the zkSync for enhanced privacy and security.
zkSync uses novel technology, also known as ZK Rollups, to enable faster transactions with minimum gas cost. The company decided to deploy privacy-focused layer two after completing a governance vote. Offering a minimum fee without compromising on security will attract more users and accelerate the network’s activity.
The parent company of zkSync, Matter Labs, commented that this move would onboard new users. Furthermore, the low network fee than Ethereum will make the platform more attractive. The company noted in a statement;
There’s significant value in Uniswap being available on an EVM-compatible ZK Rollup. Deploying early on zkSync helps solidify Uniswap’s place as the number one DEX and a thought leader.
Therefore, with zkSynce launch on mainnet within the next six weeks, investors’ wallets may profit from the project’s growth. In addition, the token might enjoy resistance above in the coming days, which the investors are hard to manage.
Featured image from Pixabay and chart from TradingView.com
NewsBTC