 Robert Kiyosaki advises selling bitcoin amid its crash, yet plans to buy more, likening his approach to Warren Buffett’s “buy and hold forever” strategy. Vivek Ramaswamy’s chances of becoming Trump’s vice presidential pick have surged by 1,100% on Polymarket. Ripple CEO Brad Garlinghouse criticizes SEC Chair Gary Gensler, warning his actions could affect the election. […]
Bitcoin News
Robert Kiyosaki on Bitcoin Crash: Most People Should Sell — He’s Waiting to Buy More, Follow Warren Buffett’s Strategy
 Rich Dad Poor Dad author Robert Kiyosaki says most people should sell bitcoin now that the price of the cryptocurrency is “crashing.” However, he affirmed that he is waiting to buy more bitcoin, emphasizing that “all markets go up and down.” The famous author noted that his strategy is similar to Berkshire Hathaway CEO Warren […]
Bitcoin News
Rapper Iggy Azalea to Sell Phones and Cell Plans for MOTHER Token or Sol
 Australian rapper Iggy Azalea, co-founder of a telecommunication company, has announced the relaunch of the company with a unique twist. In a recent social media post, Azalea revealed that customers will now be able to purchase phones and month-to-month cell plans using $MOTHER or Sol. This move is part of a broader effort to increase […]
Bitcoin News
Buy Or Sell Bitcoin Now? Analyst Reveals Ultimate Bias Guide
In an analysis released to his 280,000 followers on X, the renowned crypto analyst known as Cold Blooded Shiller (@ColdBloodShill) provided an in-depth look at the current state of Bitcoin amidst a volatile market environment. His commentary, titled “Ultimate BTC Simple Bias Guide,” unpacks the recent emotional reactions triggered by Bitcoin’s price movements and offers a strategic framework for interpreting these changes.
Buy Or Sell Bitcoin Now?
On Friday, the Bitcoin price plummeted from ,900 to ,500. This decline coincided with the release of the US Employment Situation Summary Report, a piece of economic data that typically influences market sentiments across various asset classes, including cryptocurrencies. “It’s very easy to forget that it was simply one red candle on Friday that caused a huge reaction in the emotion of the discussion on Twitter,” Shiller writes, emphasizing the often exaggerated emotional response to single events in the crypto markets.
Cold Blooded Shiller’s technical examination of Bitcoin reveals a strong underlying uptrend, despite recent price volatility. However, he identifies critical resistance and support levels that are pivotal to understanding the future movements of Bitcoin’s price.
The ,000 price level stands as a major resistance, having thwarted Bitcoin’s upward movement five times, including the most recent rejection last Friday. Shiller elaborates, “We have resistance of the range at k,” indicating that a breakout above this level could potentially lead to significant bullish momentum.
Conversely, the support levels at ,000 and subsequently at ,000 are described as crucial for maintaining the bullish scenario. Shiller warns, “BTC needs to hold the uptrend, if we lose k, we’re once again going to be in a downtrend with this being confirmed as a LH [Lower High] and therefore negative market conditions continuing.” The further loss of ,000 could, according to him, signal the end of the current bullish cycle, with implications that could extend to a broader weekly downtrend.
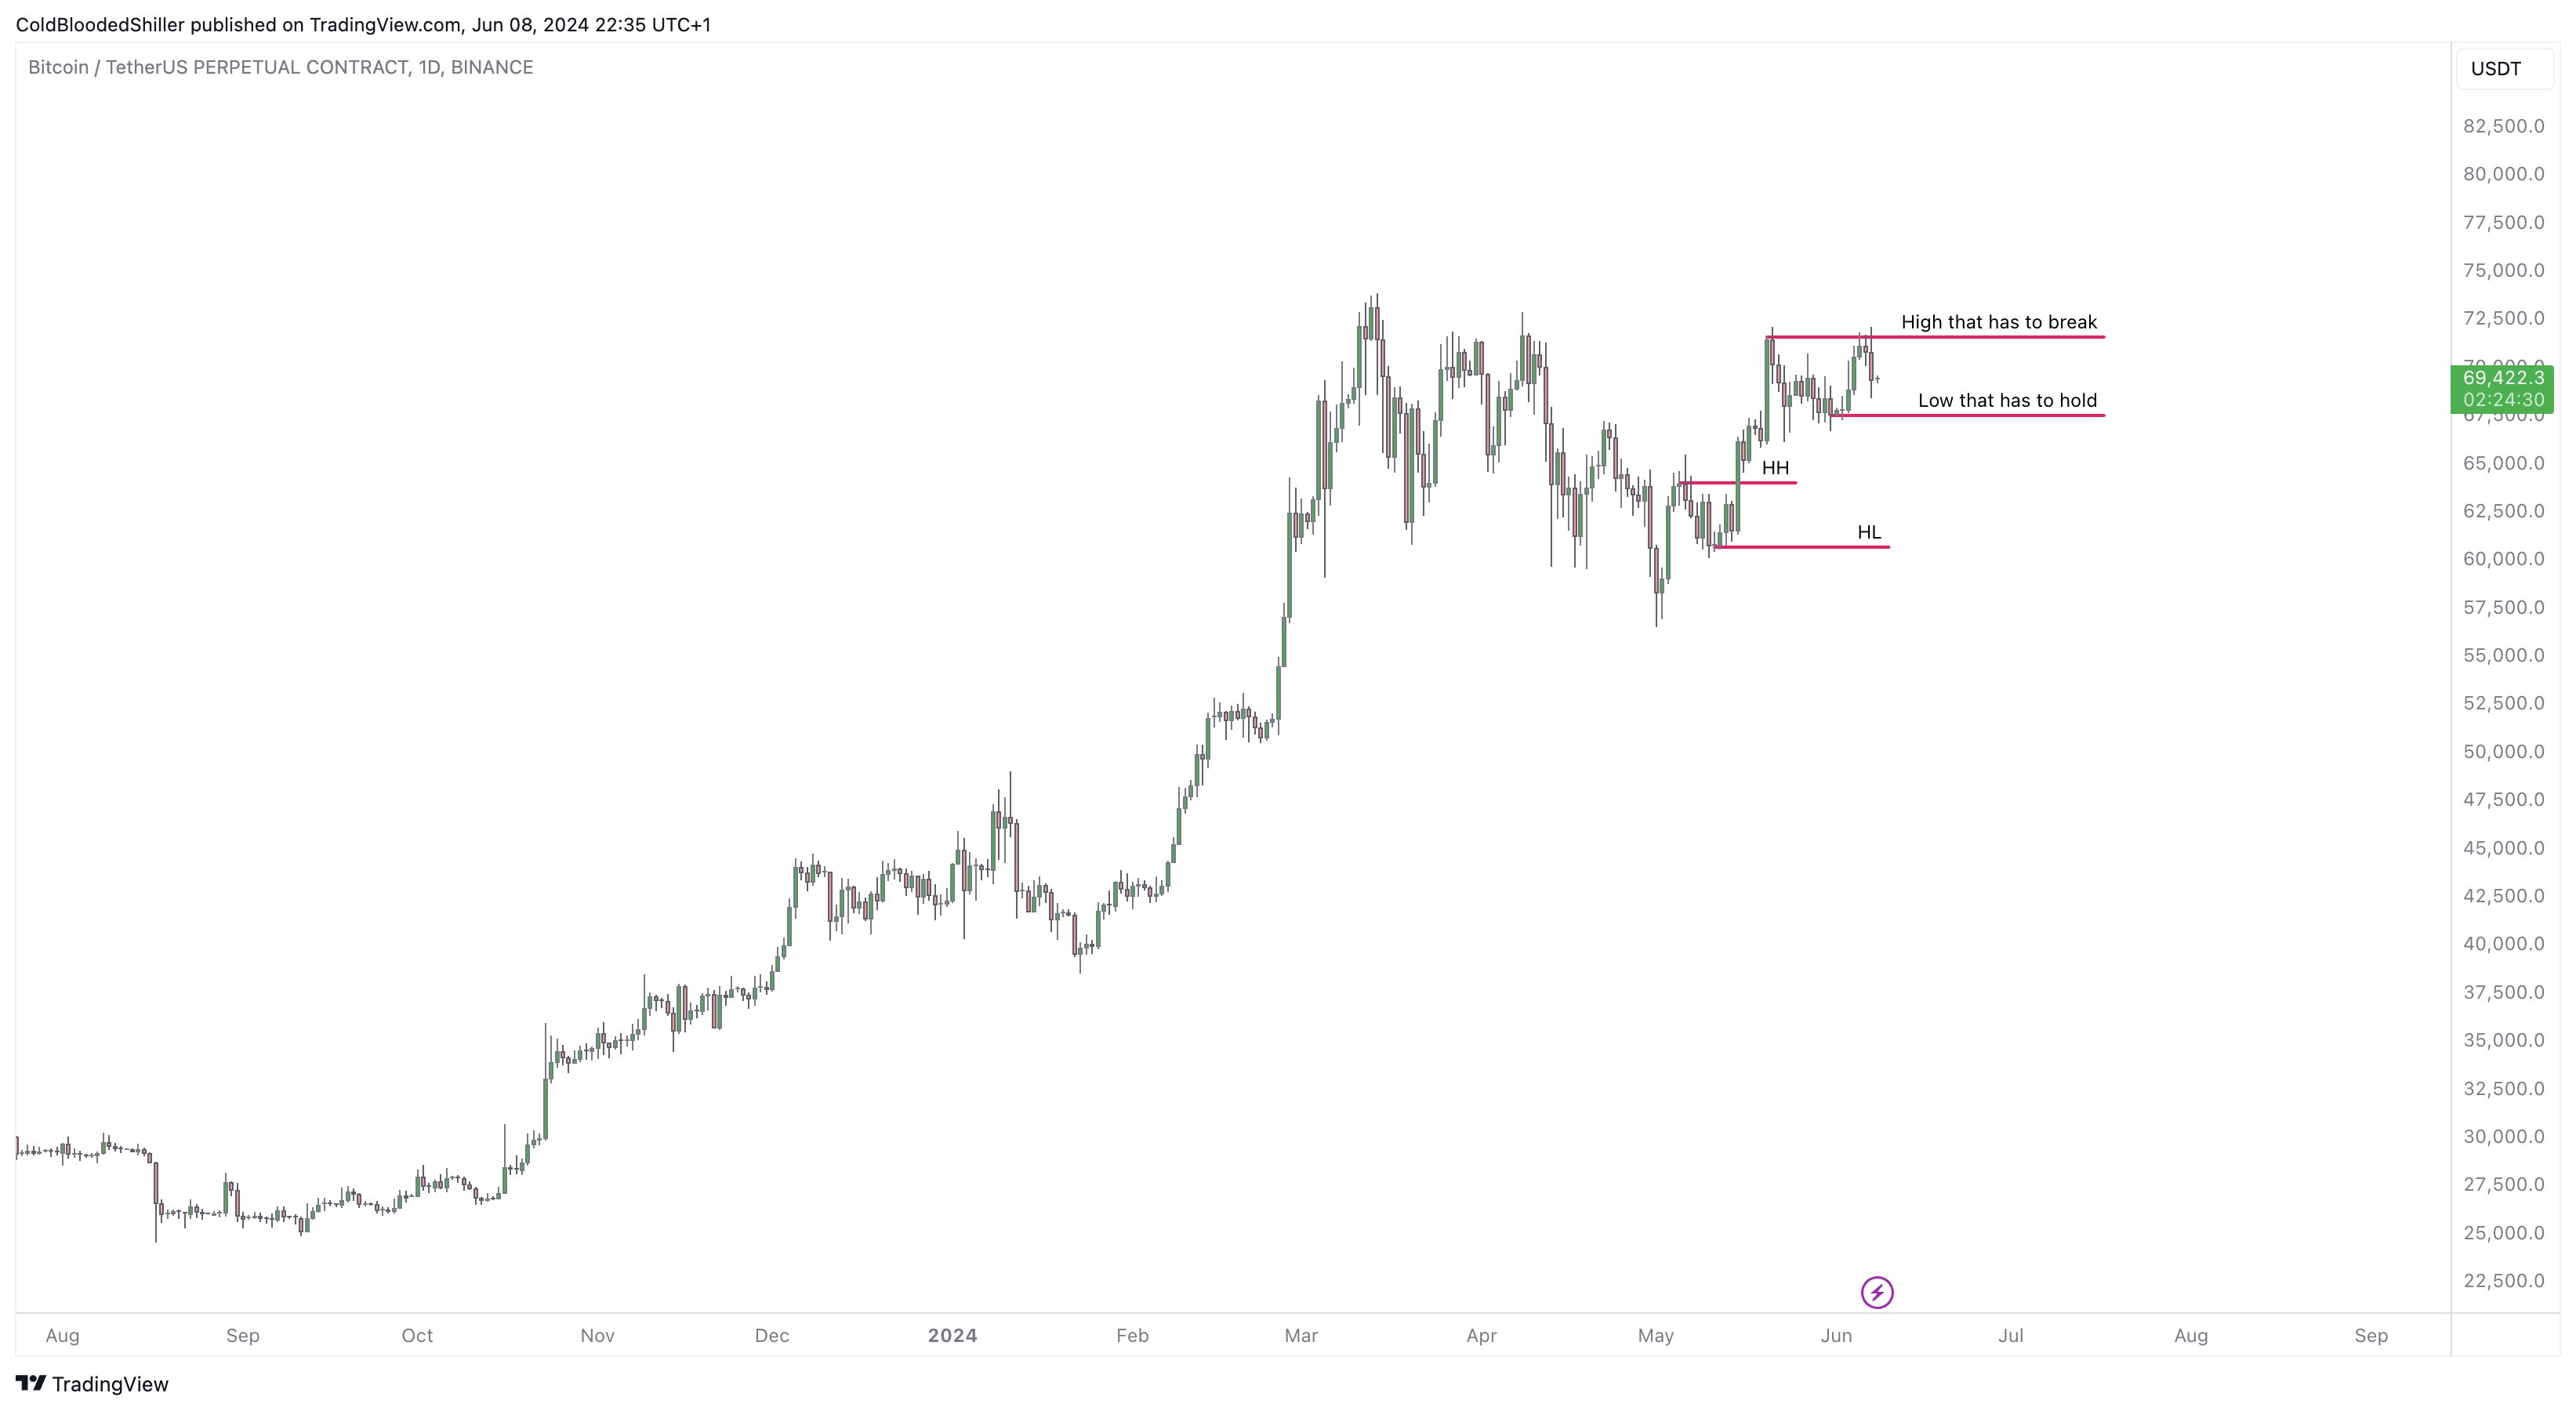
Analyzing the broader market dynamics, Shiller points out the absence of high time frame (HTF) bearish divergences on the Relative Strength Index (RSI), a common indicator used to predict potential market reversals. “As a positive, there are no HTF bear divs, which have typically been a strong signal for cycle tops. We’re clean on RSI,” he notes. This observation suggests that despite the testing of critical resistance levels, the market might not yet be at a cyclical peak, providing some reassurance to investors concerned about potential downturns.
Shiller’s guidance for traders is to maintain a watchful eye on the key price levels that will dictate Bitcoin’s short-term market direction. “The Daily needs to make a fresh high and break k; otherwise, it’s at risk of losing the Daily trend below k,” he advises, highlighting the importance of these thresholds in shaping market sentiment and trading strategies. This advice suggests that while the broader trend may still support a bullish stance, readiness to pivot based on key technical indicators is crucial.
In light of these observations, Shiller advises his followers to use these insights to strategically manage their investment portfolios. The current market conditions, characterized by attempts to break resistance at ,000 and support holding at key lower levels, imply a tactical approach to investment decisions. Traders and investors are advised to set clear markers for adjusting their positions, preparing for potential shifts in market dynamics that could influence their investment outcomes.
At press time, BTC traded at ,484.
Bitcoin Surges Past $71,000, But TD Sequential Says ‘Sell’
The Tom Demark (TD) Sequential has given a sell signal for Bitcoin after the asset broke past the ,000 level in the past day.
Bitcoin TD Sequential Is Giving A Sell Signal Right Now
As explained by analyst Ali Martinez in a new post on X, a TD Sequential signal has appeared in the 1-hour price of Bitcoin. The “TD Sequential” refers to an indicator in technical analysis (TA) that’s generally used for locating probable points of reversal in any commodity’s price.
The TD Sequential involves two phases: setup and countdown. During the first of these, candles of the same polarity (that is, whether red or green) are counted to nine. After these nine candles are in, the asset may be assumed to have encountered a turnaround.
Naturally, if the candles leading up to the setup’s completion were red, the TD Sequential would give a buy signal for the asset. On the other hand, green candles would imply a potential reversal towards the downside.
After the setup is over, the countdown phase begins. This second phase of the indicator is much like the first one, except for the fact that the number of candles to be counted here is thirteen rather than nine. The countdown’s completion implies that the price has encountered another likely point of reversal.
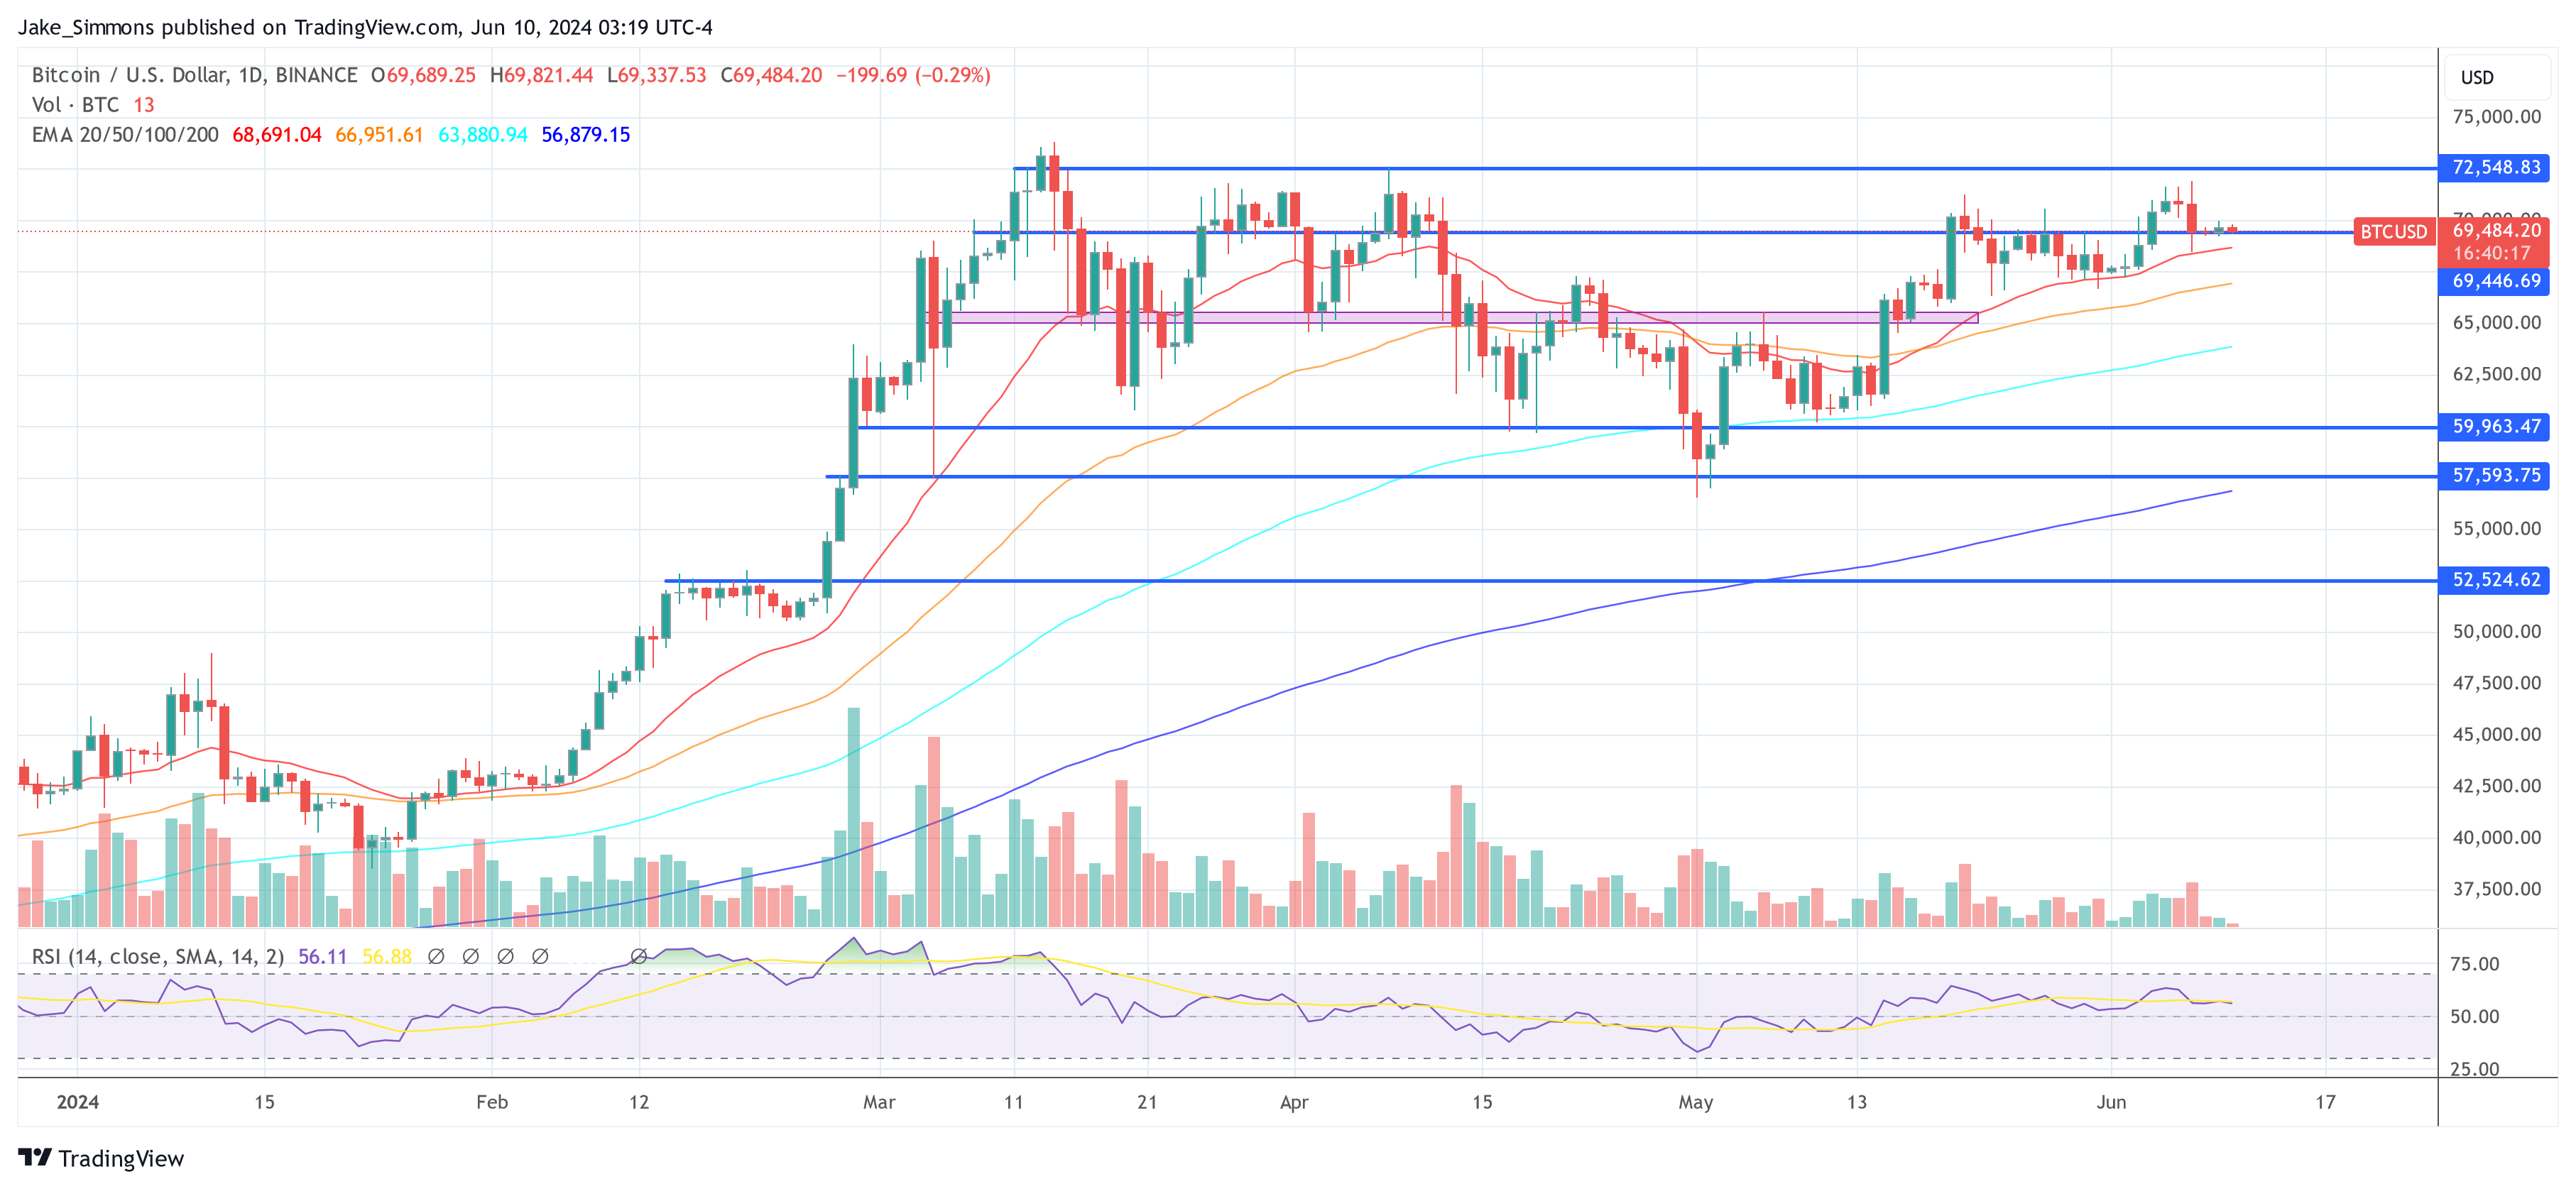
A TD Sequential phase of the former type has recently been completed in the 1-hour price of Bitcoin. Below is the chart shared by Ali that shows this pattern in cryptocurrency.
From the graph, it’s visible that TD Sequential has recently finished its setup phase with green candles for Bitcoin. This signal comes as the coin has surged beyond the ,000 level for the first time since mid-May.
This TD setup would mean that the party could already be over for now as the coin may have reached a local top, and a reversal to the down direction could be coming.
While the TD Sequential could spell a worry for BTC in the short-term, another TA indicator could point towards a bullish outcome for the asset instead. As CryptoQuant author Axel Adler Jr has pointed out in an X post, the Bitcoin Relative Strength Index (RSI) is at a level where recent uptrends have begun.
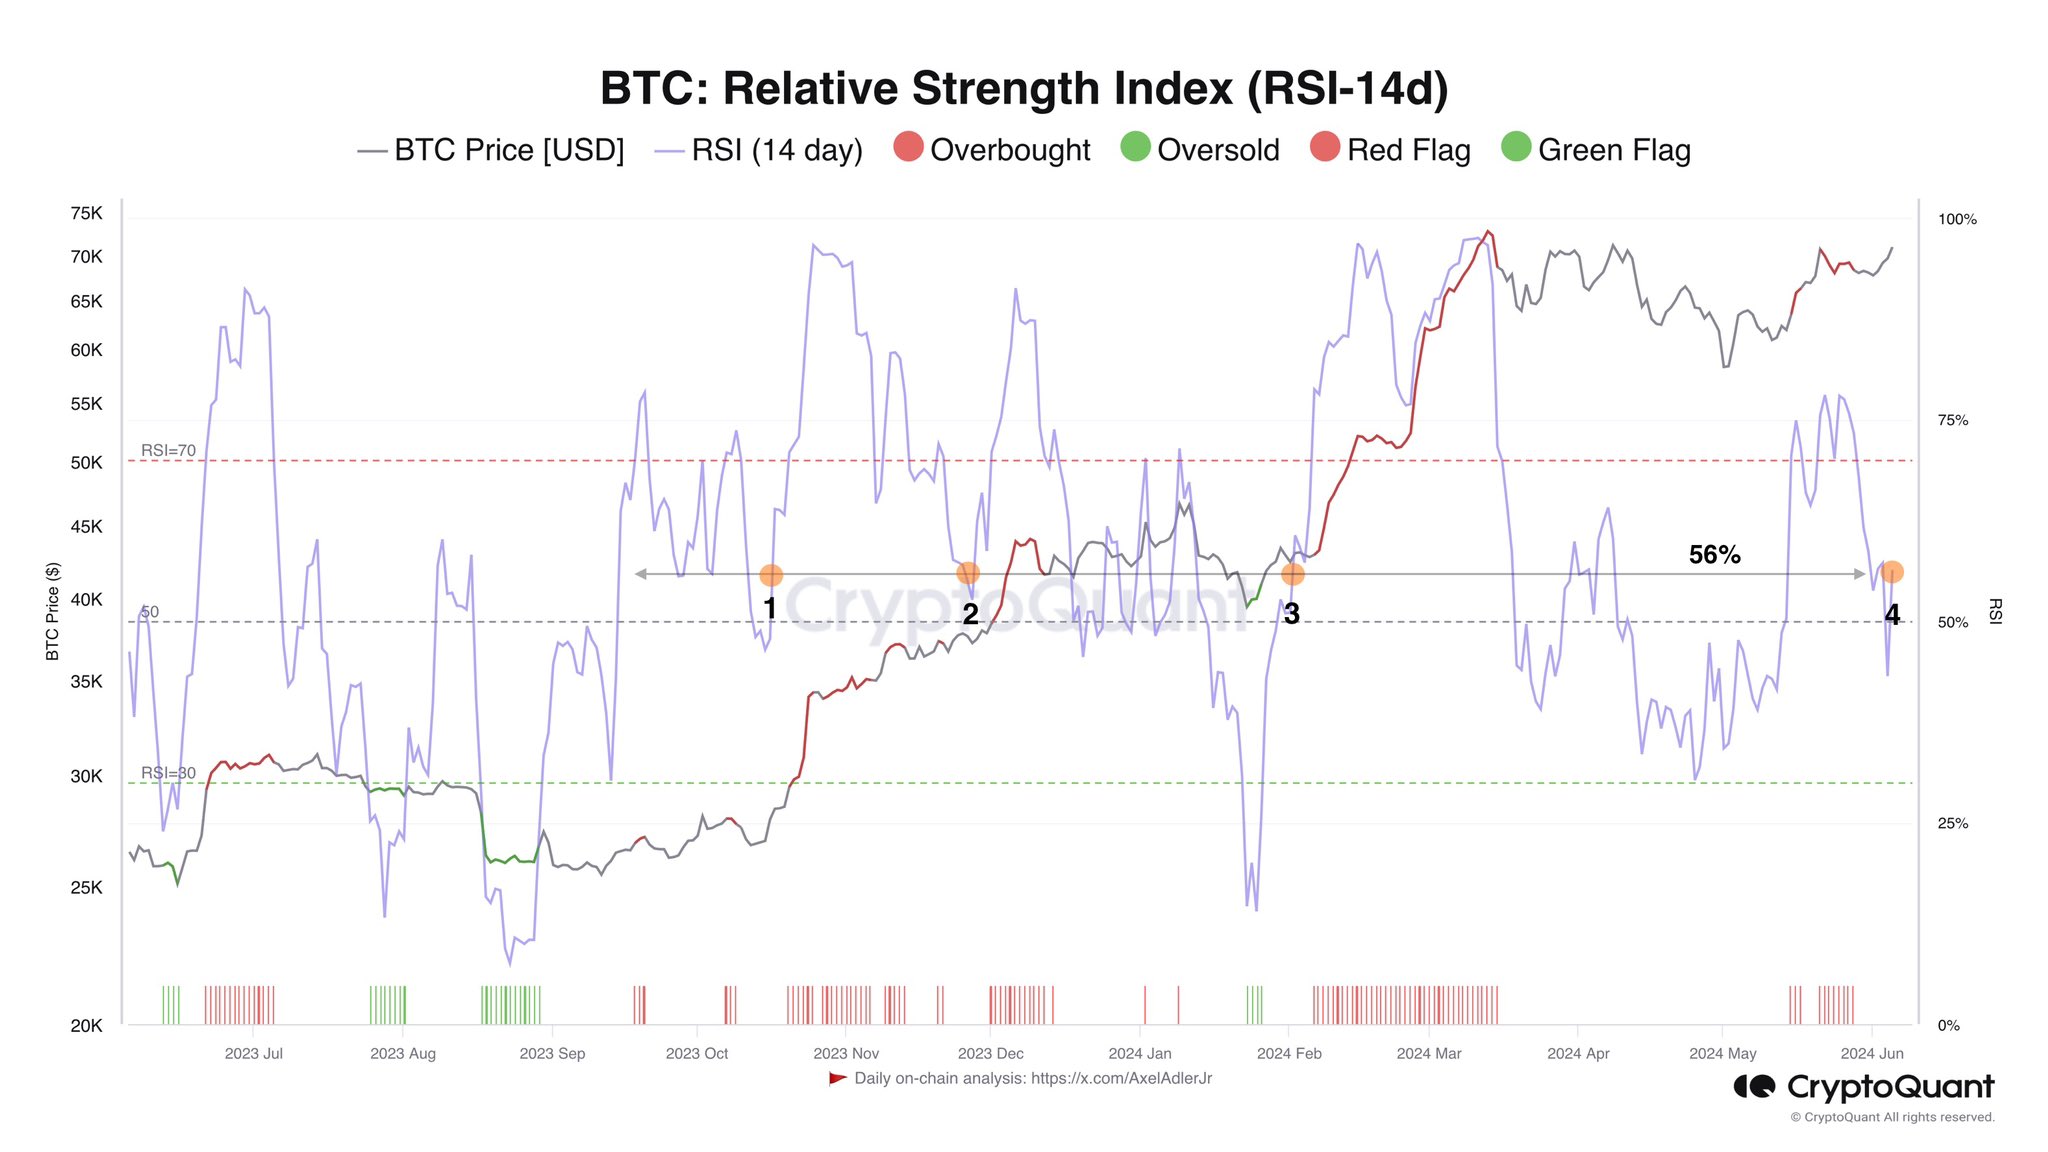
The RSI tracks the magnitude of recent changes in the price of any given asset. As the chart shows, the 14-day RSI currently has a value of 56% for BTC.
Usually, the price is considered to be undervalued when this metric drops below 30%. Strangely, the last three major uptrends in BTC began when the RSI had a value of 56%. This could be a coincidence, but BTC could see a sharp surge soon if it’s truly a pattern.
BTC Price
Despite the appearance of the TD Sequential, Bitcoin hasn’t let off yet, as the asset has climbed beyond ,600.
Buy Or Sell Bitcoin? Quant Reveals What Leading Metric Says
A quant has explained what a potential leading Bitcoin indicator could say about what’s next for the cryptocurrency’s price.
Bitcoin Coinbase Premium May Hold The Answer To Where BTC Goes Next
In a CryptoQuant Quicktake post, an analyst has talked about the trend currently taking place in the Bitcoin Coinbase Premium. “We can use the trend of Coinbase Premium as a leading indicator of the future direction of BTC price,” notes the quant.
The “Coinbase Premium” is a metric that keeps track of the difference between the Bitcoin price listed on the cryptocurrency exchanges Coinbase (USD pair) and Binance (USDT pair).
When the value of this indicator is positive, it means that the price listed on Coinbase is higher than on Binance right now. Such a trend suggests the buying pressure is higher (or the selling pressure is lower) on the former platform than on the latter.
On the other hand, the negative premium implies Coinbase might be observing a higher amount of selling than Binance, as the asset is currently trading at a lower price there.
Now, here is a chart that shows the trend in the 30-day moving average (MA) of the Bitcoin Coinbase Premium over the last couple of years:

As displayed in the above graph, the 30-day MA Bitcoin Coinbase Premium has been positive recently, suggesting that Coinbase users have supported the asset through the rally.
Coinbase is popularly known as the preferred platform of the US-based institutional entities, while Binance has a more global user base. As such, the premium’s value can provide hints about how the behavior of the American whales differs from that of the rest of the world.
From the chart, it’s visible that the buying pressure from these institutional traders peaked alongside the price top but has since been declining. The metric continues to be positive overall, although it’s now quite close to the neutral zero mark.
In the graph, the quant has highlighted an interesting pattern that the cryptocurrency has followed regarding the Coinbase Premium during the last two years. It would appear that whenever the indicator has hit bottom in negative territory and reversed back to an uptrend, the coin’s price has observed a rebound.
An example of this trend also played out just earlier in the year, when a reversal in the indicator led to Bitcoin observing a rally in which the asset would eventually break its all-time high.
The Coinbase Premium is currently riding a downtrend, but it’s yet to dip into negative territory. The analyst explains that BTC is in a “wait and see” phase, where a rebound might be a bit longer out. The metric has to first decline more and reach a reversal point, at least if the historical pattern has to repeat.
BTC Price
Bitcoin had slipped under ,000 earlier, but the asset has found a slight rebound in the past day, returning above ,700.
Bitcoin Sees Rise in Sell Calls Amid Expectations of Asian Institutional Boost
 Over the past week, bitcoin has exhibited a downward trend, with its price stabilizing at around ,950 to ,125 per unit as of April 27. Despite this dip, the Crypto Fear and Greed Index remains firmly in the “greed” sector. According to Google Trends, interest in the term “bitcoin” has diminished, while the market intelligence […]
Bitcoin News
Bitcoin Sell Calls Going Through The Roof: But Is It Really Time To Sell?
The story has not been any much different for Bitcoin, with its price still stuck in a consolidation range in the past week. The sluggishness of the premier cryptocurrency – and the general market – has continued despite the completion of the halving event over a week ago.
The halving event, which saw mining rewards take a significant cut, was expected to usher in another round of bullishness for the Bitcoin price. On the contrary, investors appear to be getting frustrated with the slow activity of the market, with many calling for the dump of BTC.
Bitcoin Sell Calls At Increased Rate: Blockchain Firm
According to a recent report by on-chain analytics firm Santiment, investors are increasingly calling for the sale of Bitcoin across social media following its latest drop toward ,000. The relevant metric here is the “social volume” indicator, which tracks the number of unique posts and messages on different social platforms that mention a specific topic.
Santiment aggregated data of “buy or bullish”, “sell or bearish,” or related mentions for the premier cryptocurrency over the past week. The on-chain analytics then highlighted a shift in the trend, with the bearish calls looking to drown out the bullish noise on social media.
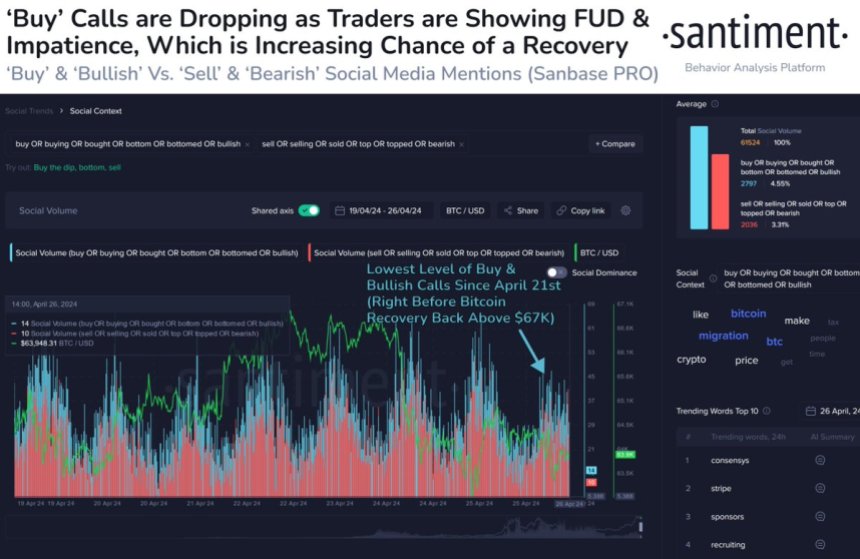
According to Santiment, Bitcoin’s recent fall to ,000 resulted in the lowest level of buy and bullish calls since April 21st (just before BTC recovered back above ,000). As shown in the chart above, the social volume for terms related to “sell” shot up after the price decline.
Typically, the increased bearish mentions of Bitcoin suggest a rising level of FUD (fear, uncertainty, and doubt) amongst investors. However, when traders seemingly become frustrated and impatient, there is usually a higher probability of a market rebound.
Almost 90% Of Circulating BTC In Profit – Impact On Price
According to recent on-chain data, about 90% of Bitcoin in supply is in profit. On the surface, this basically implies that the most current holders of the premier cryptocurrency bought at a lower price compared to the current price.
However, this level of profitability can also be an overbought signal, especially after bullish periods like the one that occurred between October 2023 and March 2024. Ultimately, this suggests investors could see Bitcoin shed more of its price gains over the next coming weeks.
As of this writing, Bitcoin is valued at ,077, reflecting a 2% price decline in the past 24 hours.
Bitcoin Forms Death Cross & TD-9 Sell Signal: Brace For Impact?
An analyst has explained how Bitcoin is forming both a death cross and TD sell signal, which may lead to potential dips in these targets.
Bitcoin Looking In Trouble As 12-Hour Chart Forms Two Bearish Signals
In a new post on X, analyst Ali discussed two signals that have recently formed in Bitcoin’s 12-hour chart. The first of these is a “death cross,” which occurs when an asset’s short-term simple moving average (SMA) dips below its long-term SMA.
Regarding the death cross, the 50-day and 100-day SMAs make up for the short-term and long-term trend lines. Historically, such formations have been considered bearish signals, with the price potentially suffering once the pattern is confirmed.
The other signal that has appeared for the cryptocurrency involves the Tom Demark (TD) Sequential. This indicator is popularly used for finding locations of probable tops and bottoms in any asset’s price.
The TD Sequential has two phases: the “setup” and “countdown.” The first phase, the setup, is said to be complete once the asset has gone through nine candles of the same polarity. After these nine candles, the price may have reached a likely reversal point.
Naturally, if the candles in the setup’s formation were red, then the signal would be a buy one, while if the prevailing trend were bullish, the reversal would be towards the downside.
Once the setup is complete, the countdown phase begins. This phase works much like the setup, except that candles are counted up to thirteen instead of nine. After the countdown’s completion, the commodity may be assumed to have reached another potential top/bottom.
Now, here is the chart shared by Ali that highlights how signals about both of these technical analysis patterns have been witnessed in the 12-hour price of Bitcoin recently:
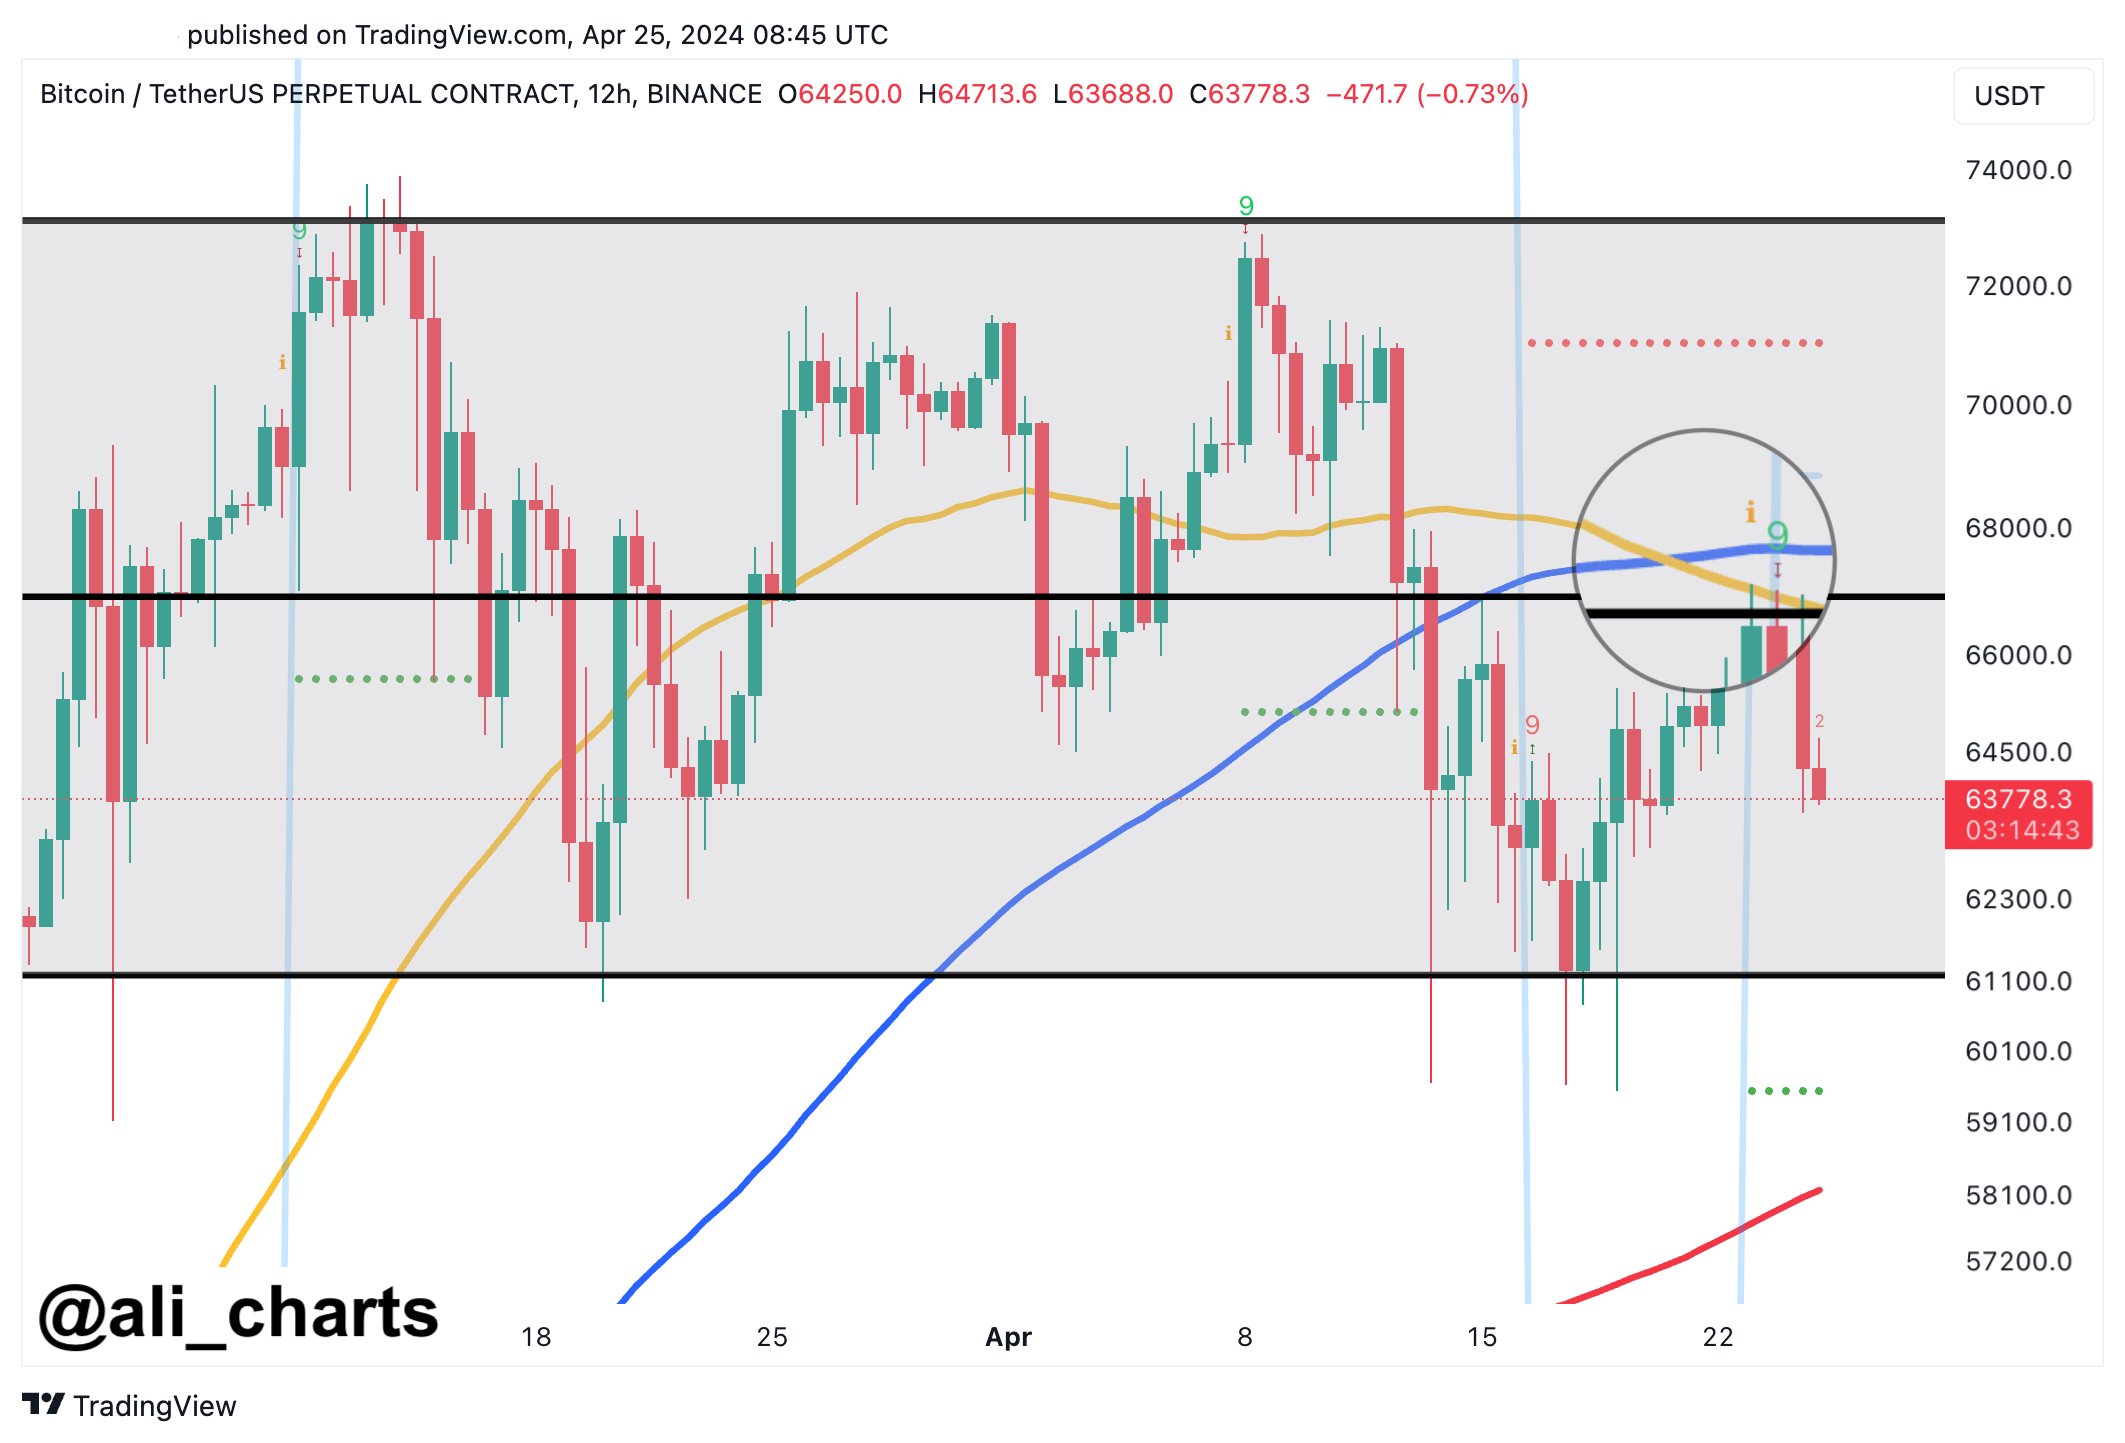
As is visible in the graph, the 12-hour price of Bitcoin first saw a death cross form with the 50-day SMA moving under the 100-day SMA. Then, it observed the completion of a TD Sequential setup, with the indicator suggesting a reversal to the downward direction.
Since this double bearish pattern has appeared, BTC has been heading down, suggesting that these signals may already be in effect. “If BTC falls below ,300, brace for possible dives to ,000 or even ,000,” says the analyst.
From the current price of the cryptocurrency, a potential drawdown to the first of these targets would mean a decline of 4.6%, while one to the latter level would suggest a drop of nearly 8%.
BTC Price
So far, Bitcoin has managed to prevent falls under the ,300 target listed by the analyst, as it currently floats around ,000.
Brace For Impact: Worldcoin Team Plans To Sell 1.5 Million WLD Tokens Every Week For 6 Months
Worldcoin (WLD) could be the victim of a significant downtrend in the coming weeks. The team plans to sell as many as 1.5 million WLD tokens over the next six months, which could bring about massive selling pressure and affect the token’s price.
Details About The Proposed WLD Token Sale
Worldcoin revealed in a blog post that World Assets (a subsidiary of the Worldcoin Foundation) will sell between 500,000 and 1.5 million Worldcoin tokens weekly to a group of institutional trading firms outside the United States. This token sale will be done through private placements and is expected to last up to six months.
Therefore, as many as 36 million WLD tokens could be sold under this arrangement. Interestingly, these tokens do not form part of the current circulating supply, as Worldcoin stated that “the circulating supply of WLD will thus increase correspondingly” as the token sales progress. That means Worldcoin’s circulating supply could see an 18.6% increase to over 229 million WLD tokens once the private sale is done.
This development is undoubtedly a cause for concern for WLD holders, given the impact it could have on the crypto token’s price action. However, Worldcoin tried to downplay the effect of this token sale, noting that a weekly sale of between 500,000 and 1.5 million WLD tokens represents “less than 0.1% to 0.4% of the current weekly trading volume.
Meanwhile, World Assets “may seek to include a 40-day lock-up period restricting the resale of WLD by trading firms,” Worldcoin remarked. This could also help reduce the high volatility that could arise from an immediate sell-off by these trading firms.
The Worldcoin Ecosystem
WLD is the native token of Worldcoin, a project that focuses on the digital verification of humans. Users in the Worldcoin ecosystem get verified through a device called the “Orb.” Since launching last year, the project, co-founded by Open AI’s CEO Sam Altman, has drawn criticism, with many, including Ethereum’s co-founder Vitalik Buterin, raising privacy and legal concerns.
Authorities in different countries have investigated the project as they believe its data collection method may have breached certain privacy laws. NewsBTC also recently reported that Worldcoin faces a potential fine of .2 million in Argentina for violating the country’s National Consumer Protection Law.
Despite the regulatory scrutiny, the team is still looking to expand. In the blog post, they hinted that the proceeds from this token sale will be directed towards meeting the “increasing demand for orb-verified World IDs around the world.”
At the time of writing, Worldcoin is trading at around .4, down over 6% in the last 24 hours, according to data from CoinMarketCap.