![]() The U.S. Supreme Court has struck down Chevron deference, a doctrine that allowed federal agencies broad discretion in interpreting ambiguous statutes. This decision is seen as a pivotal shift towards greater regulatory clarity and judicial oversight, especially impacting the digital assets sector. Supreme Court Overturns Chevron Deference, Paving Way for Regulatory Clarity in Digital Assets […]
The U.S. Supreme Court has struck down Chevron deference, a doctrine that allowed federal agencies broad discretion in interpreting ambiguous statutes. This decision is seen as a pivotal shift towards greater regulatory clarity and judicial oversight, especially impacting the digital assets sector. Supreme Court Overturns Chevron Deference, Paving Way for Regulatory Clarity in Digital Assets […]
Bitcoin News
Bitcoin Whale Indicator Flashes Signal Last Seen Before 480% Surge In Mid-2020
CryptoQuant CEO Ki Young-Ju today pointed out significant similarities in Bitcoin’s market behavior between the current state and mid-2020, a period marked by stagnant prices but high on-chain activity. Young-Ju’s insights were illustrated with two key charts and shared via a post on X, drawing parallels that suggest a robust undercurrent of large volume transactions, potentially outside the public exchange networks.
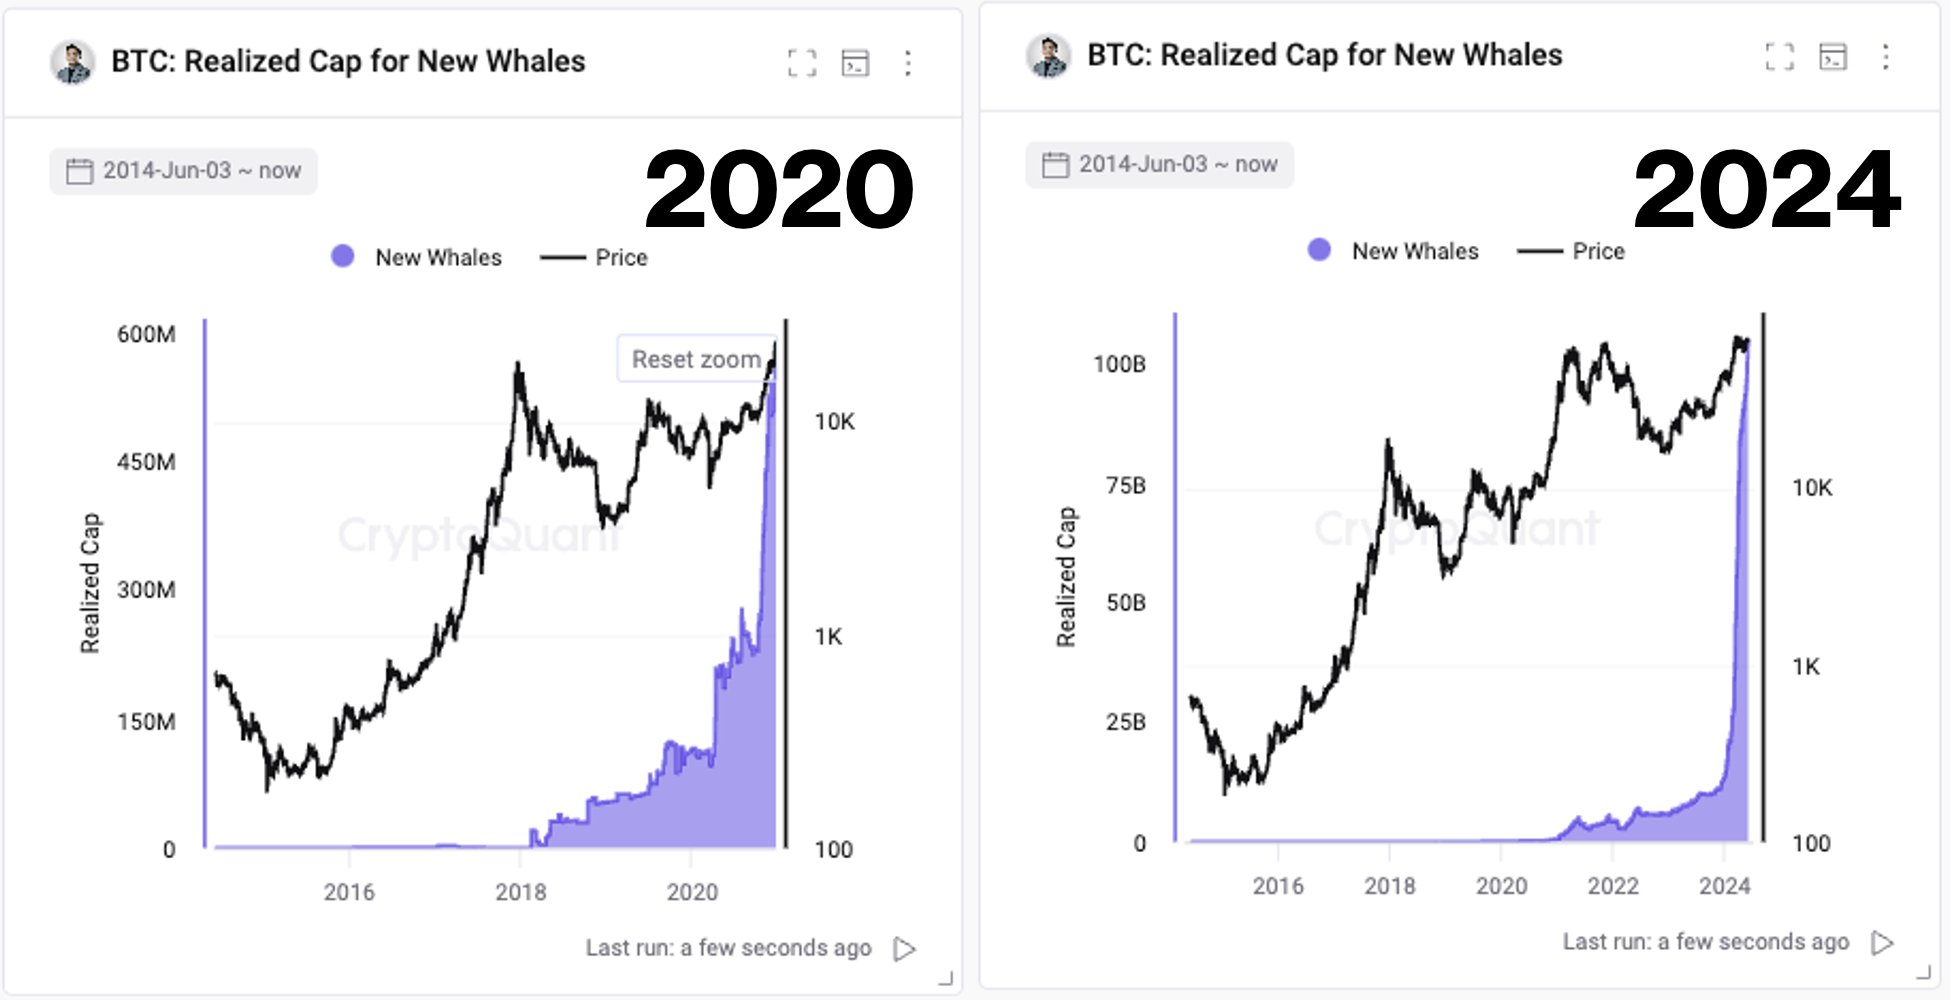
The first chart, representing data up until 2020, shows Bitcoin’s price alongside the realized cap for new whales – a metric that tracks the aggregate value at which the newly acquired Bitcoin by large investors was last moved. It’s a different form of market capitalization that assesses each UTXO at the price it last changed hands, rather than its present market price. This metric reflects the actual realized value of all the coins in the network, rather than their current market value.
This value experienced a sharp increase around mid-2020, precisely when Bitcoin’s price was caught in boredom just like in recent months, consistently trading around the ,000 mark. According to Young-Ju, this period was characterized by high on-chain activity which later analysis suggested involved over-the-counter (OTC) transactions among institutional players.
In the second chart, extending to 2024, a similar pattern emerges with even more pronounced growth in the realized cap for new whales, despite Bitcoin’s price showing a sideways movement for almost 100 days now. The chart indicates a significant addition of about billion daily into new whale wallets, a term typically referring to addresses holding large amounts of Bitcoin, often linked with institutional or highly capitalized individual investors.
What This Means For Bitcoin Price
Ki Young-Ju elaborated on these observations: “Same vibe on Bitcoin as mid-2020. Back then, BTC hovered around k for 6 months with high on-chain activity, later revealed as OTC deals. Now, despite low price volatility, on-chain activity remains high, with B added daily to new whale wallets, likely custody.”
He further referenced a tweet from September 2020 that corroborated his analysis, noting that the “number of BTC transferred hits the year-high, and those TXs are not from exchanges. Fund Flow Ratio of all exchanges hits the year-low. Something’s happening. Possibly OTC deals.”
This comparison and the sustained high level of the realized cap for new whales suggest an ongoing accumulation phase among large-scale investors, reminiscent of the activity observed in mid-2020. Such movements are generally not visible on traditional crypto exchanges and indicate a strong institutional interest that could be a precursor to significant market moves. Following Young-Ju’s tweet, BTC price rallied by 480% from September 2020 till November 2021.
If a similar move is brewing for Bitcoin price remains to be seen, but the continuous growth in Bitcoin holdings among new whales, along with sustained price levels, points to a potential buildup of pressure beneath the apparent calm of the market surface. As observed in the past, such conditions may lead to substantial price movements once the accumulated Bitcoin begins to impact the broader market through either increased liquidity or renewed trading interest.
At press time, BTC traded at ,271.
Bitcoin Seen Breaching $73,000 As ‘Bull Run’ Looms, Analyst Says
After a two-month breather near its all-time high, Bitcoin (BTC) appears ready to unleash another haymaker, according to crypto analyst Axel Adler. Adler predicts a 300-day bull run fueled by healthy short-term holder profits and a market with plenty of fight left in it.
Profitable Punches And Room For More
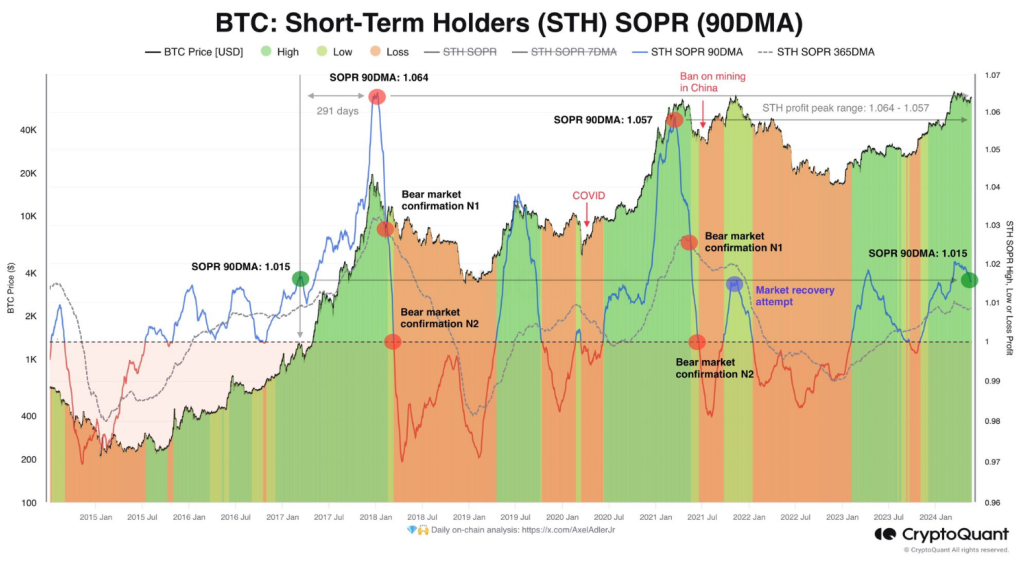
Adler throws down the gauntlet with data on Short-Term Holder Spent Output Profit Ratio (STH SOPR). This metric reveals if short-term holders are cashing out at a profit.
Currently, the 90-day moving average for STH SOPR sits at 1.015, indicating short-term holders are in the green but haven’t reached the knockout blow levels seen in previous bull runs (around 1.06). This suggests there’s room for more profit-taking punches before the bulls grow weary.
I’ve already mentioned that the bull market is in full swing. Barring any unforeseen Black Swan events, it could last for approximately another +/- 300 days.
This is based on the P&L analysis of Short-Term Holders with a 90-day moving average. pic.twitter.com/30OgsruvOi
— Axel
Adler Jr (@AxelAdlerJr) May 21, 2024

Open Interest: The Untapped Reserve Of Strength
Another weapon in the bull’s arsenal is Open Interest (OI), a metric reflecting the total amount of outstanding derivative contracts (futures and options) held by traders.
While the recent price surge has been impressive, the 7-day moving average for OI hasn’t witnessed the dramatic rise seen in prior bull runs. This, according to Adler, signifies a hidden reserve of strength in the market, with more firepower waiting to be unleashed.
Technical Edge: Bulls Have Momentum On Their Side
But technical analysis isn’t just about fancy ratios and cryptic charts. Adler identifies several technical indicators that paint a bullish picture. The Relative Strength Index (RSI), a gauge of momentum, hasn’t broken past 70, a level often associated with overbought conditions.
This suggests the current rally is healthy and sustainable. Additionally, the Chaikin Money Flow (CMF) has surged past positive 0.05 territory, indicating significant capital inflow and a growing appetite for Bitcoin among investors.
Can The Bulls KO Resistance Levels?
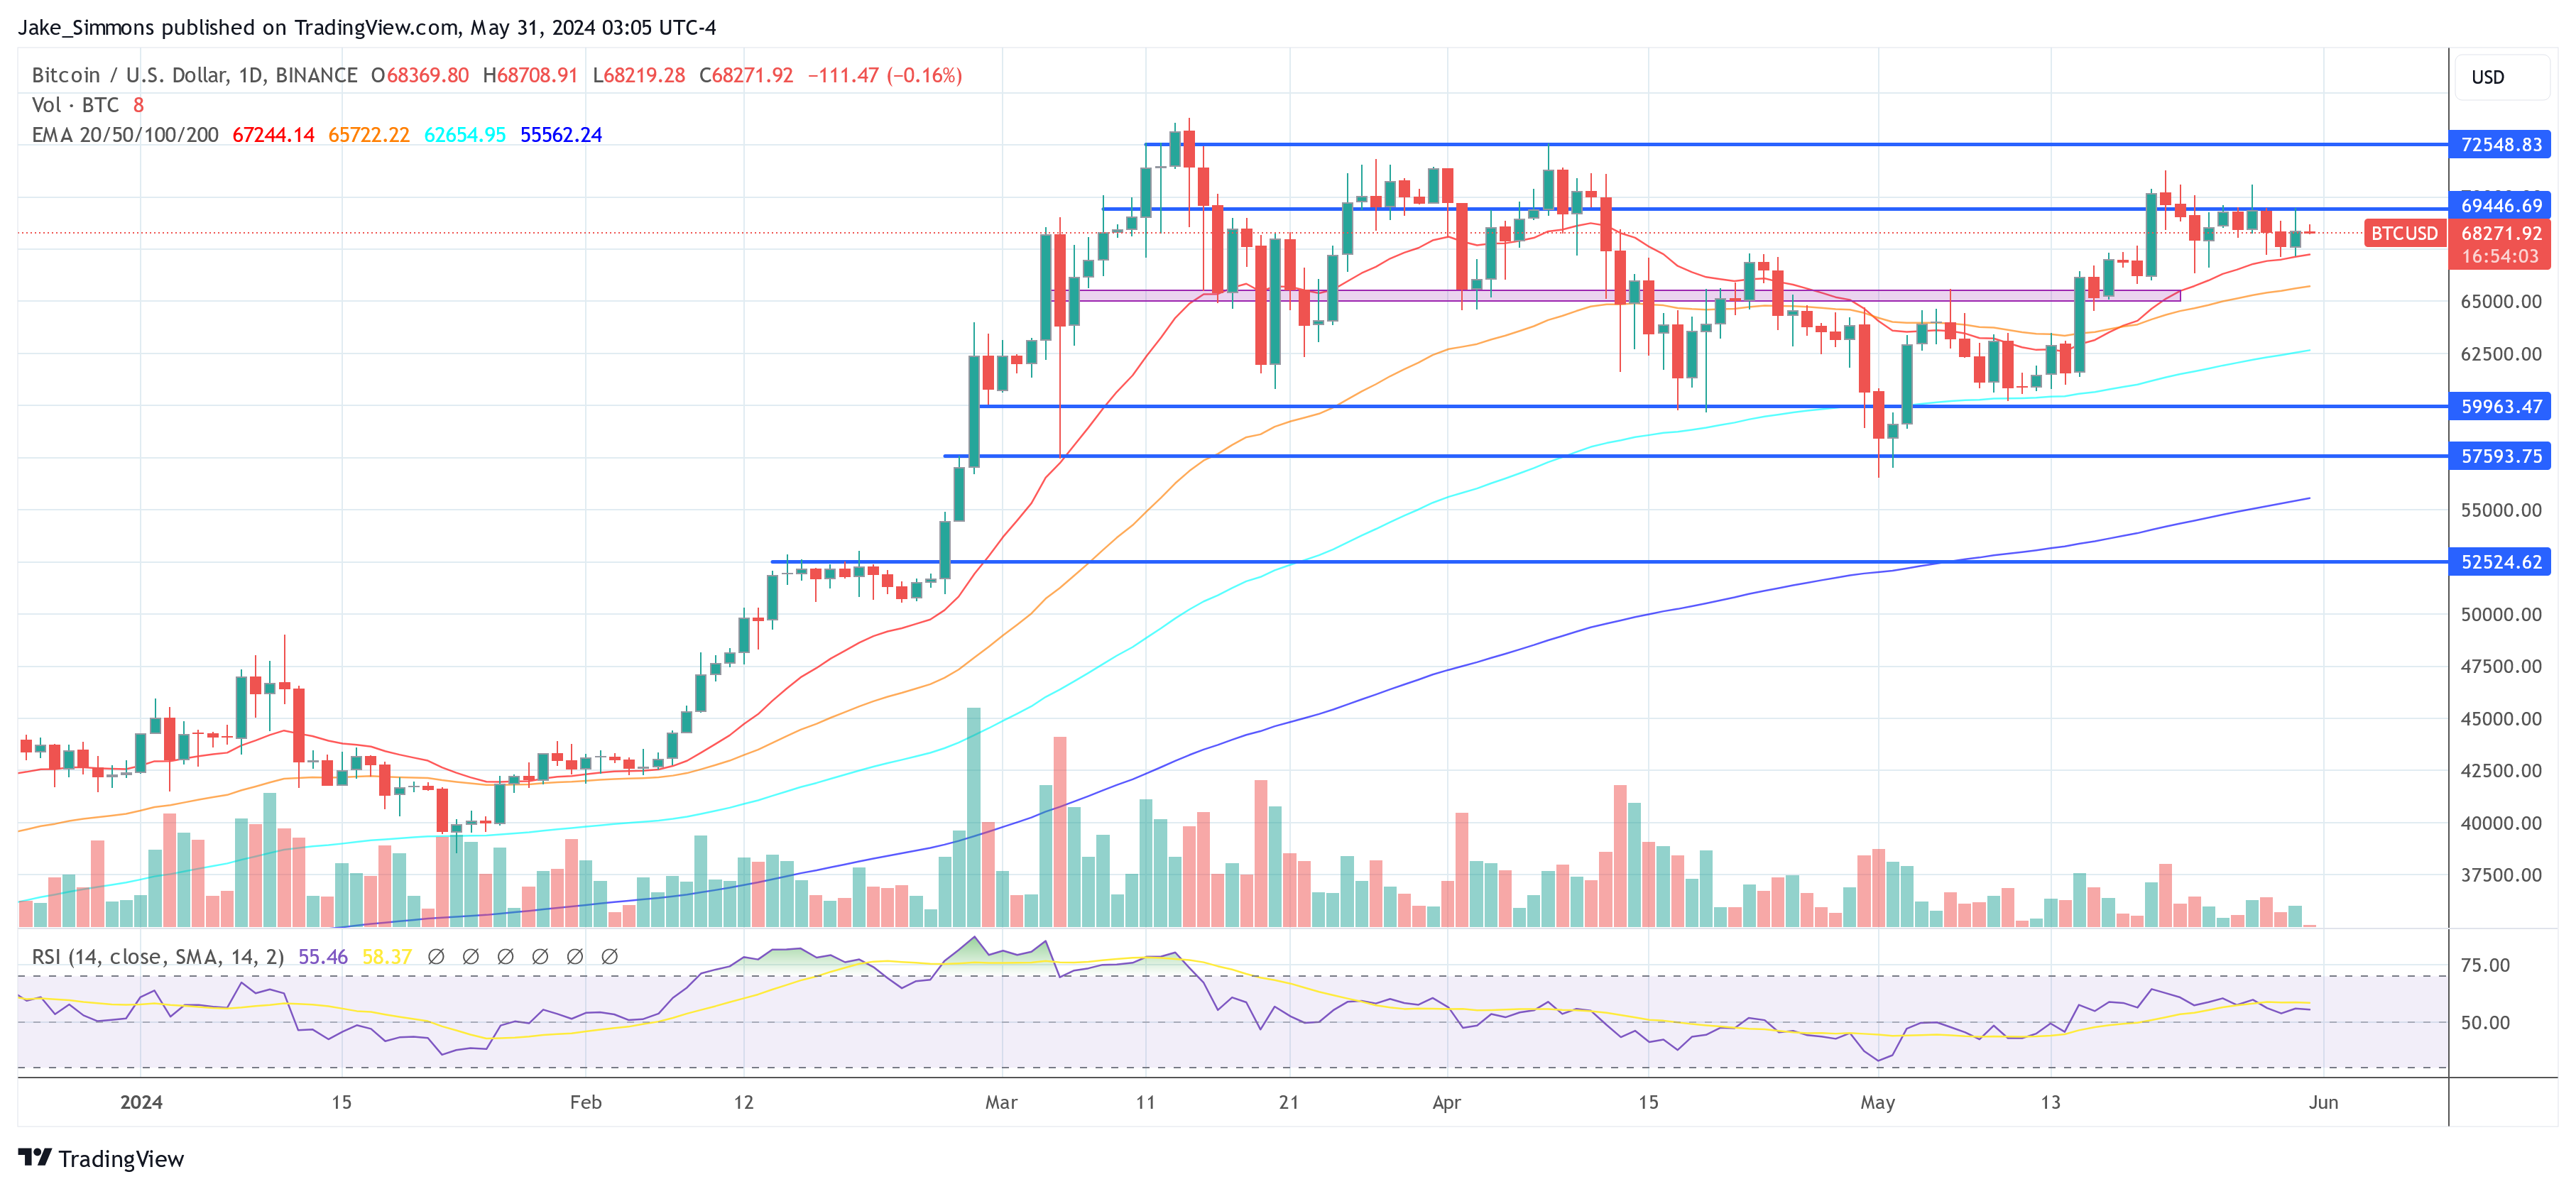
While the bulls seem to have the upper hand, there are still hurdles to overcome. Key resistance levels loom at k, k, and k, identified using Fibonacci extension levels. These price points could act as roadblocks for the surging Bitcoin price.
However, if the current momentum continues, these resistance levels could be shattered, paving the way for a potential retest of the all-time high at ,700 and a possible upward motion beyond.
Featured image from Screen Rant, chart from TradingView
Stablecoin Market Hits $160 Billion, Reaching Heights Not Seen Since Terra’s Crash
 This week, the value of the fiat-pegged cryptocurrency economy has climbed to 0 billion, a peak last observed in May 2022, shortly before Terra’s UST detached from its intended parity on May 9, 2022. In the past month, various stablecoins have experienced an increase in supply, with Ethena’s USDE at the forefront, registering a […]
Bitcoin News
Bitwise Sees ‘Raging’ Bitcoin Bull Market — Expects April Halving to Be ‘the Most Impactful We’ve Seen”
 Bitwise Asset Management believes that “bitcoin is in a raging bull market” in the long term. Its chief executive anticipates the upcoming bitcoin halving to be “the most impactful we’ve seen.” The firm’s chief investment officer explained that global wealth managers allocating just 1% of their portfolios to bitcoin would mean about trillion of […]
Bitcoin News
Bitcoin Fisher Transform Reaches Critical Level Not Seen Since 2021, What This Means
The Bitcoin price has had a rocky start to the new week after losing its footing above ,000 on Tuesday. However, all hope is not lost, as indicators still point to a continuation of this trend. Crypto analyst Tony The Bull has identified an important trend in the Bitcoin chart which could trigger a continuation of the trend back above ,000.
Bitcoin 1-Week Fisher Transform At Crucial Point
In an analysis posted on X (formerly Twitter), the crypto analyst shared a chart that showed the Bitcoin Fisher Transform in comparison to price. Most importantly, the chart showed the 1-week Fisher Transform and how it has moved since 2017.
The analysis shows some similarities between the current trend and the trends seen in 2017. A similar trend was also seen in 2019 and 2021, where the Fisher Transform rose rapidly before falling. But the importance of this trend lies in where the Fisher Transform heads next from here.
The current important level is the 1.5 Standard Deviation, which has been a crucial point whenever this trend has occurred. Now, if the Fisher Transform is able to stay above this level, it is bullish for the price. However if it falls below this standard deviation, it is very bearish for the price.
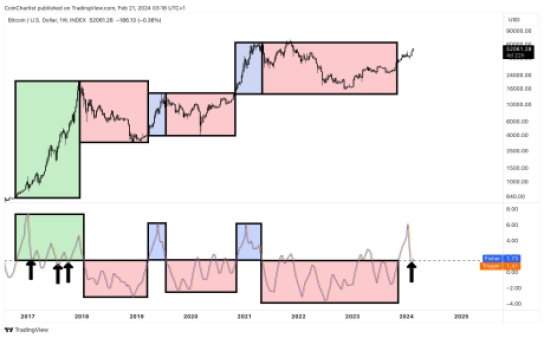
“This is a pivotal area based on historical price action and its exhibiting 2017-like behavior not seen in 2019 or 2021,” the crypto analyst explains. “Below it tends to incite bearish trends, while holding above gives bulls extra vigor.”
Bears And Bulls Vie For Control Over BTC Price
The interest in the next direction of the Bitcoin price has seen bulls and bears lock horns over which camp will reclaim control of BTC. This has seen the price of the digital asset fluctuate wildly over the last few days, going from ,000 to below ,000, before bouncing back up once again in the early hours of Wednesday.
This tug-of-war continues to hold the price of Bitcoin down, but investor sentiment seems to be climbing even through this. According to the Bitcoin Fear & Greed Index, investor sentiment has reached Extreme Greed for the first time in one year.
Historically, the index going into extreme greed has signaled the top of the market, with prices trending downward not too long after. However, Bitcoin is still seeing positive indicators, with its trading volume rising more than 40% in the last 24 hours alone.
Australian Cash Use in Decline as 75% of Residents Now Seen as ‘Low Cash Users’
On Dec. 12, Michele Bullock, the governor of the Reserve Bank of Australia, revealed that as much as 75% of Australians are now considered to be “low cash users.” Bullock also noted that the reduction in the use of cash for transactions is putting a strain on the cash distribution system.
Australian Senior Citizens Still Using Cash
According to Michele Bullock, the governor of the Reserve Bank of Australia (RBA), the share of payments made via cash fell from 70% in 2007 to just 13% in 2022. This decline in cash’s share of payments by Australians is further exemplified by the over 0 million (AUD 1.1 billion) drop in the total value of cash in circulation during the 2022-23 financial year.
Bullock, who spoke at the recent Australian Payments Network Summit, said cash is still an important means of payment and storing value for some residents. For instance, while three-quarters of Australians are now seen as “low cash users,” the elderly and those residing in certain regional areas use cash for at least 80% of their purchases.
However, despite remaining an important method of payment, the scale of the drop in cash use has created new problems for the central bank.
“The challenge we face is that as the transactional use of cash declines, it is affecting the economics of providing cash services and putting pressure on the cash distribution system,” Bullock said.
To highlight the extent of the problem, Bullock revealed that Linofox Armaguard, a cash transporter whose merger with rival Prosegur was approved earlier in the year, is now blaming the decline in cash use for its misfortunes. Bullock said Australia is now looking at solutions such as the cooperative model which has been proposed by countries that face similar problems.
The RBA governor also suggested that Australians’ declining use of cash is forcing banks to reduce the number of cash access points including ATMs and bank branches. In the future, this will likely see residents traveling farther to access cash, Bullock added. Interestingly, the Australian state has for years forcefully limited the use of cash by way of its legal system.
What are your thoughts on this story? Let us know what you think in the comments section below.
JPMorgan CEO Warns of ‘Most Dangerous Time the World Has Seen in Decades’

JPMorgan Chase CEO Jamie Dimon has warned of “the most dangerous time the world has seen in decades.” The executive explained that “the war in Ukraine compounded by last week’s attacks on Israel may have far-reaching impacts on energy and food markets, global trade, and geopolitical relationships.”
Jamie Dimon’s Latest Warnings
The chairman and CEO of JPMorgan Chase, Jamie Dimon, issued a warning during the release of his company’s third-quarter 2023 earnings results that the world may be encountering the “most dangerous time” in decades.
“The war in Ukraine compounded by last week’s attacks on Israel may have far-reaching impacts on energy and food markets, global trade, and geopolitical relationships,” the JPMorgan boss detailed, emphasizing:
This may be the most dangerous time the world has seen in decades.
While insisting that “U.S. consumers and businesses generally remain healthy,” Dimon cautioned that “persistently tight labor markets as well as extremely high government debt levels with the largest peacetime fiscal deficits ever are increasing the risks that inflation remains elevated and that interest rates rise further from here.”
Moreover, the JPMorgan chief noted that “we still do not know the longer-term consequences of quantitative tightening, which reduces liquidity in the system at a time when market-making capabilities are increasingly limited by regulations.”
Last week, Dimon explained that there are two “extraordinary” storm clouds happening today that may have “bad outcomes” for the U.S. economy. He similarly said that the fiscal money being spent in the U.S. “is so big, the largest in peacetime ever … with very high deficits and QT we’ve never had.” The executive also recently warned of stagflation and that the Federal Reserve could raise interest rates to 7%. Emphasizing that stagflation is the worst outcome economically, he warned: “If that happens, you’re going to see a lot of people struggling.”
Do you agree with JPMorgan CEO Jamie Dimon? Let us know in the comments section below.
Shiba Inu Bulls On The Horizon? Substantial Selling Pressure Seen Dropping
The price action of Shiba Inu (SHIB) has encountered a significant compression, primarily attributed to substantial selling originating from a prominent institutional market participant.
Data obtained from Lookonchain, a renowned on-chain analytics resource, has shed light on the ongoing selling spree by Voyager, a troubled asset manager currently navigating bankruptcy proceedings.
This selling binge over the past four days has amounted to an astonishing 1.4 trillion SHIB tokens, equivalent to approximately .4 million. The cryptocurrency landscape has witnessed a noteworthy development as Voyager, amidst its financial restructuring, embarked on an extensive liquidation of SHIB tokens.
Voyager’s Unloading Spree And Potential Implications On Shiba Inu
Lookonchain’s data revealed the staggering magnitude of Voyager’s sell-off, raising questions about the motives behind this sizeable divestment. Amid speculation, it’s important to note that the asset manager has now depleted its SHIB holdings, as confirmed by Lookonchain’s report. This intriguing turn of events prompts speculation about the potential impact on SHIB’s trajectory.
Voyager has been selling assets on #Coinbase for the past 4 days and has sold 49 tokens for ~M.
Including:
781 $BTC (M);
9,570 $ETH (.6M);
1.4T $SHIB (.4M);
234,660 $LINK (.74M);
1.87M $MATIC (.27M);
3M $MANA (.1M);
… pic.twitter.com/SUGjjQQvja— Lookonchain (@lookonchain) August 15, 2023
As Voyager completes its selling spree, market watchers are keenly observing the ramifications on SHIB’s value. Notably, SHIB has demonstrated a commendable performance over the last seven days, exhibiting a robust 5.9% rally now trading at .00000998 via CoinGecko. While the cryptocurrency faced a 2.4% slump in the past 24 hours, this transient dip may be attributed to broader market sentiments influenced by seemingly unrelated news.
News circulating about potential downgrades within the banking sector might have inadvertently contributed to the 24-hour slump witnessed by SHIB. It’s worth acknowledging that seemingly unrelated developments can trigger ripples of uncertainty across financial markets, ultimately impacting various asset classes, including cryptocurrencies like SHIB. Such negative sentiments, although momentary, have the potential to trigger short-term pullbacks.
Anticipating Price Rally Amidst Voyager’s Exit
The revelation that Voyager has exhausted its SHIB holdings could potentially pave the way for renewed price momentum. With institutional selling pressure alleviated, the cryptocurrency could be poised to continue its impressive performance from the past week. As SHIB hovers around its current value of .00000998, investors and enthusiasts are cautiously optimistic about the prospects of a sustained price rally.
Despite the recent slump, SHIB’s overall trajectory remains promising, supported by both its recent rally and the depletion of Voyager’s SHIB holdings. While the impact of institutional selling cannot be ignored, SHIB’s future gains may be bolstered by a reduced supply overhang.
SHIB’s upcoming performance will undoubtedly be influenced by a complex interplay of factors, ranging from market sentiment to macroeconomic developments.
(This site’s content should not be construed as investment advice. Investing involves risk. When you invest, your capital is subject to risk).
Featured image from The Currency Analytics
IMF Has Not Seen Specific Proposal on BRICS Currency
The International Monetary Fund (IMF) has not seen any specific proposal on a common BRICS currency. However, the IMF acknowledges the presence of “slow-moving trends” indicating shifts in the currency composition of reserves and trade. The Fund’s statement followed reports that the BRICS economic bloc is planning to launch a gold-backed currency.
IMF on BRICS Currency
The International Monetary Fund (IMF) was asked during a press conference on Thursday about its position on the proposed BRICS currency following media reports that the BRICS nations are launching a gold-backed currency that will be formally announced at the economic bloc’s upcoming leaders’ summit in August. The BRICS nations comprise Brazil, Russia, India, China, and South Africa.
Julie Kozack, director of IMF’s Communications Department, replied: “With respect to the way countries, or the currencies in which countries conduct trade, we view that as a decision of the participants involved in the individual transactions. That is, generally, our view.” The IMF spokesperson added:
With respect to a particular BRICS currency, we do not have any specific comments on this. We have not seen any specific proposal.
However, she stated that more broadly: “Shifts in the currency composition of reserves and of trade tend to be relatively slow-moving if we look at history; and, so, we do see some slow-moving trends that are taking place.” She gave an example of the U.S. dollar, stating that the share of the USD in global foreign reserves has declined from around 70% at the end of 1999 to around 58% at the end of last year.
While Russian news outlet RT claimed that the BRICS nations are launching a gold-backed currency, Leslie Maasdorp, vice president and chief financial officer of the New Development Bank, also known as the BRICS Bank, insisted that the BRICS does not have an immediate plan to create a common currency to challenge the dominance of the USD. “The development of anything alternative is indeed a medium to long-term ambition,” he stressed.
The governor of Russia’s central bank said this week that a common BRICS currency requires the consent of many parties, noting that this project is challenging and “will be quite difficult to implement.”
Do you think the BRICS will launch a gold-backed currency that will compete with the U.S. dollar soon? Let us know in the comments section below.