 In the last week, the market for non-fungible tokens (NFTs) has seen a decline, with sales falling 12.67% compared to the previous week, totaling 5.22 million. Ethereum took the lead in NFT sales, raking in 3 million, while Solana followed with sales over million, relegating Bitcoin to third place with .9 million in sales. […]
Bitcoin News
Here Are The Most Bullish Predictions For ETH Price As Ethereum Dominance Rises Against Bitcoin
The sentiments around Ethereum look to be very bullish at the moment as the second-largest crypto token by market cap has seen its dominance surge against Bitcoin. Ethereum’s rise against the flagship crypto token is also significant, as crypto analyst Jaydee recently suggested that it could usher in the altcoin season.
Bullish Predictions For Ethereum’s Price
Crypto analyst Ali Martinez recently highlighted the fact that Ethereum broke out from an ascending triangle on the weekly chart. According to him, the crypto token has its eyes on the ,400 price level despite the short-term volatility. Backing Ali’s analysis, crypto analyst Mayne shared their belief that ,400 remains a viable target for ETH’s price.
Interestingly, Mayne hinted that “ETH betas” could run alongside ETH when this significant price surge begins to happen. These ETH betas include tokens like the native tokens of Ethereum’s layer-2 networks Optimism and Arbitrum.
Crypto analyst Ash Crypto also offered a bullish prediction for ETH’s price while commenting on the state of the market. He remarked that money was currently flowing from Bitcoin to Ethereum and that it shouldn’t be long before the latter trades above ,200.
ETH trading above the ,000 price level looks to be the consensus going by these predictions. The CEO and founder of MN Trading, Michaël van de Poppe, had before now suggested that ETH was also going to rise above ,000 on its way to ,500. Then, Poppe boldly claimed that this price prediction would materialize in the first quarter of 2024.
Meanwhile, crypto analyst ColdBloodedShill stated in a recent X post that ETH is likely planning for higher prices as long as it remains above ,400. The ,400 price range looks to be an important support level as ETH looks to break out. Crypto analyst Bluntz Capital also highlighted that price range (,495 specifically) as he noted that there will be an eventual breakout as long as ETH holds above that level.
Conviction On Ethereum Getting Stronger
Market intelligence platform Santiment recently revealed that the number of new ETH addresses is on the rise as Ethereum continues to outperform Bitcoin. 89.4 thousand addresses are said to have been created daily during this stretch. This represents a significant increase from late last year, when 70.4 addresses were created daily in early November.
Santiment also added that ETH’s supply on exchanges had reduced drastically to 8.10%, almost getting close to its all-time low (since the opening week of trading) of 8.05%. Such a development usually suggests that ETH holders are looking to hold for the long term as they move their holdings to self-custody.
Chainlink Rises 17% – Is LINK On Course To Hit $20 This Week?
Traders in the crypto realm are watching Chainlink (LINK) with bated breath as the price coils up near the mark, hinting at a possible break out towards , or even given the right conditions this week.
Since November, LINK has been consolidating between .00 and .00, exhibiting classic market cycle behavior that presents prime opportunities for savvy traders.
Technical analysts are buzzing with potential bullish scenarios, with many pointing to the current price action as the telltale sign of an “accumulation phase.” As per the renowned Wyckoff method, this phase sees sellers exiting, prices stabilizing, and indecision ruling the market.
Will Chainlink Hit The Vaunted Mark?
Following accumulation comes the much-anticipated “markup phase,” characterized by surging buying pressure, rapid price increases, and heightened activity.
And that’s precisely what the charts seem to be foreshadowing for LINK. Indicators like the Awesome Oscillator and MACD are flashing green and pushing towards bullish territory, suggesting growing confidence and impending upward momentum.
The Relative Strength Index (RSI) also leans north, potentially primed to cross its signal line and add fuel to the bullish fire.
Further bolstering the optimistic outlook are the Simple Moving Averages (SMAs). Both the 100- and 200-day SMAs are pointing north, with the latter currently nestled comfortably at .994. This upward trajectory indicates the path of least resistance lies in ascending territory for LINK.
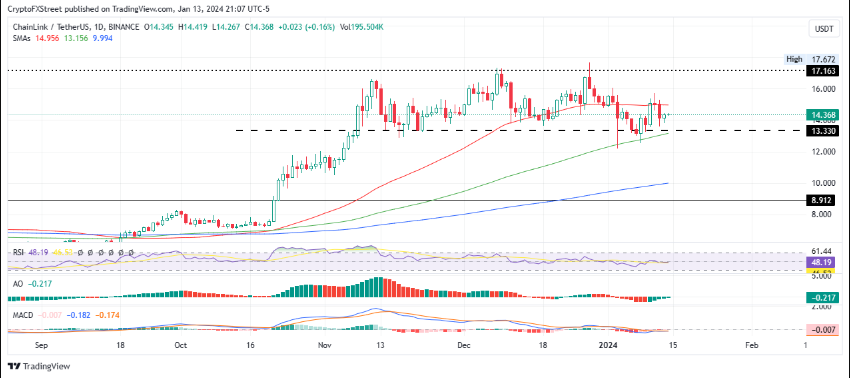
Should buying pressure build steam above current levels, analysts predict a potential leapfrog over the 50-day SMA at .95, paving the way for a psychological price point. In a highly bullish scenario, LINK could even tap into its full potential, marking a 20% surge from its current position.
17% Rally Ignites More Optimism For LINK
But a fresh spark ignites the conversation – Chainlink just surged 17% today, propelling it closer to the long-held barrier. Could this recent rally be the catalyst that sends LINK rocketing past its immediate target and into uncharted territory?
It’s still too early to definitively say. While the technical indicators remain encouraging, external factors and market sentiment can shift rapidly. However, one thing is certain: Chainlink’s latest surge adds another layer of intrigue to its already captivating price action.
Whether it coils upward for a glorious breakout or succumbs to profit-taking, the next few days promise to be a thrilling ride for LINK holders and a fascinating case study for technical analysis enthusiasts alike.
Featured image from iStock
New Year, New Record — Bitcoin’s Difficulty Rises 1.65% in First 2024 Retarget
Bitcoin’s network difficulty experienced its first increase of 2024 on Jan. 5, at block height 824,544, rising 1.65% to an unprecedented network peak of 73.2 trillion. This inaugural adjustment of the year succeeds the 27 dynamic shifts witnessed in 2023, including a total of 20 increases.
Bitcoin’s Difficulty Hits 73.2 Trillion
On Jan. 5, 2024, Bitcoin once again broke another record in terms of how difficult it is to discover a bitcoin (BTC) block reward. The network’s difficulty rose to 73.2 trillion after a 1.65% uptick on Friday evening Eastern Time (ET). The change occurred at precisely 7:41 p.m. (ET) at block height 824,544 and it follows the 6.98% increase that took place nearly two weeks ago at block height 822,528.
Fundamentally, Bitcoin’s difficulty represents a metric reflecting the challenge involved in identifying a block subsidy to append a fresh block to the blockchain. The difficulty level changes every two weeks, give or take, to maintain a consistent block time, which for Bitcoin is about 10 minutes per block. The latest figure, 73.2 trillion, is a reflection of the current difficulty target.

This number signifies the upper limit of what the hash of a block must be for it to be considered valid. When the difficulty is 73.2 trillion, it means the hash of a valid block must be less than or equal to a target number that is very low relative to the possible range of hash values. The lower this target is, the less likely a random guess of the hash will be below it, which effectively means it’s harder to find a valid block.
Over the past 12 months, the difficulty target has soared to new records, breaking previous heights consistently. This surge is attributed to the substantial increase in hashrate, now cruising at 545 exahash per second (EH/s) as per Luxor’s hashrateindex.com statistics. Despite the last 20 rises in 2023 and the initial hike in 2024, bitcoin miners and the escalating hashrate remain undeterred. Block times have quickened beyond the usual 10-minute average, leading to a hike after every 2,016 blocks are mined.
Throughout 2023, the network added more than 300 EH/s, maintaining a steadfast pace that significantly accelerated as the year concluded. Application-specific integrated circuit (ASIC) producers have launched next-generation devices boasting elevated terahash capacities and enhanced efficiency, measured in joules per terahash (J/T). Since the close of the previous year, mining enterprises have procured tens of thousands of these advanced units, with a majority slated for 2024 delivery.
Consequently, the hashrate is anticipated to climb in tandem with difficulty hikes, barring unforeseen developments. Nevertheless, Bitcoin’s hash price — the daily expected value per one petahash per second (PH/s) of hashing power — has declined from 2.88 per PH/s on Dec. 31, 2023, to a present rate of .60. Bitcoin’s next difficulty retarget is scheduled to take place on or around Jan. 19, 2024.
What do you think about Bitcoin’s mining difficulty rising by 1.65% on Friday? Share your thoughts and opinions about this subject in the comments section below.
Shiba Inu Bucks Bearish Trend: Large Holder Netflow Rises 1079% To 4.68 Trillion SHIB
Shiba Inu has been going against the bearish trend recently, especially with the increased adoption of the Shibarium Layer 2 network. This time around, it is large holders who are driving the bullish return. Specifically, these large holders have increased their positive net flows by more than 10x.
Shiba Inu Large Holder Netflow Jumps 1079%
According to the on-chain data tracker IntoTheBlock, the Shiba Inu large holder net flow has seen a significant rise. These large wallets saw their net flow ( the total difference between inflows and outflows) rise an outstanding 1079% starting from December 10.
In total, the net flow of these large wallets came out to a whopping 4.68 trillion SHIB. Now, this is important when placed in comparison to the numbers from the previous days which the tracker shows to be just under the 287 billion SHIB mark.
A logical explanation for this massive uptick in net flows is that these whales are looking to take advantage of the low SHIB prices. On December 10, the SHIB price was still trading above .00001, which is when the net flows were under 287 billion.
However, as the SHIB price began to drop, the net flows of these large accounts began to rise. The further the price dropped, the more the whales added to their wallets. This shows a clear intent to accumulate tokens with the belief that the price is poised to bounce back again.
SHIB Investor Sentiment Turning Bullish
The decline in price has understandably eroded investors’ bullishness to a certain degree. But this seems to be short-lived especially as metrics begin to turn toward the upside. The first of these is the SHIB burn rate seeing an uptick in the last day.
Data from Shibburn highlights a 49% increase in the burn rate of the meme coin over the last 24 hours. This comes as a total of 2.88 billion tokens were burned by the community at this time. Usually, this happens as investors expect a turning point in the price.
Additionally, the Shiba Inu Fear & Greed Index has also managed to maintain a neutral level. This suggests that there is still a good level of bullishness left after the price decline. As long as metrics continue to improve, there could be a turnback toward recovery soon.
Ethereum Rises: ETH Remains Steady At Over $2,300 Amid Bull Market Expectations
Recent patterns indicate that the impetus fueling Ethereum’s climb is far from diminishing, and the price trajectory of the cryptocurrency has shown resilience. Ethereum may not be as advanced as some of its L1 competitors, but it stands out from the crowd thanks to its large developer community, immense acceptance, and crucial role in DeFi and other blockchain-based applications.
Ethereum Remains Firm At ,347
At the time of writing, ETH was able to keep a strong footing at the ,300 level, trading at ,347, nearly unchanged in the last 24 hours, but tallied a 10% increase in the last seven days, data from Coingecko shows.
There is still a lot of room for profit in the current bull market, even though Ethereum’s price spike hasn’t been as dramatic as other altcoin’s. Size, liquidity, and being the leading platform for smart contracts all contribute to Ethereum’s continued appeal as an investment.
This means that ETH’s price performance could be greatly enhanced by any further market increases. Ethereum, according to technical research, is about to see growth, and it is now testing key resistance levels. Both retail and institutional investors would be interested if the price breaks out above these levels, as it could indicate that the positive trend would continue.
#Ethereum has scratched its way to ,349, its highest level since June, 2022. The long-term trend of top non-exchange whale wallets getting richer, and top exchange whale wallets having less sell-off power, is a promising combo for a continued climb. https://t.co/h7ogbqPLWf pic.twitter.com/82plXmVn02
— Santiment (@santimentfeed) December 7, 2023
For the first time in more than a year, Ethereum’s price has moved into a new range. The accumulation patterns seen in several top addresses indicate that this new range has created a chance for persistent price increases.
Ethereum’s Growing Holdings And 2024 Roadmap
The most popular Ethereum addresses on exchanges and those outside of them have shown clear patterns of accumulation in the last several months, according to new data from Santiment.
A large number of top non-exchange addresses have been buying Ethereum at different prices, which has caused their holding volume of ETH to rise steadily and now surpass 54 million.
At the same time, following their most recent execution layer meeting on December 8, Ethereum developers have laid out a detailed strategy for the network’s future in 2024, including new suggestions, major upgrades, and more.
Meanwhile, Ethereum is predicted to significantly outpace mega-cap tech stocks. After the Bitcoin miners’ payouts are halved, investment firm VanEck thinks Ethereum will soar. In the past, this has caused a fresh spike in the price of Bitcoin, with the proceeds going into altcoins.
Ethereum won’t surpass Bitcoin, despite surpassing large stocks, and what “flippening” rumors claim. It is still believed that Bitcoin will continue to lead in market capitalization even though there is a chance that ETH may gain value in daily transaction volume.
(This site’s content should not be construed as investment advice. Investing involves risk. When you invest, your capital is subject to risk).
Featured image from Shutterstock
Cardano Rises $56% To Dominate Weekend’s Top 10 Roster – Details
Altcoins such as Cardano (ADA) had a widespread increase in value, similar to the altcoin cycle observed in early November. This cycle occurred when the momentum of Bitcoin slowed down, prompting traders to secure profits and allocate their investments towards smaller cryptocurrencies.
Because of the consistent price of Bitcoin (BTC), which encouraged capital rotation to alternative coins, native tokens associated with layer 1 (L1) blockchains saw the greatest gains on Saturday. Cardano (ADA) was the top performer in the weekend’s top 10 rankings.
According to Coingecko data, ADA price increased by 27% to 64 cents in the last day, for a strong 56.3% growth over the previous seven days. It is the largest increase since August 2022.
With the removal of the three major obstacles—the .40, .45, and .50—investors may begin to experience FOMO, or “fear of missing out,” as they discover ADA to be a compelling investment.
Cardano Bullish Momentum Sparks Optimism
No doubt, Cardano has emerged as one of the most appealing assets available on the cryptocurrency scene, attracting interest as traders fervently hope that the current bullish trend holds or if they are in for a startling letdown.
The money flow index’s (MFI) steady rise indicates that Cardano is firmly in the hands of bulls. For traders, there are currently several prospects for scalping, but in order to maintain investor optimism for a recovery to .00, ADA price needs to confirm higher support above .64.
An indicator that keeps track of money coming into and going out of Cardano is the MFI. Prices usually increase when the inflow volume far exceeds the outflow volume. This could account for the breakout from .65, and ADA might try to close the difference to before the end of December if the trend holds steady.
The ADA price has been recognized for its gradual but consistent increase, which has kept the token from seeing a strong surge despite the favorable market sentiment.
Cardano Daily Active Addresses Climb
The forthcoming trade’s outline, however, seems to have altered as traders have been more engaged on the network, which might perhaps support a healthy upsurge. The on-chain statistics shows that the daily active address has increased significantly and reached quarterly highs.
Based on data from IntoTheBlock, around 80% of Cardano wallet addresses are sitting on unrealized profits at the current .56 price level.
If the wallet addresses stated above realize their gains, the asset’s price could correct since more people would be inclined to sell.
The notable #crypto market leaders over the past 24 hours are #Cardano (+19%), #Solana (+11%), and #Optimism (+11%). Each is seeing one of their highest social dominance days of 2023. With this implied #FOMO kicking in, proceeding with caution is wise. https://t.co/QvxDrofqJt pic.twitter.com/aUqIDoCLho
— Santiment (@santimentfeed) December 8, 2023
Meanwhile, ADA and a few other popular cryptocurrencies have exploded in social dominance, albeit Bitcoin’s influence is also growing.
According to the Santiment data above, market participants are now more positive about altcoins, particularly Cardano. In tandem with a sharp increase in their costs, social media conversations reached a two-month high, suggesting the onset of FOMO.
Therefore, the next few days might be seen as extremely important, since the fear of FOMO also carries a high risk of rejection once it reaches the critical points.
(This site’s content should not be construed as investment advice. Investing involves risk. When you invest, your capital is subject to risk).
Featured image from Shutterstock
Shiba Inu Burn Rate Rises Rapidly In One Week, What’s Been Driving It?
The rise in the Shiba Inu burn rate has no doubt been one of the most notable developments in the community. At the start of the week, the burn rate rose over 7,000,000% after more than 8 billion tokens were burned in a 24-hour period. This trend has not slowed down either given that the burn figures have continued to rise daily.
Shiba Inu Burn Surge Continues
Earlier in the week when the Shiba Inu burn saw one of its highest daily spikes, the total number of tokens burned had come out to just over 8 billion. At the time, this was a significant figure given that the burn rate had been slowing down over the last year. However, there has been a steady rise in the number of SHIB tokens that are being burned lately, which raises the question of what is driving the burn.
After a dip in the burn rate following the 8 billion daily burn, the community is back at it again and their zeal has been rewarded once more. On Thursday, the burn tracker Shibburn reported that the 24-hour figure had crossed 10 million once again. This shows a steady recovery from Wednesday’s figures which had tanked significantly.
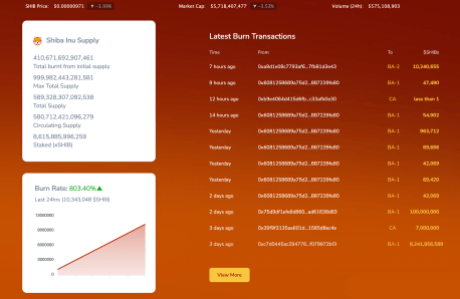
As Shibburn data shows, the 10.34 million SHIB that were burned in the last 24 hours amounts to an 803.4% increase in the burn rate compared to the previous day. The majority of the burns have, however, come from a single wallet address. The address sent a little over 10.2 million SHIB to the burn address.
This recent spike in the BURN rate has also added to the total amount burned on a weekly basis. The figure comes out to 8.497 billion, which is a 1,969.72% increase from the previous week’s figures.
What Is Driving The SHIB Burn?
The most significant burn for the week was the 8.2 billion burn, most of which came from a single address. This address was the ShibaSwap deployer wallet, which meant that the SHIB team was the one burning the tokens.
The spike in the burn rate coincides with the increased usage of the Shiba Inu layer 2 blockchain Shibarium, which marked multiple milestones this week. As the usage has risen and more fees were collected on the network, the amount of SHIB to be burned rose drastically.
Daily transactions on Shibarium have consistently come out above 7 million this week, bringing the total transactions on the network above 51 million. If this continues, then the burn rate could continue to rise as more usage of the L2 means more fees being burned.
Bitcoin Rises To $41,000: How Much Profit Has Microstrategy Made On Its BTC Bet?
MicroStrategy has become one of the top gainers of the recent Bitcoin bullish trend, and the analytics provider has secured billions in gains after disregarding naysayers to make a long-running bet on Bitcoin.
MicroStrategy Massive Bitcoin Bet Hits Gold
Leading provider of enterprise analytics and mobility software, MicroStrategy is riding the early wave of the anticipated Bitcoin bull run. The analytics provider has seen the profit on its billion-dollar BTC bet rise to billion following Bitcoin’s rise from below ,000 during the weekend to over ,000 this week.
According to Simply Bitcoin, an X (formerly Twitter) handle, Michael Saylor, the former CEO and Executive Chairman of MicroStrategy has revealed approximately 174,530 BTC in the company’s BTC portfolio. This makes the business intelligence company presently the largest corporate Bitcoin holder globally.
Around late November, Saylor announced that the company had purchased another 3.3 million worth of Bitcoin at an average price of ,785 per BTC. Due to Bitcoin skyrocketing to ,000 highs this week, the company has made profits of ,460 per Bitcoin with an average price of ,252 on its massive Bitcoin stash.
Not only has the company gained massively from its large-scale Bitcoin investment, but MicroStrategy’s stocks (MSTR) went up by 8.2% following its purchase in November. MSTR shares were trading over 4% higher on Monday and its present market cap has hit .18 billion. The shares are up by 6.74% at the time of writing and with Bitcoin still maintaining its positive sentiment, there may be additional gains in the future.
Bitcoin Claims 10th Spot In Global Asset Market Cap
Following its spike to ,000, Bitcoin’s rank in the top global assets market capitalization went up significantly, surpassing the formidable Berkshire Hathaway, an American multinational conglomerate, led by billionaire investor Warren Buffet.
According to Companies Market Cap data, Berkshire Hathaway’s market cap at the time of writing is approximately 6.75 billion and down by 0.11%. In contrast, Bitcoin’s market cap is up by 0.43% and has surged to 6.30 billion.
The cryptocurrency is a few billion away from surpassing Meta Platforms (Facebook), which has a market cap of 2.40 billion and is ranked at the 9th position on the top asset market cap list.
Bitcoin presently ranks as the 10th top asset by market cap in the world. The cryptocurrency has seen its price spike triggered by a myriad of factors including the potential approval of Spot Bitcoin ETFs, the hopeful sentiment surrounding US rate hikes by the Federal Reserve, and the upcoming Bitcoin halving in 2024.
Thorchain Rises to Third in Decentralized Exchange Rankings, Hits $1.8B Weekly Trade Volume
In the past week, trading activity on the decentralized exchange (dex) Thorchain has experienced a significant surge, reaching .854 billion in trade volume. Data shows that Thorchain is currently the third-largest dex in terms of volume, following the popular dex protocols Uniswap and Pancakeswap.
2% of Global Bitcoin Spot Trading Channeled Through Thorchain
In the world of decentralized finance (defi), Thorchain has been recording notable volumes. At its core, Thorchain is a decentralized cross-chain infrastructure that facilitates the settlement of native assets across various blockchain networks.
Thorchain allows users to swap native assets between supported chains or deposit assets to earn yields from swaps. Thorchain was developed using the Cosmos SDK — a framework for building blockchain applications in Golang.
Archived statistics from defillama.com reveal Thorchain as the third-largest dex this week, with a total volume of .854 billion. Uniswap reported .021 billion, while Pancakeswap had around .974 billion.
In terms of overall volume, Uniswap has reached .767 trillion, and Pancakeswap has accrued 6.52 billion. Thorchain’s total volume stands at .426 billion, less than Trader Joe’s .278 billion and Raydium’s .697 billion.
Among the top ten dexes, Thorchain saw the largest week-over-week percentage increase, climbing 144% higher. In the last 24 hours, Uniswap recorded .619 billion in volume, Pancakeswap had 4.9 million, and Thorchain achieved approximately 3.97 million.
Thorchain currently supports 17 trading pairs, with BTC/RUNE as the top pair this weekend. RUNE, Thorchain’s native token, is utilized in settlement, governance, and node bonding. On November 16, Shapeshift founder Erik Voorhees posted about Thorchain’s rising bitcoin trade volumes.
Voorhees, a supporter of Thorchain, has repeatedly discussed the subject on the social media platform X (formerly Twitter). “2% of global BTC spot trading is no longer going through centralized intermediaries,” Voorhees stated. “Satoshi would be proud.”
Despite its achievements, Thorchain has faced controversy, notably making headlines when the FTX hacker moved millions of dollars through Thorswap. Thorswap halted operations the following week and introduced modifications to curb illicit trades.
What do you think about Thorchain’s volumes this week? Share your thoughts and opinions about this subject in the comments section below.