 Over the past decade, the U.S. Securities and Exchange Commission (SEC) has contended with “significant non-compliance” and “creative attempts” by cryptocurrency market participants to avoid its jurisdiction. According to the SEC’s enforcement director, the commission has regularly prevailed in its numerous court cases against these participants. A ‘Decade’s Worth of Arguments’ In the past decade, […]
Bitcoin News
XRP Gets Rejected Down: Analyst Predicts Bottom Target
An analyst has revealed the level of XRP might observe a pullback following the latest rejection in the cryptocurrency’s price.
XRP Has Seen Rejection At Mid-line Of An Ascending Parallel Channel
As explained by analyst Ali in a new post on X, XRP has appeared to have been moving inside an Ascending Parallel Channel recently. An “Ascending Parallel Channel” refers to a pattern in technical analysis that’s used for identifying uptrends and potential reversal points for any asset’s price.
As the name already suggests, the pattern involves two parallel lines that make up the “channel” within which the price action is mostly contained. The upper line is made by connecting higher highs, while the lower one strings together higher lows.
At the upper line, the asset might be more likely to feel some resistance and get rejected back inside the channel, while the lower line could provide support to it.
In the scenario that the price makes a breach of these channel lines, a sustained break might take place. Naturally, a breakout above the upper line would be a bullish one, while that below the lower one could signal the continuation of the bearish trend.
Like the Ascending Parallel Channel, there is also the “Descending Parallel Channel,” which is obviously a pattern used whenever the market is showing a clear trend towards the downside.
Now, here is the chart shared by Ali that shows an Ascending Parallel Channel that XRP has been stuck inside for quite some time now:
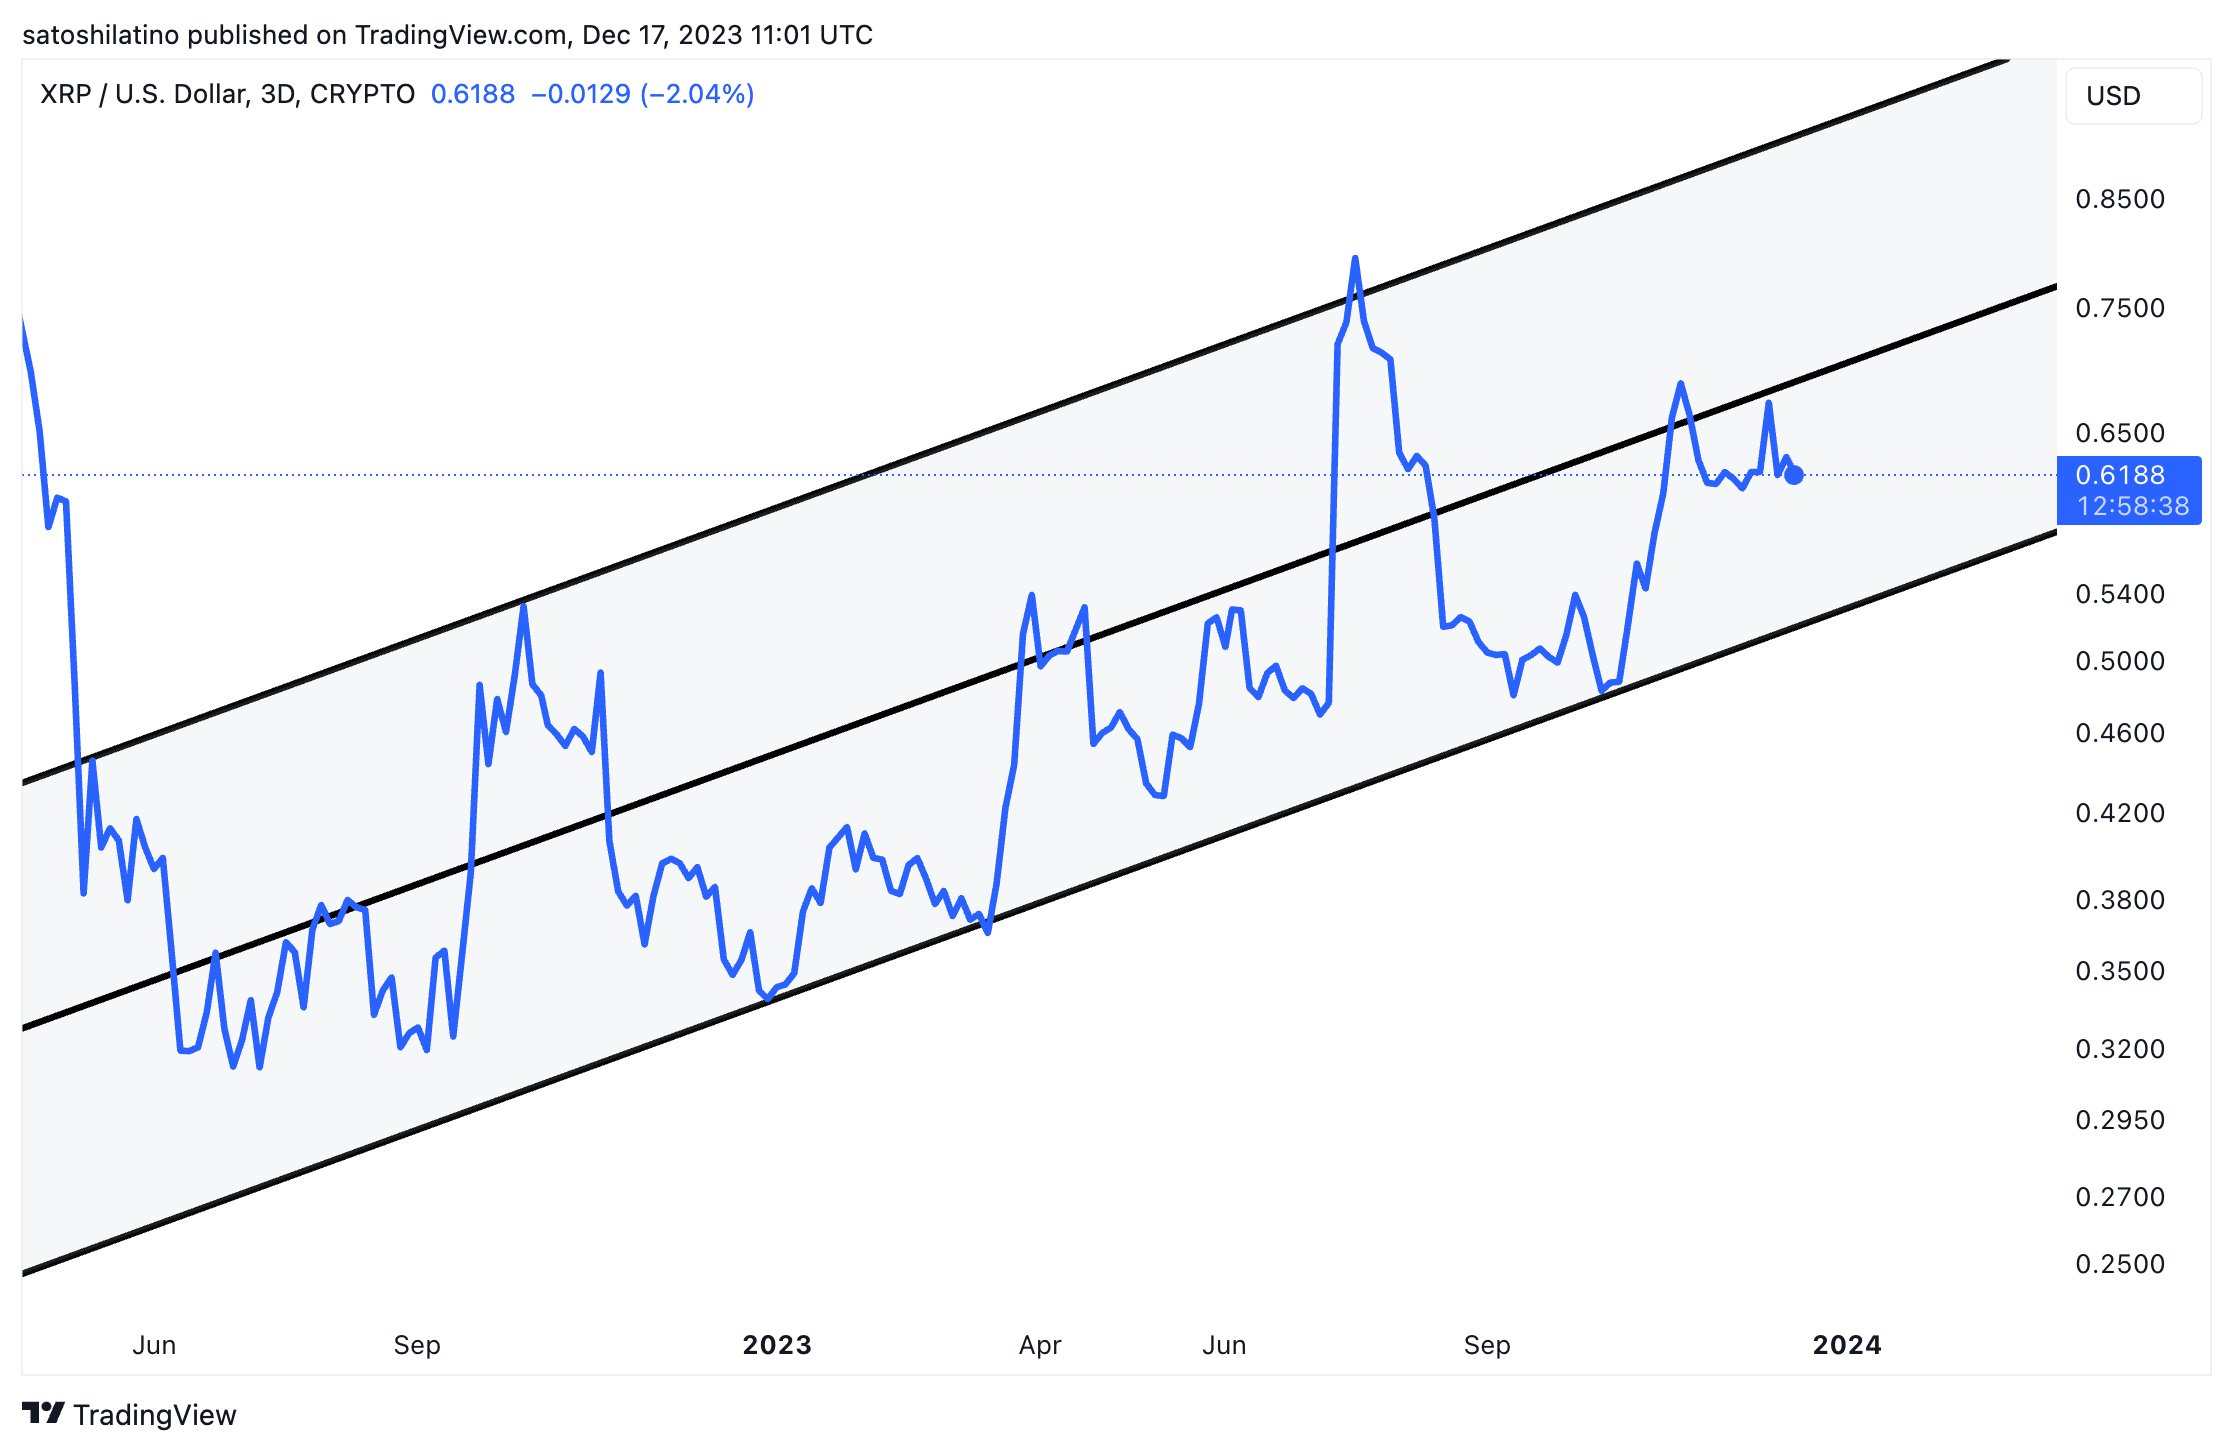
As is visible in the graph, XRP’s price top back in July of this year coincided with a temporary break above the upper line of this Ascending Parallel Channel pattern. Since this rejection, the asset hasn’t yet been able to revisit the level.
In the chart, the analyst has also drawn a third line: the mid-point between the two parallel trend lines of the pattern. This line has also appeared to have acted as resistance for XRP during the duration it has traveled inside the channel, as it has often hit local tops on interactions with it.
Recently, after bottoming out at the lower level following the earlier rejection, the asset climbed towards this middle line and made a retest of it. The coin appears to have been rejected from it, however, as it has been sliding down since then.
“After facing rejection at the channel’s mid-line, XRP might see a pullback toward the lower boundary, around .55,” explains Ali. At the time the analyst had posted the chart, the asset had been trading around .618, but since then, it has observed a further 5% drawdown.
With the coin continuing to show decline, it would appear possible that it might go all the way to the .55 level Ali has pointed out, before finding a potential reversal. From the current price, such a drop would suggest a decrease of over 6%.
XRP Price
XRP has plunged towards .585 today as the cryptocurrency market as a whole has seen red returns.
Taylor Swift Rejected Crypto Exchange FTX’s Sponsorship Offer Over Unregistered Securities Concerns

Taylor Swift, a pop icon and 12-time Grammy Award winner, reportedly turned down a 0 million sponsorship offer from the now-bankrupt cryptocurrency exchange FTX due to concerns about unregistered securities. A number of FTX celebrity endorsers are currently facing a class action lawsuit, including Shaquille O’Neal (Shaq), Tom Brady, and Larry David.
How Taylor Swift Avoided Partnering With FTX
Taylor Swift, a famous singer-songwriter who has won 12 Grammy Awards from 46 nominations, reportedly did due diligence on now-bankrupt cryptocurrency exchange FTX and turned down a sponsorship proposal from former FTX CEO Sam Bankman-Fried. FTX filed for Chapter 11 bankruptcy in November of last year.
Adam Moskowitz, one of the attorneys leading a million class-action lawsuit against 16 celebrity endorsers of FTX revealed during an episode of the Block’s Scoop podcast that Swift took the step of consulting with her lawyer when approached by SBF, in contrast to other celebrities who invested in FTX.
“The one person I found that [talked to their lawyers] was Taylor Swift,” Moskowitz shared, adding:
In our discovery, Taylor Swift actually asked them: ‘Can you tell me that these are not unregistered securities?’
Bankman-Fried, who is facing multiple fraud charges in the U.S., reportedly lobbied aggressively for a partnership with Swift. The partnership would have cost the bankrupt crypto company more than 0 million over three years.
Describing FTX as a “pyramid scheme,” Moskowitz, along with former Weinstein lawyer David Boies, filed a class-action lawsuit in Florida alleging that the crypto exchange’s celebrity endorsers promoted a “Ponzi scheme,” which impacted “thousands, if not millions, of consumers nationwide.” Shaquille O’Neal (also known as Shaq), Tom Brady, and Larry David are among the FTX celebrity promoters who are facing a class-action lawsuit filed by Moskowitz for endorsing sales of unregistered securities.
Commenting on how Swift avoided involvement with FTX, Tesla and Twitter CEO Elon Musk, who also turned down an offer from Bankman-Fried when the former FTX executive wanted to invest in Twitter, tweeted Wednesday:
I’m not surprised. Taylor is smart and her father is a well-regarded investment banker.
Scott Kingsley Swift, Taylor’s father, founded the Swift Group, a wealth management and financial advisory group that is part of Merrill Lynch, a Bank of America company. Taylor has expressed her admiration for her father’s passion for his work on several occasions. Even at the young age of eight, when her peers aspired to become astronauts or ballerinas, Taylor wanted to follow in her father’s footsteps and become a financial adviser.
What do you think about pop icon Taylor Swift being concerned about unregistered securities when approached by the disgraced FTX co-founder Sam Bankman-Fried? Let us know in the comments section below.
Bitcoin Price Gets Rejected At $25,000, But Is This The End?
Bitcoin price already cleared one of the most-anticipated levels which was ,000. The cryptocurrency was eventually beaten back down from this level but it has set a precedent for the whole of the crypto market. But more importantly, it seems that the bull market may finally be returning.
Bitcoin Fails To Hold ,000
On Thursday, following a positive CPI data release, the price of bitcoin rallied from the ,800 level it was trending at to reaching over ,000, all in the course of 24 hours. Santiment outlines the events that led to this level as the crypto market finally plunged back into positive sentiment.
A wild first half of February included a #Bitcoin 8-month high, an #SEC lawsuit pertaining to #BUSD, and a massive crowd sentiment shift. Our mid-month February market report covers where we stand, and how to allocate your portfolio optimally.
https://t.co/qzi9MF50ny pic.twitter.com/1RyGWJjzg3
— Santiment (@santimentfeed) February 17, 2023
The retracement in the bitcoin price has now seen the digital asset lose over 3.5% of its value over the last day period. It is currently trending in the high ,700s which points to strong momentum for the digital asset despite the fall in value.
Likewise, there is also a lot of demand at this level that gives credence to its bullish momentum. The only problem remains how the Fed will continue to tackle the high inflation. If the predicted dovish stance this year were to come to pass, then risk assets such as BTC will no doubt be in luck as demand is expected to explode.
Will BTC Make It Back Above ,000?
At this time, it is not a matter of if but when the price of bitcoin will actually make it back above ,000. Indicators are still pointing bullish which means there is still some runaway for the cryptocurrency. At current prices, BTC is still well above its 100-day and 200-day moving averages, putting it in a mid-term bullish position. Moving forward, the cryptocurrency is also trading well above its year-to-date average.
Another factor is the fact that the vast majority of bitcoin holders (71%) are currently seeing gains. Now, this can sometimes be bearish since investors would sometimes take out gains during times like this. However, BTC is still holding well above ,000, meaning only a small percentage are selling.
Lastly, bitcoin boasts one of the highest concentrations (69%) of long-term holders. This willingness to wait for longer periods of time before selling always translates to less supply in the market. And when demand rises, it inevitably triggers a swift upward rally.
At the time of writing, BTC is trending at ,750, according to data from Coinmarketcap. It is down 3.54% in the last 24 hours and up 8.71% on the seven-day chart.
Bitcoin Bulls Get Rejected As $16,700 Proves Too Strong; Here Is What To Expect
- BTC’s price is rejected from breaking above ,700 as this region is too strong for bulls.
- BTC’s price remains bearish in the high timeframe as most traders and investors remain cautious.
- BTC’s price bounces from a low of ,500 on the daily timeframe as the price reclaims ,500 as price struggles to break higher above the 50 Exponential Moving Average (EMA)
The price action demonstrated by Bitcoin (BTC) in recent times has been better than the previous week as the market suffered from some price decline affecting most crypto assets. Despite the relief bounce from Bitcoin (BTC), the price still trades below the key region of interest that would attract the attention of many buyers. The Domino effect of the FTX saga and other huge investors has left the market at a standstill as the market is yet to make a major move leading to much fear about where the market could be headed. (Data from Binance)
Bitcoin (BTC) Price Analysis On The Weekly Chart
Despite the uncertainty and turbulence that has affected the price of Bitcoin (BTC) and the crypto market at large, many altcoins are struggling for survival, trying to stay afloat as the prices of altcoins continue a downward price movement.
Bitcoin (BTC) has suffered more price loss, as the price dropped from a high of ,500 to a weekly low of ,500, leading to speculation of a further drop to ,000.
BTC’s price declined from a weekly region of ,500 to a region of ,500 due to the FTX fiasco, as the price found minor support to hold the sell-off in price to a further weekly low.
The price of BTC bounced off from ,500, rallying to a high of ,700, where the price faced rejection breaking higher. The price of BTC needs to hold above ,000 to keep alive the hope of a relief bounce.
Weekly resistance for the price of BTC – ,500.
Weekly support for the price of BTC – ,500.
Price Analysis Of BTC On The Daily (1D) Chart

The price of BTC remains considerably strong in the daily timeframe as the price trades above ,000 after BTC saw its price decline from ,500 to ,500 as the market continues in its state of uncertainty.
BTC’s price continues to struggle as price aims for more relief bounce from this region. The price of BTC needs to reclaim and trade above ,500 for a short-term relief bounce. If the price of BTC fails to flip the region of ,500, we could see more rejection in BTC price to a region of ,500 and even lower.
Daily resistance for the BTC price – ,500.
Daily support for the BTC price – ,500.
Featured Image From zipmex, Charts From Tradingview
NewsBTC
Chainlink (LINK) Rejected At $9.20 But Picks Up Steam – Levels To Watch
While the broader crypto market is currently trying to recover from the shock surrounding FTX and the accompanying fears of a contagion effect, Chainlink has recorded the highest price increase within the top-100 by market cap within the last 24 hours.
At press time, the LINK price was up 6.2% from the previous day, trading at .71. Over the past seven days, Chainlink has even posting a whopping plus of around 13%. Trading volume has grown to .435 billion in the last 24 hours, up 161% from the previous day.
According to on-chain analysis service Santiment, the LINK price has risen to just above .20 for the first time since August 13, a 3-month high despite very volatile markets. The data aggregator believes the reason for the surge is the large volume of active LINK addresses for the past 5 weeks.

Chainlink (LINK) Showing Strength
Back on October 30, Santiment wrote that whales “got pretty active this weekend” after the LINK price cracked the mark a couple of times. Santiment wrote:
Saturday saw 33 different $LINK transactions exceeding a value of million. This was the highest whale activity day since June 27th.
By the end of October, the number of wallets with more than 100,000 LINK aka whales has increased to 459. This is the highest level since 2017.
A look at the 1-day chart reveals that Chainlink (LINK) stopped just shy of the important .53 level today. LINK broke through this level to the downside on May 09. In the 1-day chart, the price bounced off this mark for the third time over the last six months.
At the current level, LINK is trading well above the 100- and 200-day simple moving average (SMA). In addition, the LINK/USD pair is about to form a golden cross, which is often a bullish technical sign. It is formed whenever the chart’s 50-day moving average line crosses the 200-day moving average line from the bottom to the top.
The RSI is neutral at 63. If LINK manages to punch through the key .53 level in the next few days, the next major resistance could be in the .30 region.

Anonymous trader Kaleo with 500,000 followers noted, “The accumulation base for the $LINK USD chart is so clean – though I attribute the HTF resistance breakout to BTC moving more than anything else, I still wouldn’t fade it. Those type of moves are typically the precursors to the BTC pair outpacing.”
The popular analyst also says that LINK/BTC has bounced back off higher time frame support, suggesting that LINK will outperform Bitcoin over the upcoming weeks.
$LINK / $BTC pair continuing to pick up steam pic.twitter.com/q4mw8YXqjo
— K A L E O (@CryptoKaleo) November 7, 2022
XRP Price Rejected At $0.48, What’s Next For XRP?
XRP price has met with selling pressure each time the bulls tried to move past the .48 price level. XRP declined by almost 1% over the last 24 hours. Over the past week, the altcoin depreciated more than 6%. The bulls could be back on the chart if the coin breaks past its immediate resistance level.
The technical outlook for XRP signalled that the bears are in control as demand for XRP had fallen. For the bulls to power through, it is important that demand for the altcoin returns to the market. At the moment, all technical indicators have painted a bearish image for the altcoin.
If buyers continue to remain low, a fall to .40 is just a matter of the next trading sessions. Once the coin pierces below the .40 mark, it could also trade at .38. XRP has made a significant recovery since last month, but buying strength has remained inconsistent, causing the coin to falter. XRP price is trading almost 87% lower than its all-time high of 2018.
XRP Price Analysis: One-Day Chart
XRP was priced at .46 on the one-day chart | Source: XRPUSD on TradingView
The altcoin was trading at .46 at the time of writing. It tried to topple over the .48 price mark, but the bears took over.
The coin has not been able to hold its recovery as demand for XRP continued to decline this month. Overhead resistance was at .48.
However, the bulls would only take charge if XRP traded above the .48 price mark.
Once the altcoin breaks above the .51 level, the bearish pressure will fade out.
On the other hand, less demand will let the XRP price slip further to its closest support line of .44.
Falling from the .44 mark will bring XRP down to .40 and then to .38. The amount of XRP that was traded in the last session experienced a fall, indicating low buying strength.
Technical Analysis
XRP noted fall in buying strength on the one-day chart | Source: XRPUSD on TradingView
The recent rejection from the .48 level has caused the altcoin to witness low buying strength. The technical indicators point towards the same.
The altcoin even formed a death cross where the 200-SMA (green) line is above the 20-SMA (red) line.
This is considered quite bearish for the coin, and it means XRP might experience a further fall in price. The Relative Strength Index was below the half-line as sellers took over buyers.
XRP price was below the 20-SMA line, which corresponded to fading demand and sellers driving the price momentum in the market.
XRP depicted sell signal on the one-day chart | Source: XRPUSD on TradingView
The altcoin registered sell signal in accordance with the other indicators on its chart.
The Awesome Oscillator reads the price direction and momentum. AO still displayed red histograms above the half-line, which was sell signal for XRP price.
Bollinger Bands measure the price volatility and chances of fluctuation. The bands were parallel and that meant less chance of upcoming volatility.
However, it also meant that XRP could move sideways in the next couple of sessions before it finally goes north or south.
Featured image from UnSplash, Chart: TradingView.com
NewsBTC
Bitcoin Price Rejected $20,000, Have The Bulls Lost Steam Again?
The Bitcoin price surged over the last 24 hours. However, the bulls have lost steam on the chart. The coin gained nearly 4% in the last 24 hours, but most gains were reversed at press time.
In the last week, BTC made no progress in terms of price movement.
Technical indicators were yet to reflect the minor bullish spell as the indicators remained bearish at the time of writing.
On one hand, sellers continue to dominate the market and, on the other hand, the bulls continue to defend the two crucial support levels of the coin.
The current support zone lies between ,000 and ,600. If the bulls make a comeback, then the coin can again touch the ,000 mark.
A move above the ,000 mark will help Bitcoin price propel above the ,000 mark. The global cryptocurrency market cap today is 0 billion, with a 1.0% positive change in the last 24 hours.
Bitcoin Price Analysis: One Day Chart
Bitcoin was priced at ,044 on the one-day chart | Source: BTCUSD on TradingView
BTC was trading at ,044 at the time of writing. The bulls tried hard to take the Bitcoin price above the ,000 mark, but they failed to. This also signified increased demand at the lower level for the coin.
The overhead resistance for the coin stood at ,600. If the coin manages to move above the ,600 mark, it could move to trade at ,000 again.
For that to happen, the buyers need to assert dominance on the chart. The support level for the coin rested at ,000. Falling through would bring BTC to ,600.
The bulls will then have to defend the coin at ,600 in order for the coin to keep recovering. The amount of Bitcoin traded in the last session decreased, pointing toward a fall in buying strength.
Technical Analysis
Bitcoin displayed low buying strength on the one-day chart | Source: BTCUSD on TradingView
BTC’s movement showed that the coin was being dominated by the sellers at press time. The ,000 price zone remains a high-demand zone.
This could make it harder for the bulls to climb back to the ,000 price mark. The Relative Strength Index was below the half-line and that points towards a fall in buying strength and increased bearishness.
The Bitcoin price was below the 20-SMA line, and that meant sellers were driving the price momentum in the market. Increased buying strength could help Bitcoin rise above the 20-SMA line, helping the bulls to take over.
Bitcoin depicted sell signal on the one-day chart | Source: BTCUSD on TradingView
BTC’s technical indicators depicted mixed signals on the one-day chart. The Moving Average Convergence Divergence indicated the price momentum and overall price action of the coin.
MACD continued to flash bearish signals with red signal bars, which were sell signal for the coin. On the contrary, the Chaikin Money Flow measures capital inflows and outflows were positive.
CMF continued to remain positive as capital inflows were higher as seen on the indicator. There was a drop in the CMF indicator, which indicates that bears are closing in on Bitcoin.
Featured image from Pexels , Chart: TradingView.com
NewsBTC
Bitcoin Whales Increase Selling, BTC Rejected From $20,000
Bitcoin has been experiencing some volatility over today’s trading session as the price of BTC touches critical resistance levels. The number one crypto by market cap positively reacted to macroeconomic factors, but as the weekend approaches, low levels might lead to sudden price movement.
At the time of writing, Bitcoin (BTC) trades at ,800 with a 1% profit in the last 24 hours and an 8% loss over the past week. The cryptocurrency saw bullish price action after the U.S. posted important metrics about their economy, but the rally was short lived as BTC stumble below a cluster of selling orders at around ,400.
BTC’s price moving sideways on the 4-hour chart. Source: BTCUSDT Tradingview
Data from Material Indicators shows how the liquidity in the Binance order books has been following the price of Bitcoin. Large players have been setting buy and sell orders as BTC approaches critical levels.
As seen in the chart below, today’s rejection was triggered by a stack of around million in asks orders as Bitcoin trended to the upside. The price has seen a similar pattern during this week with BTC’s price trending upwards only to experience overhead resistance triggered by a spike in ask liquidity.
BTC’s price sees spikes in sell orders when it approaches ,500 on lower timeframes. Source: Material Indicators
On the opposite direction, buy (bid) orders have remained relatively more stable with ,500, ,000, and ,000 displaying the most liquidity. These levels will be critical as they will operate as support and prevent BTC’s price from reaching a new yearly low if the market attempts to trend lower.
In that sense, Material Indicators also show an increase in selling pressure from large players. Asks orders of over 0,000 and million have been increasing on lower timeframes and could operate as a short-term hurdle for any potential upside.
In the U.S., the weekend will be extended until Tuesday due to a holiday. This often leads to spikes in volatility as low volume influence the price action.
What Could Play In Favor Of Bitcoin?
Additional data provided by analyst Justin Bennett indicates a potential rejection of the U.S. dollar as the currency attempts to break above an important flat base. This could lead to reclaim of levels last seen in 2003.
However, the currency has been unable to clear the area above 109, as measured by the DXY Index, and a “fakeout” might be in play. Bitcoin and the crypto market have been negatively correlated with the U.S. dollar. Therefore, a rejection might play in favor of the nascent asset class. Bennett said:
So far, it looks like the $DXY was “wrong”. Maybe a pullback to 107 next week if this trend line breaks. That would be bullish for crypto in the short term. But ultimately, I think the USD index heads to 112-113 and probably even higher.
U.S. Dollar facing potential fakeout on the 4-hour chart. Source: DXY Index on Tradingview via Justin Bennett
NewsBTC
Ethereum Price Rejected At The $2,000 Level, Will It Retrace To $1,700 Soon?
Ethereum price has retraced over the past few days, in the last 24 hours the coin depreciated 2%. The current price action pointed towards consolidation. In the past trading sessions, ETH has retraced beneath the ,900 price mark.
Continued consolidation for Ethereum has now pushed Ethereum price close to ,800. In case the king altcoin is unable to break past the ,800 level, it would be targeting the next support level for the coin.
Technical outlook had turned bearish as the coin was mainly consolidating causing a loss of value. Buying strength witnessed a fall on its chart which made ETH turn bearish at press time. If Ethereum needs to cross above the ,900 price level, the buying strength needs to recover considerably on its chart.
The global cryptocurrency market cap today is .18 Trillion, with a 1.6% negative change in the last 24 hours. Market movers were also dipping on their respective charts, this had an effect on the coin’s overall price movement.
Ethereum Price Analysis: Four Hour Chart
Ethereum was priced at ,880 on the four hour chart | Source: ETHUSD on TradingView
ETH was trading at ,880 at the time of writing. The coin had witnessed rejection at the ,000 price mark multiple times. At the moment Ethereum price witnessed a correction after it attempted to trade near the ,000 price level.
Overhead resistance for the coin was at ,900 and a jump beyond the mentioned price level will push ETH to touch the ,000 mark.
Local support for the coin was at ,700 but consistent lateral movement might end up pushing Ethereum price to ,500.
Amount of Ethereum traded depicted an increase in selling pressure indicating that sellers were starting to drive control in the market.
Technical Analysis
Ethereum depicted low buying strength on the four hour chart | Source: ETHUSD on TradingView
The altcoin’s lateral trading had taken a toll on its buying strength. The indicator on the four hour chart reflected the same. The Relative Strength Index was under the half-line which indicated that buyers are lesser than sellers in the market.
This fall in buying strength could cause Ethereum price to revisit ,745 where the altcoin might again witness demand. Ethereum price was above 20-SMA line and pointed towards buyers driving the price momentum in the market.
Ethereum pictured sell signal on the four hour chart | Source: ETHUSD on TradingView
ETH’s price movement has also indicated that the coin registered sell signal on its chart pointing towards bearishness.
The Moving Average Convergence Divergence underwent a bearish crossover and formed red histograms under the zero-line.
These formations are related to sell signal for Ethereum. Parabolic SAR which depicts the price direction of the coin was also negative.
The dotted lines of the indicator above the candlesticks indicated that the price direction of Ethereum was heading south proving that the bears were stronger than the bulls on the four hour chart.
Featured image from UnSplash, Chart from TradingView.com
NewsBTC