 Curve DAO’s (CRV) price increased over 10% early Wednesday, hitting .35 and marking a 41% increase from its low since a recent liquidation crisis involving its founder. On-chain data revealed significant accumulation of CRV by whales this week, with reports indicating a particular increase in purchasing during the post-liquidation price dip. This resurgence in CRV’s […]
Bitcoin News
Are Small Cap Crypto Assets Rebounding A Sign Risk Appetite Returning?
The crypto market just saw some slight recovery, but the performances are upside down. Opposite to the way sellouts usually play out, the Bitcoin dominance dropped dramatically as the asset is underperforming the Small Cap index.
From last November’s trillion market cap, the crypto market is now down to around 0 billion:
Crypto total market cap down to 9.871 billion in the daily chart | Source: TradingView.com
Smaller Altcoins Make A Strong Comeback
Last week the crypto market saw its bottom, followed now by some slight recovery. As per Arcane Research’s latest weekly report, the smaller altcoins have also been seeing red numbers with the Small Cap index shedding 27%, but it has been the best performer overall.
In contrast, Bitcoin had dropped 35%. Through this small window of relief during June, we have seen the blue-chip coin underperform all other indexes.
Bitcoin underperforms all crypto indexes in June | Source: Arcane Research
As a result, BTC’s dominance in the market fell -1,51% this week to 43,5% while Ether fell -0,31. The latter has been declining since May from 19.5% to 15%.
Bitcoin dominance sees a big decline while altcoins take the lead | Source: Arcane Research
What’s Making This Crypto Winter Colder
The report notes that the primary driver of this crypto crash has been the hedge fund Three Arrow Capital (3AC) collapse. Having invested over 0 million in Luna Foundation Guard’s token sale, 3AC’s liquidity ended up being wiped out and its margin call was the last straw for the already pressured market.
Related Reading | How Long Will The CryptoWinter Last? Cardano Founder Provides Answers
As per the Wall Street Journal, the crypto hedge fund hired legal and financial advisers to help work out a solution for its investors and lenders. The firm is looking for a way out, “including asset sales and a rescue by another firm”. The prognostic is not very positive at the moment, seeing the wave of liquidations and mitigations of losses by crypto exchanges that have followed the collapse.
“We were not the first to get hit…This has been all part of the same contagion that has affected many other firms,” Kyle Davies, 3AC’s co-founder, said in an interview.
Arcane Research explained that “In periods of insolvency, creditors unwind the most liquid assets first, which is likely the root cause of BTC and ETH’s relative underperformance in the last week.”
The report adds that “illiquid altcoins are more challenging to sell at size, particularly during pressuring times, which explains why smaller coins have experienced less excessive selling pressure in the last week”.
Meanwhile, Microstrategy CEO Michael Saylor described the events around this winter as a “parade of horribles” in which the consequences of lack of regulation in the crypto field have made it possible for wash trading and cross-collateralized altcoins to weigh down on Bitcoin.
“What you have is a 0 billion cloud of opaque, unregistered securities trading without full and fair disclosure, and they are all cross-collateralized with Bitcoin.”
“The general public shouldn’t be buying unregistered securities from wildcat bankers that may or may not be there next Thursday,” Saylor added, slamming at the recent collapses and suggesting that future actions by regulators could prevent the level of volatility that BTC is now experiencing.
Related Reading | Crypto Investors Find Safety In Stablecoins, Bitcoin, Ditch Altcoins En Masse
Why Bitcoin Price Could Drop 20% to $5,500 Before Rebounding
Is the bottom in? Since Bitcoin (BTC) fell precipitously to ,600 late last month, analysts have been asking if the leading cryptocurrency has finally found a price bottom after a multi-month downturn.
Analysts have understandably divided over the question, as the correct answer would show in which direction Bitcoin will head for the next couple of months. Some are bullish, others are bearish.
Some suggest that there may be another drop before the crypto asset finally finds a bottom.
Related Reading: Should History Repeat, Bitcoin Price Will Drop 40% to Bottom at ,300
Bitcoin Could Drop 20%, Analysts Warn
Top cryptocurrency analysis account BitcoinEconomics.io recently noted that they believe BTC “going down to 00 in Q1 2020 seems a likely scenario,” adding that there is likely going to be another accumulation and shakeout phase before a slower uptrend.
BTC going down to 00 in Q1 2020 seems a likely scenario. It may even touch k before that. More shakeout and accumulation before a sustained and slower upward trend is likely.
A few people predicted such a second smaller "bear market" in the first half of 2019. https://t.co/s9Px4SgUGr
— BitcoinEconomics.io (@BitcoinEcon) December 21, 2019
BitcoinEconomics’ analysis corroborates the sentiment of other prominent cryptocurrency traders.
According to a recent update from Jacob Canfield, a professional cryptocurrency trader, Bitcoin is not yet near a macro bottom in his eyes. He remarked that the cryptocurrency is likely to see a 20% drawdown from the current level of ,200 to ,500, for there is where the 0.786 Fibonacci Retracement of the rally from ,100 to ,000 lies.
What price do you guys have for the bottom on this #bitcoin downtrend?
I think we could see 00 personally as it is the 78.6% from the swing low to swing high, but we may see a bounce or two in between here and there. pic.twitter.com/2TSK8XhecH
— Jacob Canfield (@JacobCanfield) December 17, 2019
Canfield’s analysis that a move to ,500 could be had corroborates a similar thought from trader CryptoBirb, who noted that Bitcoin still is likely to see one final dump to ,400-,600, which he also pointed out coincides with the 0.786 Fibonacci.
ReBirb added that this drawdown would validate a trend seen in previous market cycles, which saw BTC see a short-term bearish though macro bullish throwback to key support prior to a resumption of a parabolic uptrend.
Related Reading: Research Group: Bitcoin’s Halving Unlikely to Catalyze Bull Run, But Here’s What Might
But Isn’t the Bottom In?
While some fear that more downside is likely, there are technical and fundamental factors suggesting that the ultimate bottom of the recent downturn is in.
He followed this up with the post seen below, in which the prominent analyst remarked that he expects for Bitcoin’s one-week Moving Average Convergence Divergence (MACD) indicator to turn upward, which will kick off the next round of growth in the BTC market.
Predicting the weekly MACD about to turn up…. going according to plan.
pic.twitter.com/xi0VJWojU0
— dave the wave (@davthewave) December 20, 2019
Related Reading: Bitcoin Price is Poised to Return to ,500 Lows; Analysts Explain Why
Featured Image from Shutterstock
The post Why Bitcoin Price Could Drop 20% to ,500 Before Rebounding appeared first on NewsBTC.
Ripple (XRP) Price Rebounding Nicely While BTC & ETH Continue To Struggle
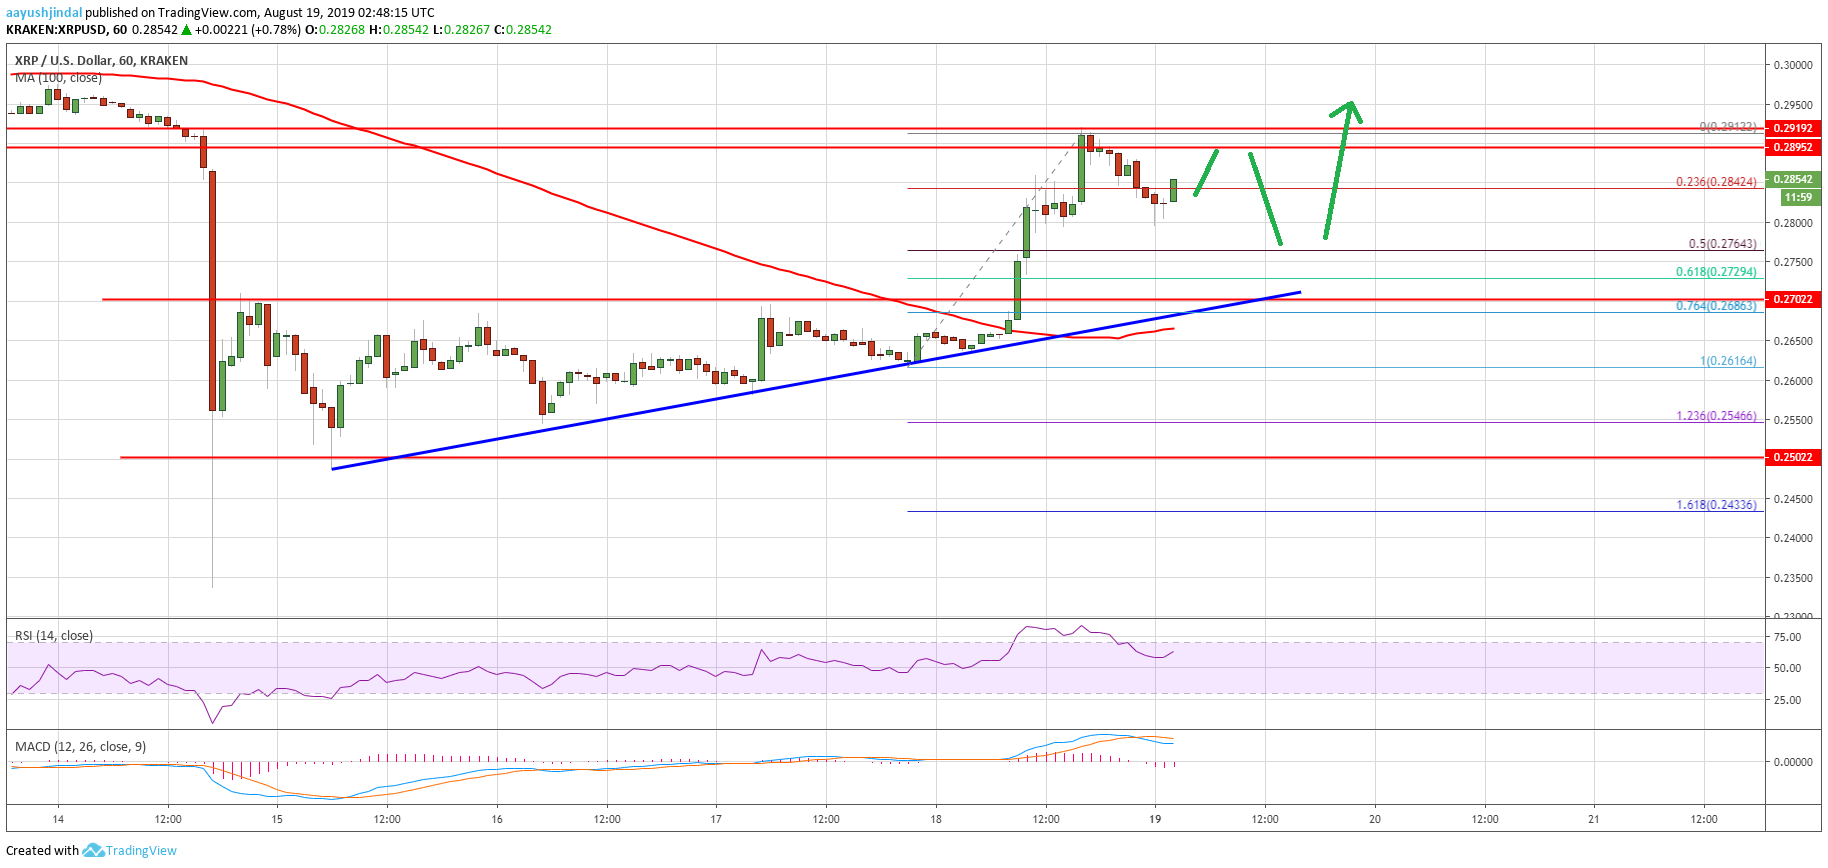
- Ripple price is currently correcting higher after a sharp decline to .2500 against the US dollar.
- The price is showing positive signs and is trading nicely above the .2720 level.
- Yesterday’s highlighted key bearish trend is active with resistance near .2780 on the hourly chart of the XRP/USD pair (data source from Kraken).
- The pair could correct higher towards the main .2850 and .2880 resistance levels in the near term.
Ripple price is correcting higher nicely above .2700 against the US Dollar, while bitcoin and Ethereum are struggling. XRP price could face strong resistance near .2850.
Ripple Price Analysis
Yesterday, we saw a significant decline in ripple below the .2850 support area against the US Dollar. Moreover, there was a close below .2800 and the 100 hourly simple moving average.
It opened the doors for more losses and the price declined below .2720 and .2650. Finally, the price traded towards the .2500 support area and formed a new monthly low near the .2470 level.
Later, it started a strong recovery and climbed above the .2600 resistance area. Additionally, there was a break above the 50% Fib retracement level of the downward move from the .3032 high to .2470 low. The price is now showing positive signs above the .2700 resistance.
More importantly, the price is likely to clear yesterday’s highlighted key bearish trend with resistance near .2780 on the hourly chart. If there is a successful close above the trend line and .2800, the price could continue to recover in the near term.
However, there is a major hurdle for ripple on the upside waiting near the .2850 level (the previous support), coinciding with the 100 hourly SMA. An intermediate resistance is near the 61.8% Fib retracement level of the downward move from the .3032 high to .2470 low.
If there is a clear break above the .2850 resistance, the price could turn bullish. The next stop for the bulls may perhaps be near the .3000 area.
Conversely, if the price fails to correct above .2800 and .2850, it could start a fresh decline. An immediate support is near the .2720 level. The main support is now near .2650, below which the price is likely to slide towards .2550.
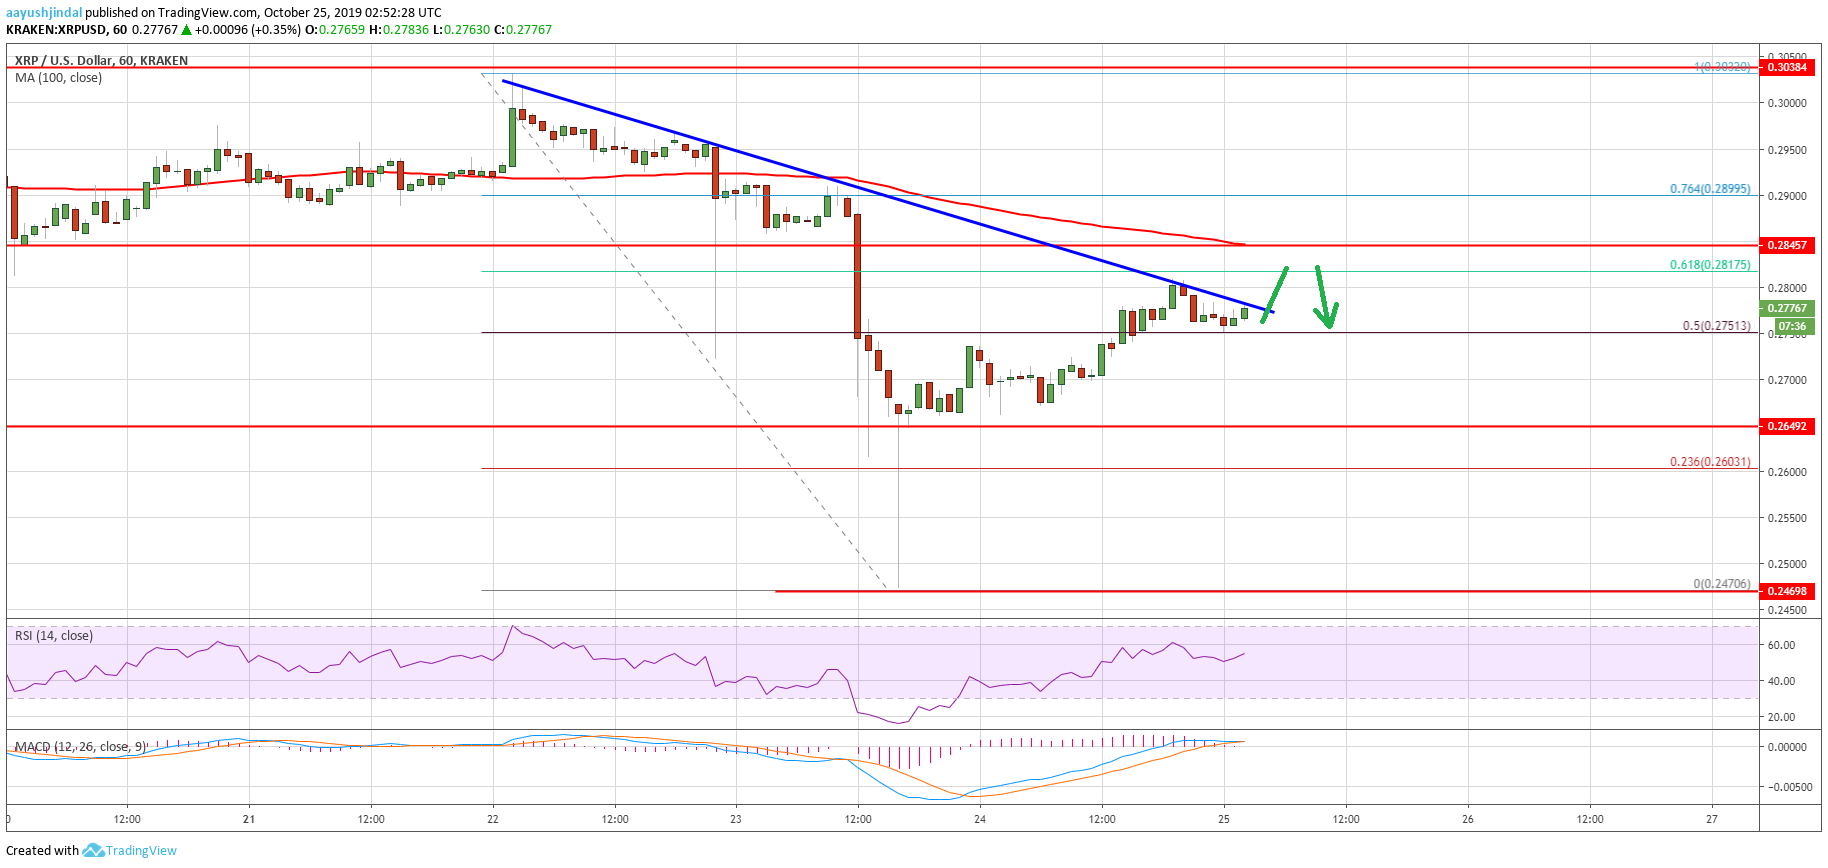
Looking at the chart, ripple price seems to be trading with a positive bias and it is likely to break the .2800 resistance. Having said that, the price is likely to struggle near the .2850 resistance.
Technical Indicators
Hourly MACD – The MACD for XRP/USD is likely to move into the bearish zone.
Hourly RSI (Relative Strength Index) – The RSI for XRP/USD is back above the 50 level.
Major Support Levels – .2720, .2650 and .2550.
Major Resistance Levels – .2800, .2820 and .2850.
The post Ripple (XRP) Price Rebounding Nicely While BTC & ETH Continue To Struggle appeared first on NewsBTC.
Ripple (XRP) Price Rebounding After Sharp Drop To $0.2500 Support
- Ripple price declined heavily after it broke the key .2850 support area against the US dollar.
- The price tested the main .2500 support area and it is currently rebounding above .2650.
- There is a major bearish trend line forming with resistance near .2800 on the hourly chart of the XRP/USD pair (data source from Kraken).
- There is showing signs of a strong recovery and it might rebound towards the .2850 resistance.
Ripple price is correcting losses against the US Dollar and bitcoin. Recently, XRP price dived close to 10%, but the .2500 area acted as a strong support.
Ripple Price Analysis
Yesterday, we saw a minor downside correction in ripple from the .3000 resistance against the US Dollar. However, XRP price failed to hold the key .2850 support area and declined heavily in the last three sessions.
During the slide, there was a break below a few important supports near .2800 and .2720. Moreover, the price settled below .2800 and 100 hourly simple moving average. It opened the doors for more downsides below the .2650 support.
Finally, the price spiked below the .2550 and .2500 support levels. The price action suggests that the .2500 area acted as a strong support. As a result, ripple recovered aggressively and climbed back above the .2600 level.
Additionally, there was a break above the 50% Fib retracement level of the recent decline from the .2908 high to .2470 low. An immediate resistance on the upside is near the .2720 and .2750 levels.
The main hurdle is near the .2750 level since it coincides with the 61.8% Fib retracement level of the recent decline from the .2908 high to .2470 low. More importantly, there is a major bearish trend line forming with resistance near .2800 on the hourly chart of the XRP/USD pair.
On the downside, the .2650 area is a strong support for the current wave. As long as ripple is trading above the .2650 support, it could recover towards the .2800 and .2850 resistance levels.
Conversely, if the price fails to correct above .2750 and .2800, there is a risk of another slide below the .2650 support. The next support is near the .2570 and .2550 levels.

Ripple Price
Looking at the chart, ripple price clearly retreating after testing the main .2500 support area. There are positive signs visible on the chart, but the bulls could find it difficult to push the price back above .2750 and .2800.
Technical Indicators
Hourly MACD – The MACD for XRP/USD is currently moving nicely in the bullish zone.
Hourly RSI (Relative Strength Index) – The RSI for XRP/USD is correcting higher and is currently near the 40 level.
Major Support Levels – .2650, .2550 and .2500.
Major Resistance Levels – .2750, .2800 and .2850.
The post Ripple (XRP) Price Rebounding After Sharp Drop To .2500 Support appeared first on NewsBTC.
Bitcoin Price (BTC) Rebounding But $8.5K Resistance Holds Key
- Bitcoin price started an upside correction above the ,000 resistance against the US Dollar.
- The price is currently up around 5% and it recently tested the ,350 area.
- There was a break above yesterday’s highlighted declining channel with resistance near the ,060 level on the hourly chart of the BTC/USD pair (data feed from Kraken).
- The price is currently consolidating gains and it could correct lower towards ,150 or ,050.
Bitcoin price is currently rebounding above ,200 against the US Dollar. However, BTC is still facing a lot of hurdles on the upside near ,400 and ,500.
Bitcoin Price Analysis
Yesterday, BTC traded to a new weekly low near ,770 against the US Dollar. Later, the price started an upside correction above the ,850 and ,920 resistance levels. Moreover, there was a break above the ,000 resistance and the 100 hourly simple moving average. During the rise, there was a break above yesterday’s highlighted declining channel with resistance near the ,060 level on the hourly chart of the BTC/USD pair.
The pair even climbed above the ,200 resistance and tested the ,350 level. A swing high was formed near ,348 and the price is currently correcting gains. It is trading towards the 23.6% Fib retracement level of the recent rebound from the ,770 low to ,348 high. It seems like there is a rising channel forming with support near the ,200 level on the same chart.
If there is a downside break below the channel support, the price could correct lower towards the ,150 level. The main support on the downside is near the ,050 level and the 100 hourly simple moving average. Moreover, the 50% Fib retracement level of the recent rebound from the ,770 low to ,348 high is close to the ,060 level to provide support.
Therefore, dips towards the ,050 level might find support in the near term. Any further declines could push the price towards ,000 or the 61.8% Fib retracement level of the recent rebound from the ,770 low to ,348 high. On the upside, there are many hurdles near ,350, ,400 and ,500. A successful close above the ,500 resistance is must for the price to move into a positive zone.
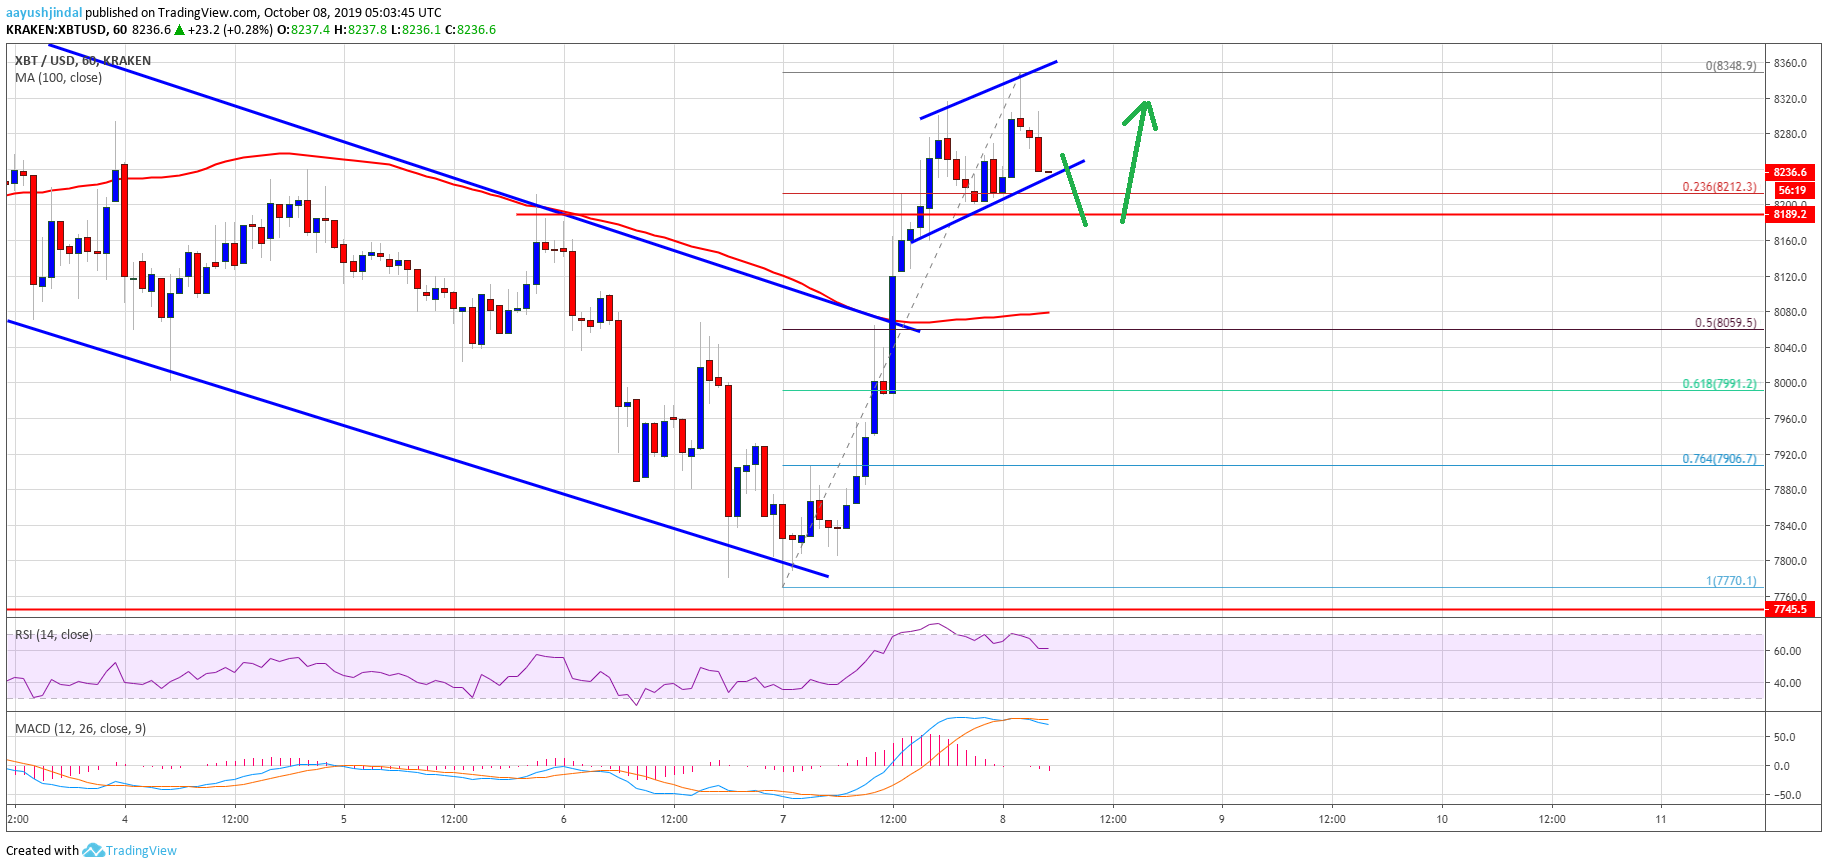
Looking at the chart, bitcoin is rebounding from the ,770 swing low. However, the price is still trading well below the main ,500 resistance area. In the short term, there could be another dip towards ,150 or ,050 before the price climbs above ,350.
Technical indicators:
Hourly MACD – The MACD is slowly moving into the bearish zone.
Hourly RSI (Relative Strength Index) – The RSI for BTC/USD is now correcting lower towards the 60 level.
Major Support Levels – ,150 followed by ,050.
Major Resistance Levels – ,350, ,400 and ,500.
The post Bitcoin Price (BTC) Rebounding But .5K Resistance Holds Key appeared first on NewsBTC.
Ripple Price (XRP) Gains 10%: ETH & BTC Rebounding
- Ripple price climbed higher recently above the .2450 and .2500 resistances against the US dollar.
- The price is currently trading near the .2620 resistance area and is consolidating gains.
- There was a break above a major bearish trend line with resistance near .2415 on the hourly chart of the XRP/USD pair (data source from Kraken).
- The price might correct a few points, but it is likely to test the main .2650 resistance in the near term.
Ripple price is showing signs of a decent upside correction against the US Dollar and bitcoin. XRP price could continue higher, but the .2650 resistance holds the key.
Ripple Price Analysis
After a strong decline, ripple price started consolidating above the .2320 level against the US Dollar. The XRP/USD pair traded in a range and recently started a decent upward move above the .2400 resistance area. Moreover, the price broke the key .2420 resistance area and the 100 hourly simple moving average to start the recent upside correction.
During the rise, there was a break above a major bearish trend line with resistance near .2415 on the hourly chart of the XRP/USD pair. As a result, the pair surged above the .2500 and .2550 resistance levels. Ripple is up around 10% in the past three sessions and it even tested the .2620 resistance area. A high was formed near .2618 and the price is currently showing a lot of positive signs.
It dipped a few points below the .2600 level and the 23.6% Fib retracement level of the recent wave from the .2352 low to .2618 high. However, the decline was limited and contained by the .2480 support area. Moreover, the 50% Fib retracement level of the recent wave from the .2352 low to .2618 high acted as a strong support.
The price is now trading with a positive bias above the .2500 level. If there is an upside break above the .2620 resistance area, the price could test the main .2650 resistance. A clear break above the .2650 resistance area might set the pace for a larger upward move in the coming sessions. On the downside, the key supports are near the .2480 and .2450 levels.
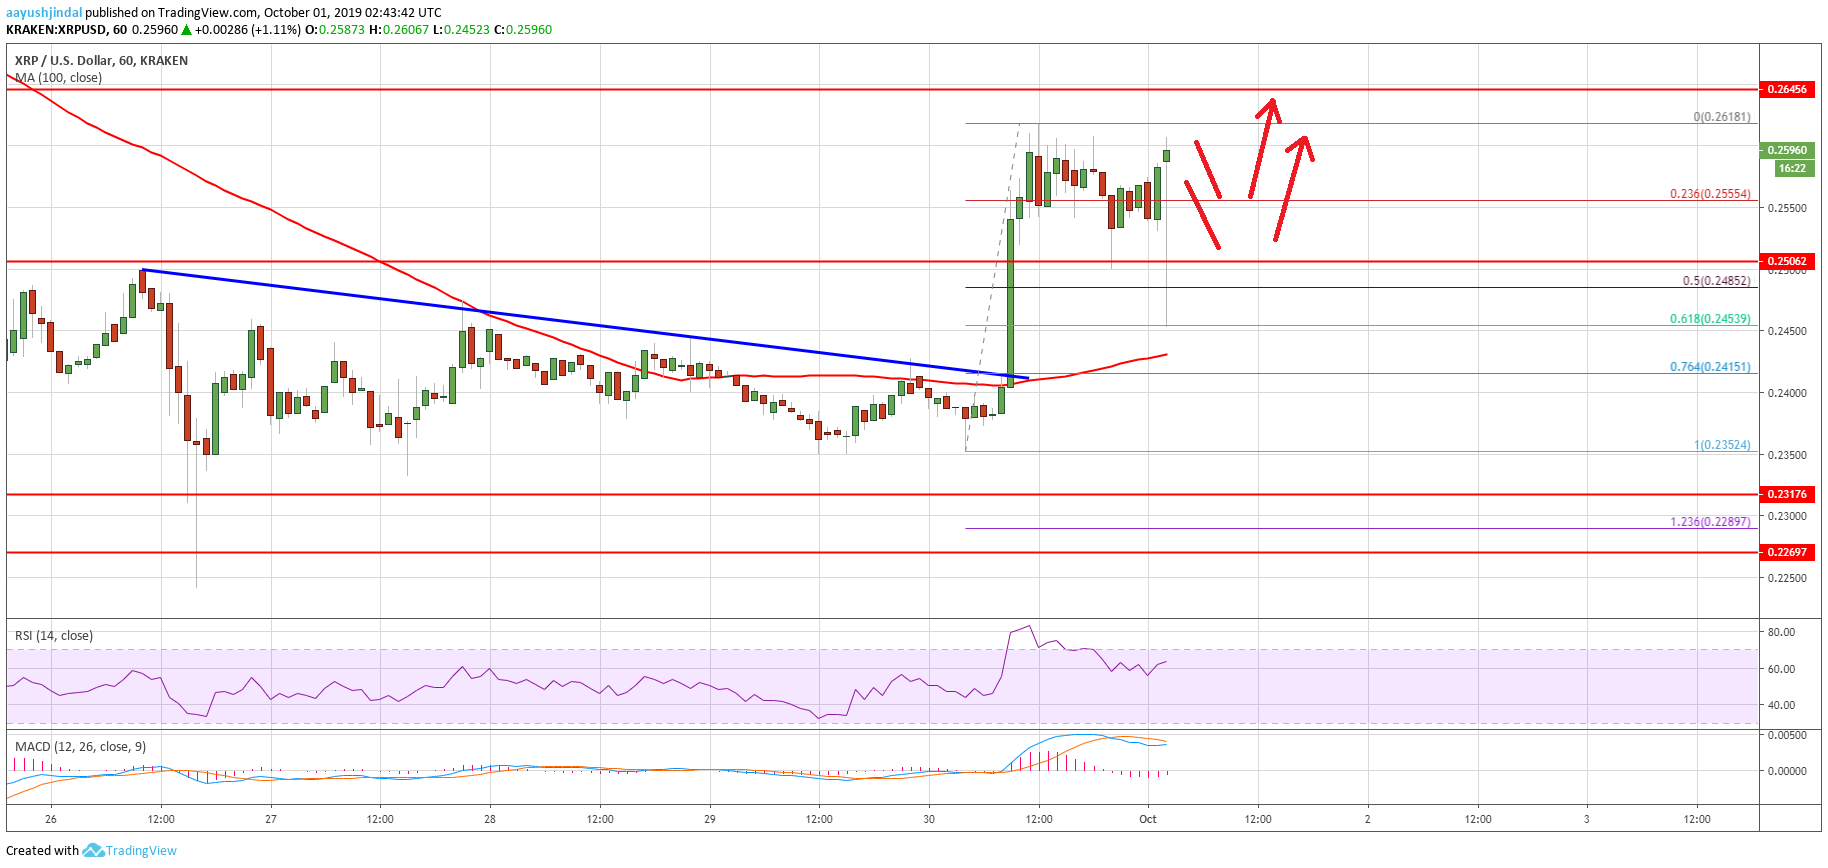
Looking at the chart, ripple price is trading nicely above .2500. However, the bulls need to gain strength above the .2620 and .2650 resistance levels to push the price further higher in the near term.
Technical Indicators
Hourly MACD – The MACD for XRP/USD is about to move back into the bullish zone.
Hourly RSI (Relative Strength Index) – The RSI for XRP/USD is currently well above the 50 level.
Major Support Levels – .2520, .2480 and .2450.
Major Resistance Levels – .2620, .2650 and .2720.
The post Ripple Price (XRP) Gains 10%: ETH & BTC Rebounding appeared first on NewsBTC.
Crypto Market & Bitcoin Rebounding: BCH, Litecoin, TRX, XLM Analysis
- The total crypto market cap bounced back sharply after testing the 5.0B support area.
- Bitcoin price is back above the ,000 and ,100 levels, with positive signs.
- Litecoin (LTC) price is showing positive signs and it could soon revisit the .00 resistance.
- BCH price is gaining pace and it could rise towards the 5 and 0 resistance levels.
- Tron (TRX) price settled above the .0170 level and it could continue to climb higher.
- Stellar (XLM) price surged recently and it is likely to march towards the .0850 level.
The crypto market cap and bitcoin (BTC) are back in a positive zone. Ethereum (ETH), litecoin (LTC), ripple, BCH, tron (TRX), stellar (XLM) and other altcoins could continue to climb higher.
Bitcoin Cash Price Analysis
BCH price corrected lower recently and tested the 5 support area against the US Dollar. Later, the price bounced back above the 0 and 5 levels. It seems like the price is about to break the 0 resistance and it could continue to rise towards the 5 and 0 levels.
On the downside, there is a strong support forming near the 5 level. As long as the price is above 5, there are high chances of more gains in the coming sessions.
Litecoin (LTC), Tron (TRX) and Stellar (XLM) Price Analysis
Litecoin price remained well bid above the .00 and .00 support levels. LTC price is now trading above the .00 level and it seems like it could revisit the .00 resistance. Any further upsides will most likely push the price towards the .00 and .00 levels.
Tron price corrected lower and tested the .0165 support area. TRX price is back in a positive zone and is trading nicely above the .0170 level. It seems like the price may perhaps recover further and trade towards the .0180 and .0182 levels in the near term.
Stellar price surged higher this week above the .0700 resistance level. XLM price is now trading above .0750 and it may soon break the .0800 resistance level. If there are more gains, there are high chances of a run towards the .1000 resistance area.
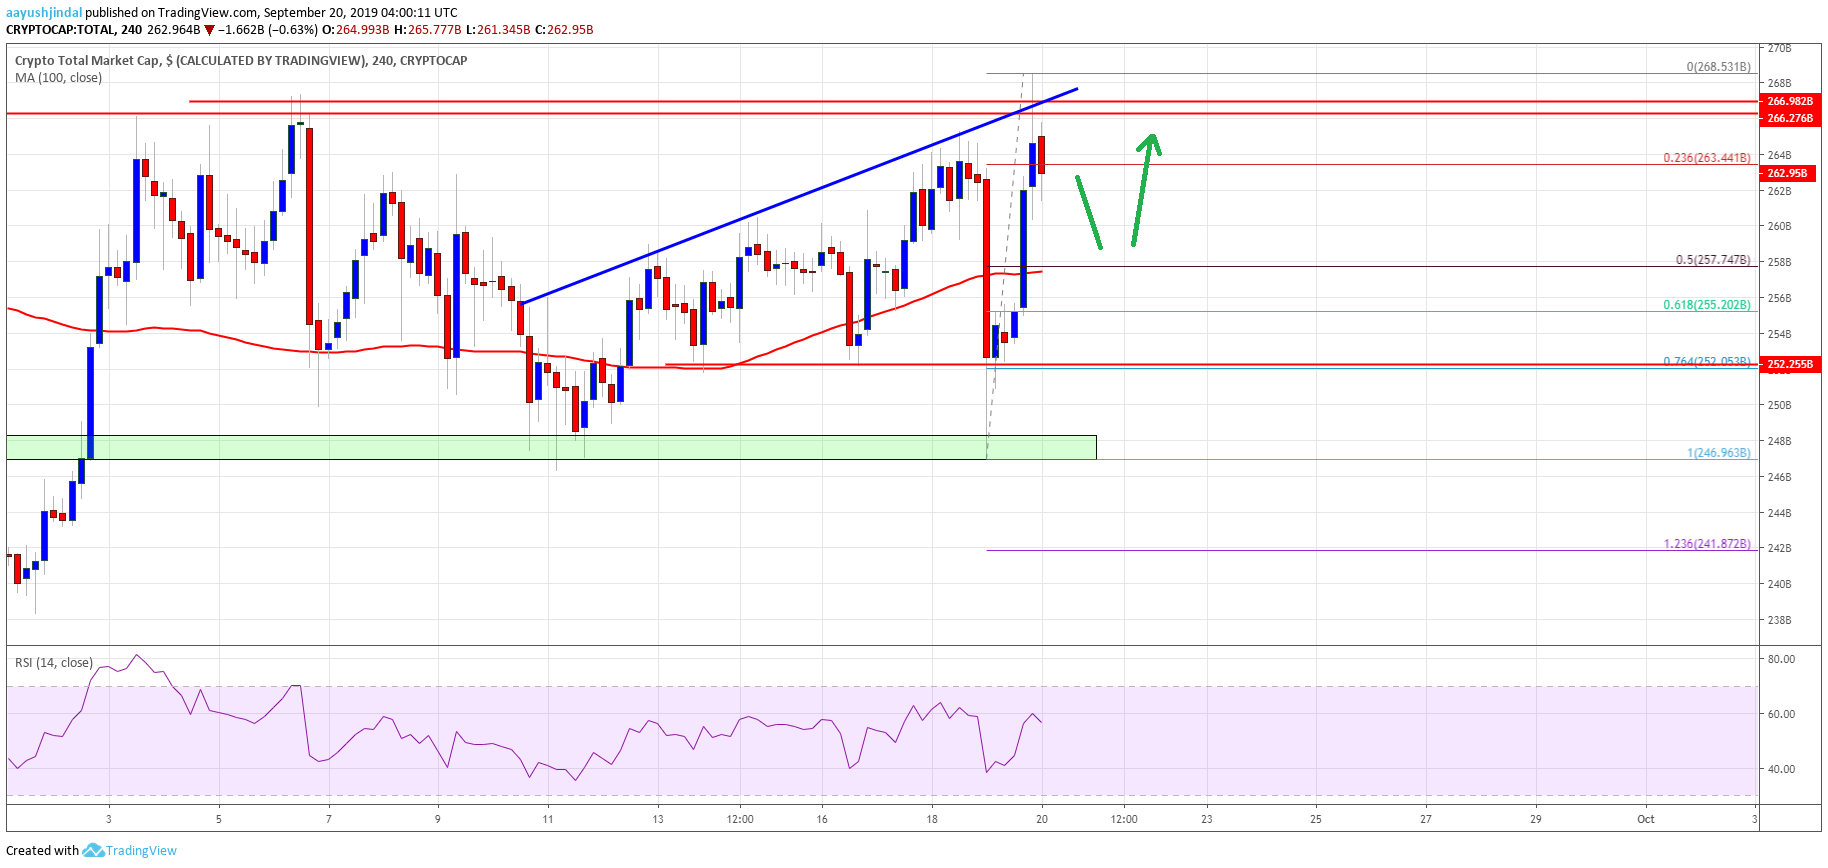
Looking at the total cryptocurrency market cap 4-hours chart, there was a test of the key 5.0B support area. The market cap stayed above the 5.0B support area and recently bounced back. There was a sharp rise above the 5.0B and 0.0B resistance levels. However, the market cap is again struggling to clear the 5.0B resistance area. If there is an upside break above 5.0B, there could be a decent rally towards the 0.0B and 5.0B resistance levels. Overall, there could be more upsides in bitcoin, Ethereum, EOS, litecoin, ripple, XLM, BCH, BNB, TRX, ADA, XMR, and other altcoins in the coming sessions.
The post Crypto Market & Bitcoin Rebounding: BCH, Litecoin, TRX, XLM Analysis appeared first on NewsBTC.
Bitcoin Price (BTC) Rebounding But Can Bulls Overcome $10,500?
- Bitcoin price remained well supported above the main ,000 level against the US Dollar.
- The price is trading nicely above the ,250 resistance, but it might struggle near ,500.
- Yesterday’s highlighted key declining channel was breached with resistance near ,140 on the hourly chart of the BTC/USD pair (data feed from Kraken).
- The price is currently consolidating gains below the ,450 and ,500 resistance levels.
Bitcoin price is gaining bullish momentum above ,300 against the US Dollar. BTC must break ,450 and ,500 to continue higher in the coming sessions.
Bitcoin Price Analysis
This week, we saw multiple tests of the ,000 support by bitcoin price against the US Dollar. However, the bears failed to gain control below ,000. As a result, the price started a fresh increase from the ,893 swing low. The price broke the ,000 and ,200 resistance levels to move into a short term positive zone. Moreover, there was a close above the ,250 level and the 100 hourly simple moving average.
During the rise, the price surpassed the 50% Fib retracement level of the last key decline from the ,598 high to ,893 low. Moreover, yesterday’s highlighted key declining channel was breached with resistance near ,140 on the hourly chart of the BTC/USD pair. The pair even traded above the ,400 resistance level. However, the ,500 resistance area is still intact.
At the moment, the price is facing hurdles near the 76.4% Fib retracement level of the last key decline from the ,598 high to ,893 low. If there is an upside break above ,450 and ,500, the price could continue to rise in the coming sessions. In the mentioned case, the price is likely to gain momentum above the ,590 and ,600 levels.
Conversely, if there is a downside correction, the price could test the ,200 support area. Additionally, the 100 hourly SMA is also near the 100 hourly SMA. If there a close below the 100 hourly SMA, the price is likely to resume its decline and revisit the ,000 support area. More importantly, a convincing close below the ,000 support might start a strong decline in the coming sessions.
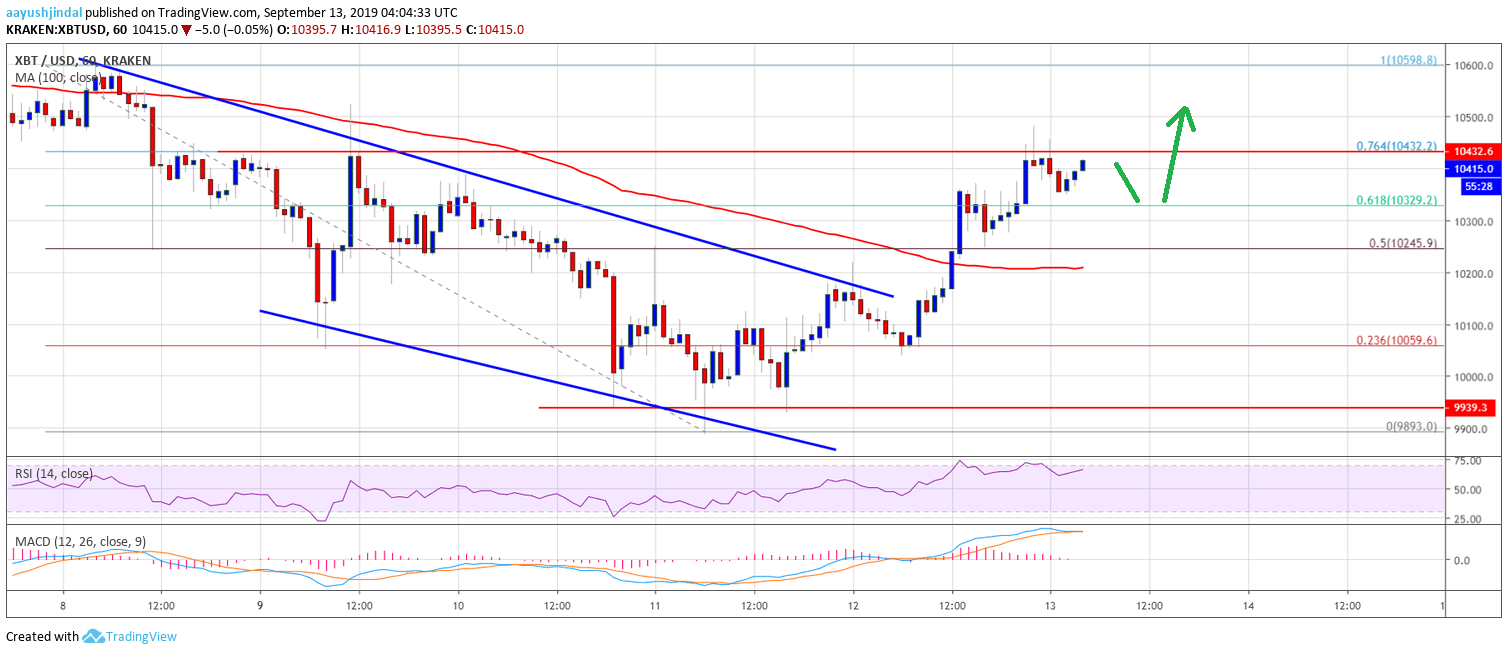
Looking at the chart, bitcoin price is trading with a positive bias above the ,200 level and the 100 hourly SMA. Therefore, there are chances of a decent rise above the ,450 and ,500 level. Conversely, only a close below ,200 might spark fresh bearish moves.
Technical indicators:
Hourly MACD – The MACD is slowly moving back into the bearish zone.
Hourly RSI (Relative Strength Index) – The RSI for BTC/USD is now well above the 50 level.
Major Support Levels – ,200 followed by ,000.
Major Resistance Levels – ,450, ,500 and ,600.
The post Bitcoin Price (BTC) Rebounding But Can Bulls Overcome ,500? appeared first on NewsBTC.
Ripple Price (XRP) Rebounding Nicely As Bitcoin Holding Above $10.2K
- Ripple price is currently trading with a positive bias above .2750 against the US dollar.
- Bitcoin price climbed above the ,200 and ,300 resistance levels to start a decent recovery.
- There is a key bullish trend line forming with support near .2700 on the hourly chart of the XRP/USD pair (data source from Kraken).
- The pair is likely to accelerate higher above the .2900 and .2950 resistance levels.
Ripple price is currently rebounding with a positive bias against the US Dollar, similar to bitcoin. XRP price must surpass the .2920 resistance to continue higher.
Ripple Price Analysis
This past week, we saw a strong decline in XRP price below the .3000 support against the US Dollar. The XRP/USD pair even broke the .2500 support level. Finally, it traded towards the .2340 level and recently started an upside correction. The crypto market recovered in the past few sessions, with positive moves in Ethereum, ripple, EOS and litecoin.
Ripple price climbed above the .2650 and .2700 resistance levels to move into a positive zone. Moreover, there was a break above the .2800 resistance and a close above the 100 hourly simple moving average. The upward move was positive, with a break above the .2850 resistance. However, the price ran into a crucial resistance area near the .2900 and .2920 levels.
At the moment, the price is correcting gains and recently declined below the 23.6% Fib retracement level of the upward move from the .2616 low to .2913 high. However, there are many supports on the downside near the .2750 and .2700 levels. Additionally, there is a key bullish trend line forming with support near .2700 on the hourly chart of the XRP/USD pair.
The 50% Fib retracement level of the upward move from the .2616 low to .2913 high is also near the .2760 level to act as a support. Therefore, if there is a downside correction, the bulls are likely to protect .2750 and .2700. On the upside, the main resistances are near .2900 and .2920. Therefore, a successful break above .2920 might accelerate gains towards the .3000 and .3050 levels.
Looking at the chart, ripple price is clearly closing in towards the key barriers near .2920. If the price struggles to climb above .2920, there could be a downward move towards the .2700 level. Conversely, a successful break above .2920 could pump the price towards or above .3000 in the near term.
Technical Indicators
Hourly MACD – The MACD for XRP/USD is slowly moving into the bearish zone.
Hourly RSI (Relative Strength Index) – The RSI for XRP/USD is currently placed well above the 50 level.
Major Support Levels – .2750, .2700 and .2650.
Major Resistance Levels – .2900, .2920 and .3000.
The post Ripple Price (XRP) Rebounding Nicely As Bitcoin Holding Above .2K appeared first on NewsBTC.