 In the ever-evolving world of luxury, a new frontier has emerged – one where the boundaries between virtual and physical assets blur. Introducing Ginza Xiaoma, the premier destination for savvy crypto investors seeking to diversify their portfolios with the ultimate status symbol: the iconic Hermès Birkin bag. Introducing Ginza Xiaoma As the crypto market continues […]
Bitcoin News
XRP Set For Monumental Rally: Analyst Points To Extremely Rare Signal
The latest chart analysis by crypto analyst @Cryptobilbuwoo0, published via X, offers a compelling narrative for XRP’s potential upward trajectory when juxtaposed against the total cryptocurrency market capitalization. The analyst emphasizes key technical indicators and historical patterns, suggesting that XRP might be on the brink of a significant bullish phase.
XRP Price Poised To “Bounce”
The XRP/Total chart primarily illustrates a descending trajectory that began forming from its early 2018 peak. This overarching downtrend is marked by successive lower highs that articulate a consistent descending trendline.
Moreover, @Cryptobilbuwoo0 highlights the ‘Bounce Back Line,’ a horizontal support line that has historically acted as a crucial reversal point for the XRP price action. The chart shows several instances where the price of XRP, upon reaching this line, has rebounded dramatically.
The last instance of XRP interacting with the “Bounce Back Line” was on December 28, 2020. Following this touchpoint, the price soared over 1,100%, climbing from .18 to . Earlier, on February 27, 2017, XRP escalated from just under .02 to .35 within 10 months. Currently, XRP is once again nearing the “Bounce Back Line.” Given the historic outcomes following support from this level, the analyst predicts another significant rally may be on the horizon.
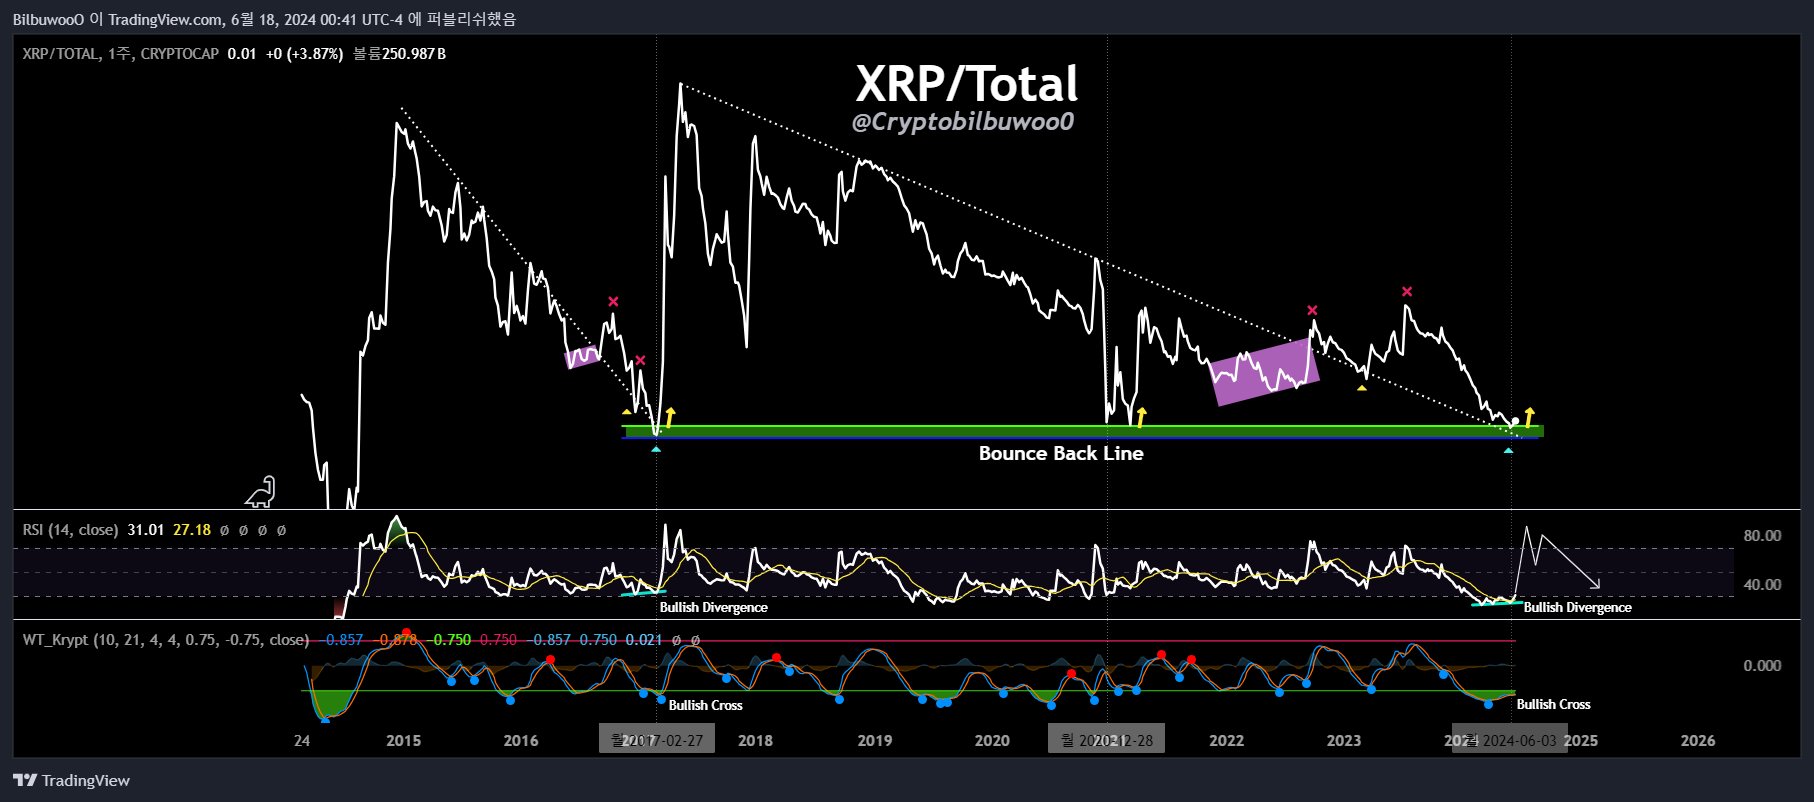
The chart analysis further deepens with a nuanced look at the Relative Strength Index (RSI) and the Wavetrend Indicator (WT Krypt), which are pivotal to understanding the market’s momentum and potential reversals. The 14-day RSI is currently nearing 31, approaching the oversold territory which historically signals a buying opportunity or a trend reversal. This is evident in the past markings on the chart, where similar RSI levels have coincided with the “Bounce Back Line” and substantial upward price movements.
The Wavetrend Indicator, used for spotting the start and end of cycles in the cryptocurrency’s price, has shown several bullish signs. Bullish divergences have been a critical focus, occurring when the price of XRP makes new lows while the indicator does not follow suit, suggesting a decrease in downward momentum. Moreover, the recent crossover of the Wavetrend lines (red crossing over blue) is typically interpreted as a bullish entry signal, indicating potential upward price movement.
In addition to the primary indicators, the analyst has annotated the chart with past price actions and highlighted areas and patterns, such as bullish divergences. These annotations serve to emphasize significant trading zones and anticipated trend shifts based on historical data. The marked sections of the chart indicate that each time similar conditions were met, there followed a significant increase in the XRP price, reinforcing the bullish outlook presented in the current analysis.
@Cryptobilbuwoo0’s analysis suggests that XRP, currently positioned at a historically significant price level and supported by bullish indicator signals, is poised for a potential breakout. This outlook is bolstered by the RSI nearing oversold conditions and the positive signals from the Wavetrend Indicator. If the historical pattern repeats, the crypto asset could see a substantial rally, affirming the analyst’s perspective:
Looking at the XRP/Total chart, XRP has always risen significantly from the rebound line. Indicators are also calling the bulls. XRP always moves alone like a maverick. XRP’s showtime begins.
At press time, XRP traded at .49.
Bitcoin ‘Realized Volatility’ Showing Very Rare Trend: What Could Be Next
Data shows that the Bitcoin Realized Volatility metric has fallen to historically low levels. What generally happens after this pattern forms?
Bitcoin Realized Volatility Has Decline To Extreme Lows Recently
In a post on X, CryptoQuant author Axel Adler Jr has discussed about the latest trend taking place in the Realized Volatility of Bitcoin. The Realized Volatility here refers to an indicator that basically tells us about how volatile a given asset has been based on its price returns within a specified window.
When the value of this metric is high, it means that the asset in question has experienced a large number of fluctuations during the period. On the other hand, the low indicator implies that the price action has been stale for the commodity.
Now, here is a chart that shows the trend in the 1-week Realized Volatility for Bitcoin over the last few years:
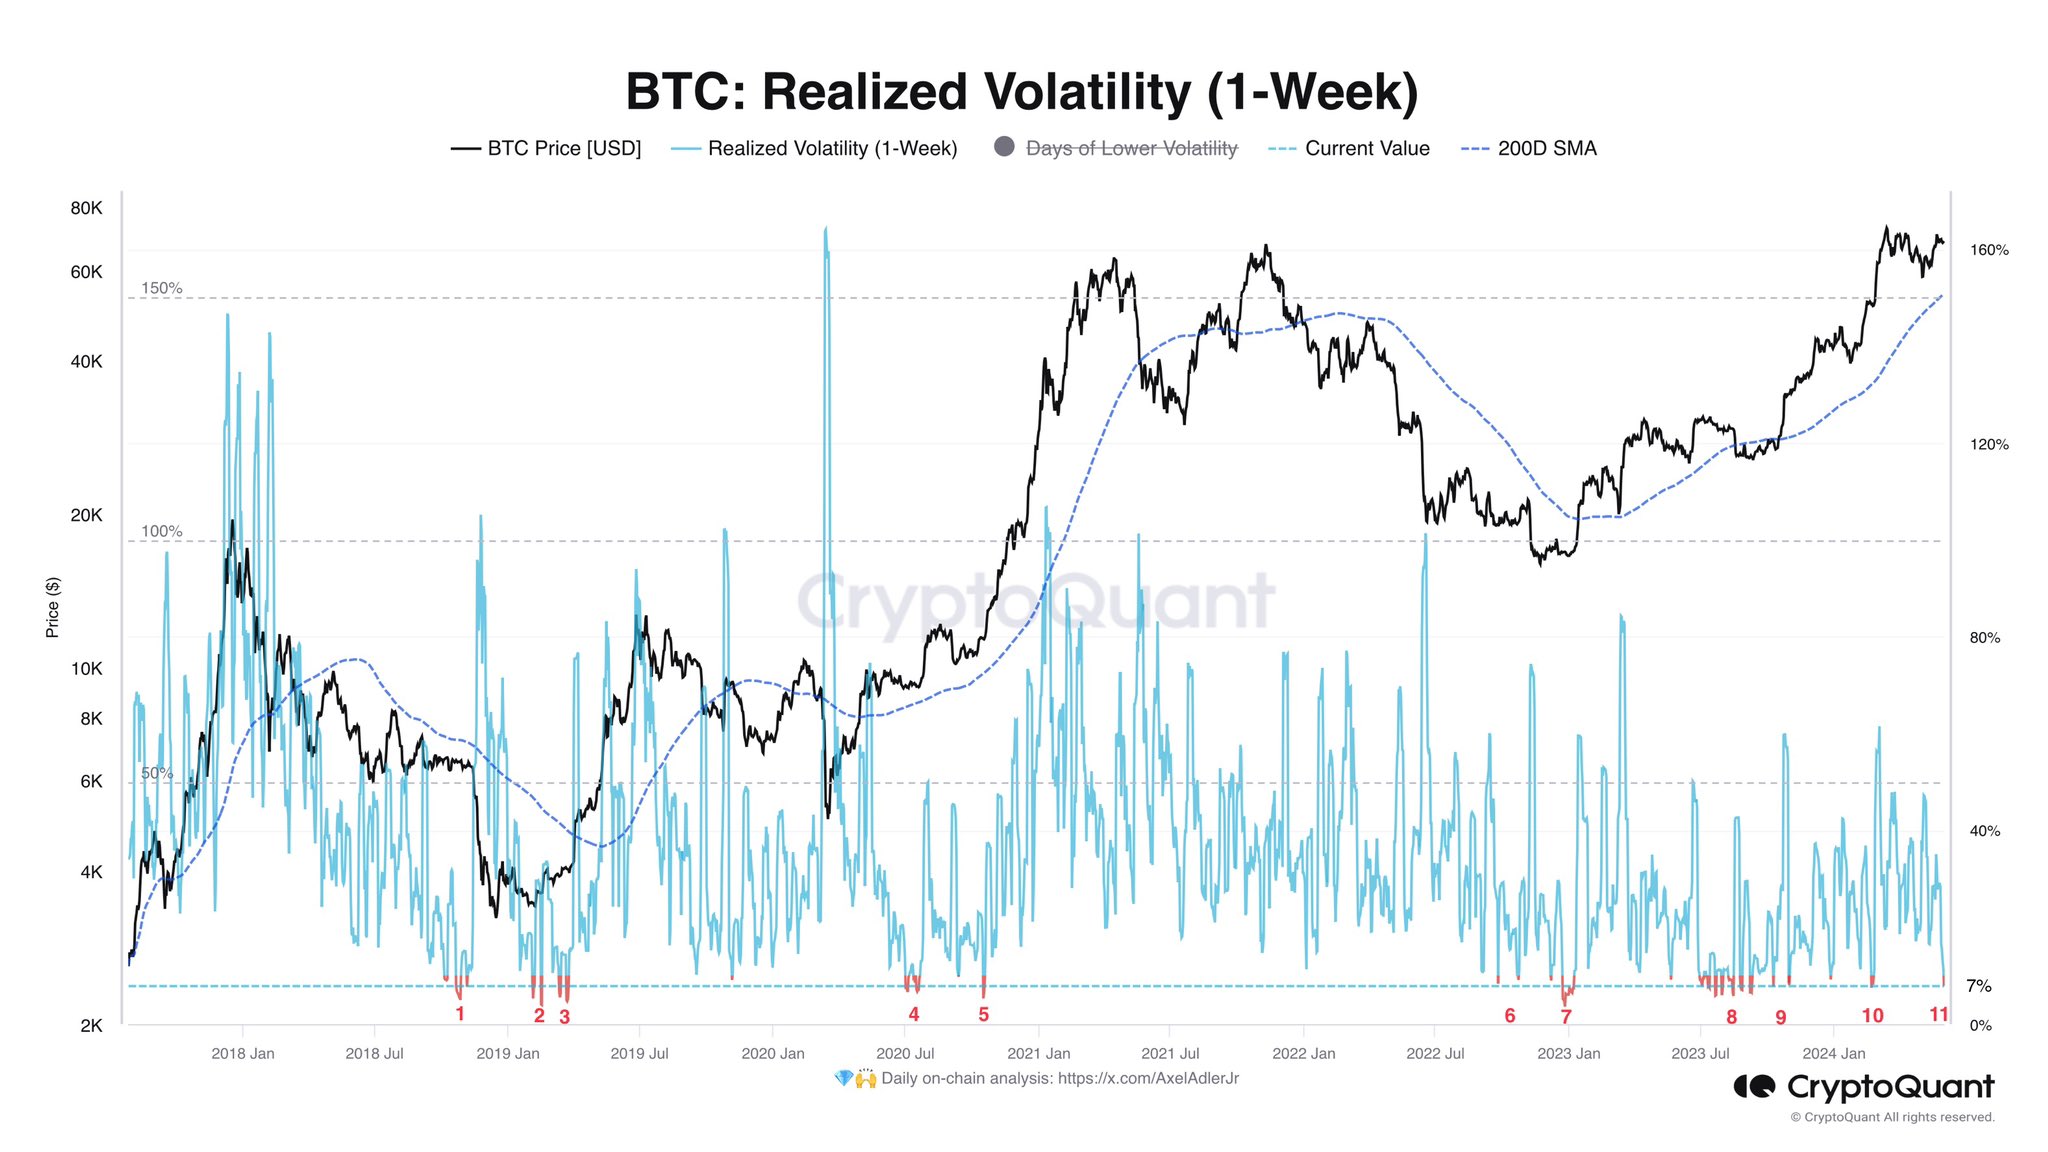
As displayed in the above graph, the 1-week Bitcoin Realized Volatility has declined to pretty low levels of around 7% recently. This is so extreme that only ten other instances in the past six years have seen the metric go similarly low.
This means that the cryptocurrency’s recent consolidation has been amongst the tightest in its history; as for what this trend in the indicator could mean for the cryptocurrency, perhaps past patterns could provide some hints.
An inspection of the chart reveals that such stale price action in the asset has generally unwound with a burst of sharp volatility. The latest instance occurred right before the rally towards the new all-time high (ATH).
Given this pattern, it’s possible that the recent BTC consolidation could also lead to another sharp move for the cryptocurrency. Something to note, however, is that the volatility emerging out of lows in the Realized Volatility has historically gone either way, implying that the price move emerging out of this tight range could very well be a crash.
It remains to be seen how the Bitcoin price will develop from here on out, given the historically stale action it has witnessed over the past week.
In other news, as Axel pointed out in another X post, the recent movement from the bankrupt exchange Mt. Gox has meant that many on-chain indicators have shown false signals.
The analyst has cited the Bitcoin Adjusted Spent Output Profit Ratio (aSOPR) chart as an example.
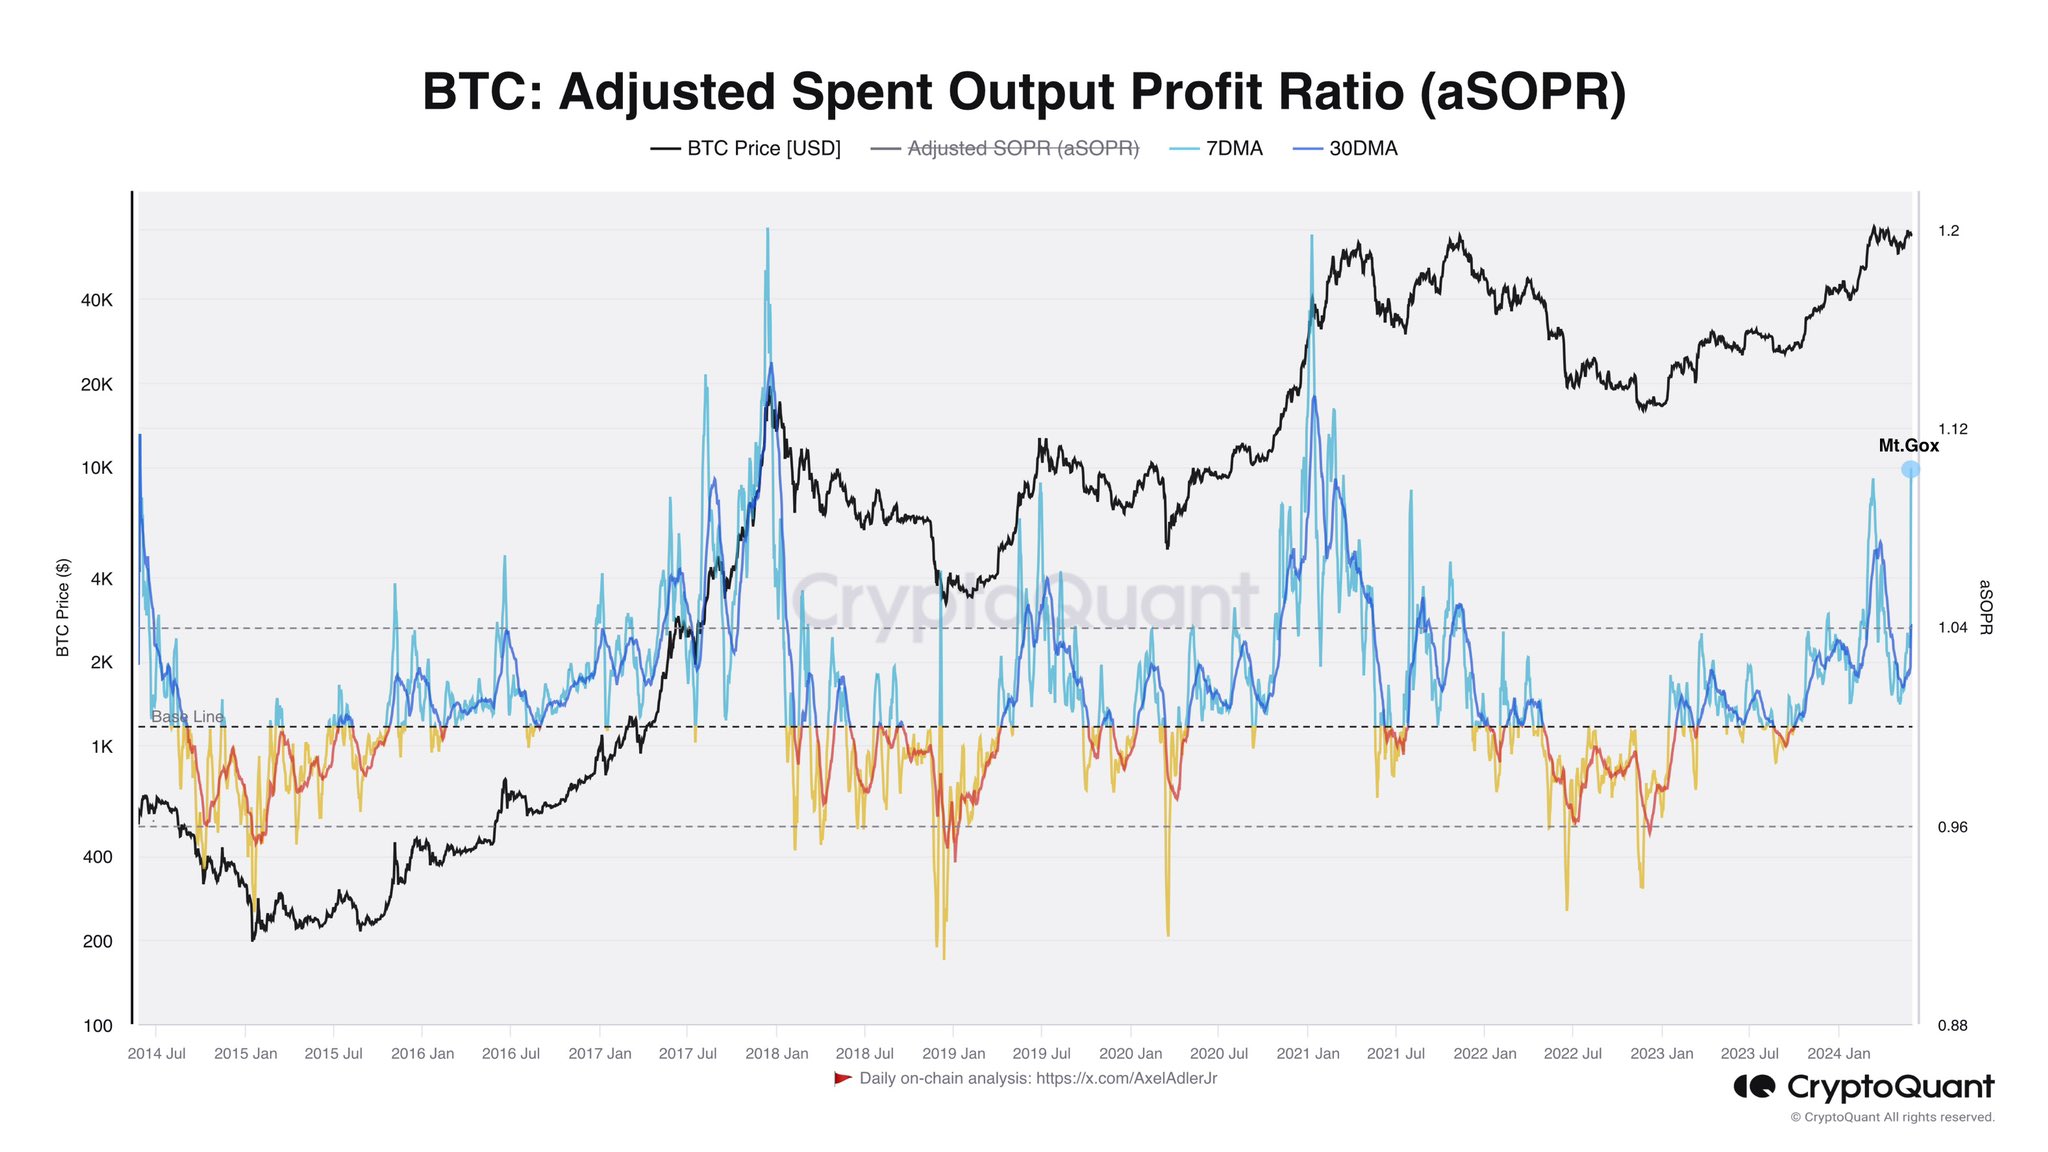
The aSOPR keeps track of the net profit or loss investors across the network realize. As the Mt. Gox BTC had been sitting still in wallets for quite a long time, it’s not surprising that its movement has “realized” a large amount of profit.
Of course, this spike in the indicator isn’t actually a sign of profit-taking, so it’s not a signal that would impact the market.
BTC Price
Bitcoin has declined over the past day as its price is now down to ,800.
Bitcoin Slump Pushes New Whales Underwater: A Rare Opportunity To Buy?
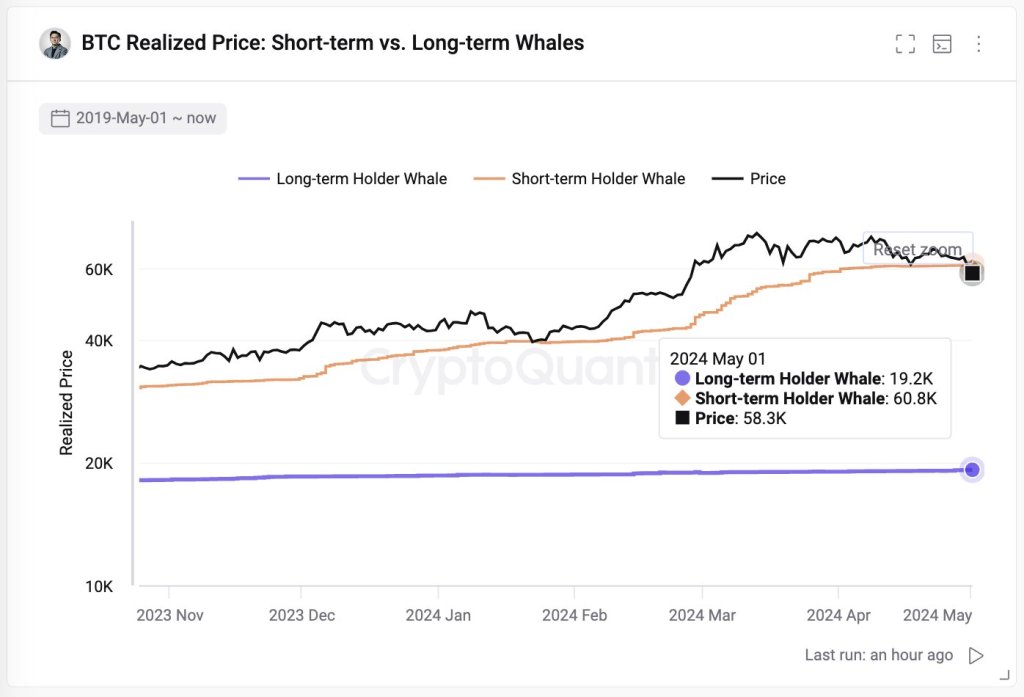
As Bitcoin slumps, on-chain data by Ki Young Ju, the founder of the blockchain analytics platform CryptoQuant, paints a stark picture: all new whales, including holders of spot exchange-traded funds (ETFs), are now underwater.
New Whales And Spot ETF Investors Are In Red
Taking to X, Ju said that more losses would be incoming, predicting that HODLers will find “max pain” at around ,000. The dip is less than ,000 from spot rates, suggesting that although there are cracks, the correction might not be deep.
This overview is welcomed, considering the recent sell-off. Even so, predicting price bottoms in a fast-moving market influenced by multiple forces is tough.
As price action stands, Ju says believers may take the opportunity to double down on the coin. The founder adds that the current price discount presents an opportunity for savvy investors to outperform traditional finance whales, including institutions with BTC exposure via spot ETFs in the United States.
Bitcoin is under immense liquidation pressure at the time of this writing. Though bulls soaked up the sell-off earlier today, the coin remains within a bearish breakout. Prices are trading below the support zone of between ,000 and ,000 and below April 2024.
Inflow To Spot Bitcoin ETFs Decline As Sentiment Deteriorate
This formation suggests that though bulls are optimistic, the path of least resistance remains southwards for now. BTC dropped after posting impressive returns from October 2023 to March 2024, when prices peaked. Some analysts think the current cool-off is inevitable following sharp gains in the last six months.
The fact that whales are underwater was unexpected, considering the state of affairs in the last week of April. Then, the inflow from new whales nearly doubled the cumulative holdings of older whales. Analysts said this influx of fresh capital pointed to growing institutional interest.
However, looking at the current price action, new whales are now in the red territory, and their excitement seems to wane.
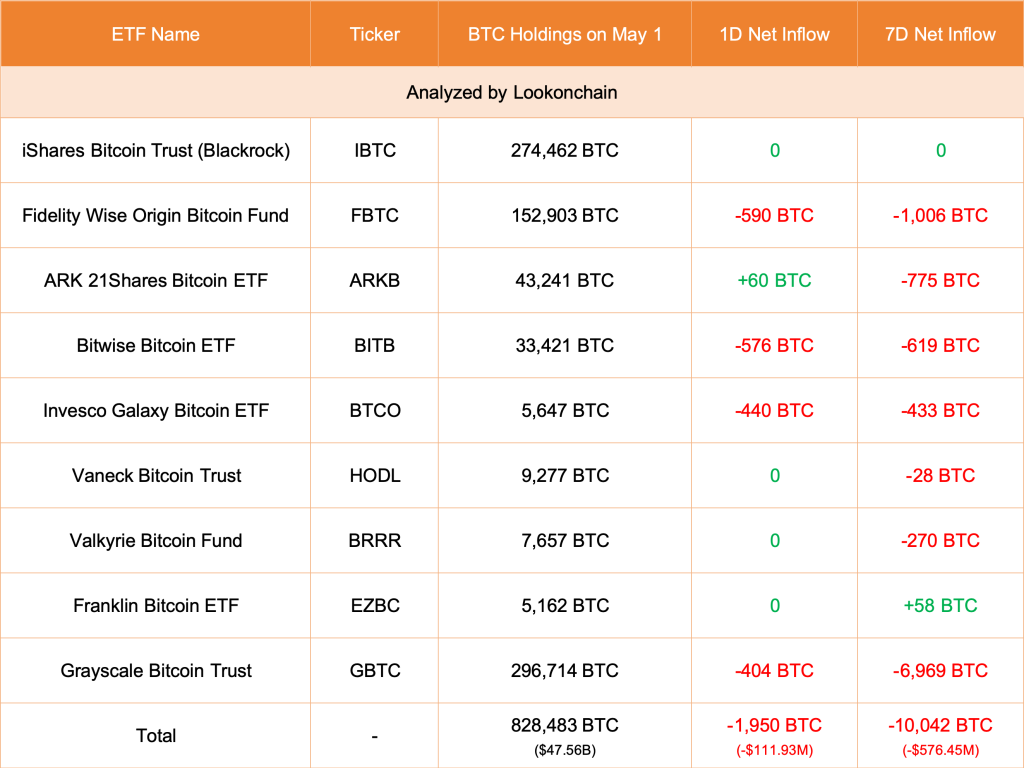
According to Lookonchain data, inflow into the eight-spot Bitcoin ETFs, including BlackRock, has stalled. On May 1, all issuers, including Grayscale via GBTC, decreased by 1,950 BTC. Of note is that BlackRock’s IBIT has not seen inflows for five straight days.
Still, confidence abounds. Inflows into spot Bitcoin ETFs are highly influenced by sentiment, which rests on how prices perform. If BTC shakes off the current weakness and tears higher in the expected post-Halving rally, spot ETF issuers will begin receiving new inflows.
Bitcoin Can Reach $140,000 After This Rare Signal Prints: Analyst
Bitcoin may be hovering below its all-time highs, but analysts are turning bullish based on a rare chart formation. Taking to X, the analyst observed that BTC has closed two consecutive months above the upper Bollinger Band on the monthly chart.
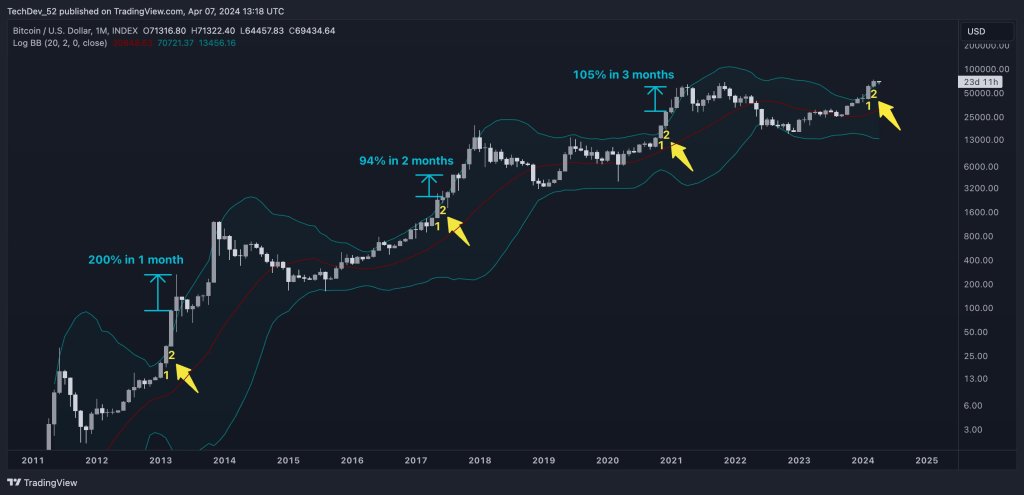
A Rare Bollinger Band Signal Prints: BTC To 0,000?
The analyst said that historically, when Bitcoin closes two consecutive months above the upper Bollinger Band on the monthly chart, prices tend to double within three months. If this pattern holds, Bitcoin will surge to over 0,000 by July 2024, just three months after the Bitcoin halving event.
Bitcoin is trading below ,800, the all-time high registered in March 2024. However, after weeks of lower lows, the sharp recovery earlier on April 8 suggests buyers could be flowing back. At press time, the coin is changing hands above ,800, convincingly breaking above the liquidation level of around ,000.
Despite the bullish breakout, whether the uptrend continues remains to be seen. Of note is that BTC prices tend to collapse before the Halving, which is set to take place in the coming weeks, dumping to as low as 20%. BTC fell after peaking at ,800, dropping to around the ,000 level before snapping back higher to current levels.
A refreshing close above ,000 might form the basis of even more gains in the days ahead, perhaps towards 0,000 in the weeks ahead.
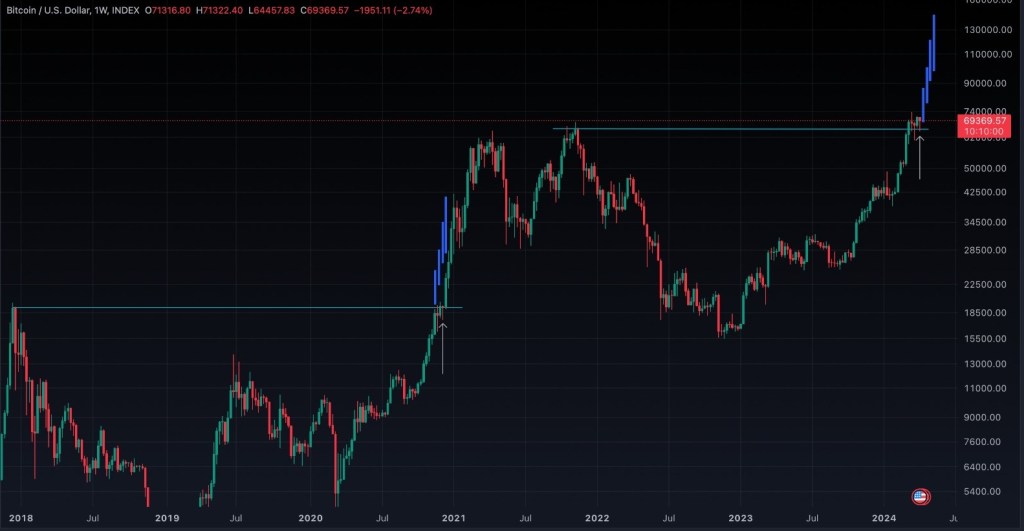
Another analyst suggests that Bitcoin could rally to 0,000 within four weeks, especially if it follows a similar price pattern to December 2020. After breaking above the ,000 high of 2017, Bitcoin continued to rally, peaking at around ,000 for a nearly 3X surge.
Currently, buyers are eyeing the ,000 mark and the all-time high. If this level is surpassed, as it was in late 2020, the possibility of Bitcoin at least doubling to 0,000 becomes more likely.
Will Halving, Macroeconomic Factors, And Spot ETFs Drive Prices?
The current bullish sentiment might continue. Possible drivers include interest in spot Bitcoin exchange-traded funds (ETFs). So far, billions have been channeled to these products, lifting demand and thus prices. The upcoming Halving event could further buoy demand, lifting prices even higher in the coming months.
Beyond Bitcoin-driven fundamentals, analysts are also looking at market events, especially in the United States. Some speculate that the United States Federal Reserve (Fed) might not slash interest by at least three times this year as labor conditions become firm and inflation slows down.
If the Fed reduces interest rates, reversing their hawkish outlook, BTC could lead other safe havens in an uptrend.
Shiba Inu Prints Rare Bullish Signal, Eyes This Price Target
Since the Shiba Inu (SHIB) reached a local high of .00001193 on December 16 last year, the price has been in a downtrend characterized by a series of lower highs and lower lows. However, renowned crypto analyst Ali Martinez has now discovered a rare bullish signal that could end this trend.
Shiba Inu Price Flashes Rare Bullish Signal
A recent analysis by Martinez (@ali_charts) indicates a potential bullish movement for Shiba Inu (SHIB) based on the TD Sequential indicator. Martinez’s chart, shared via X (formerly Twitter), shows SHIB in a 3-day timeframe against Tether (USDT) on the Binance exchange.
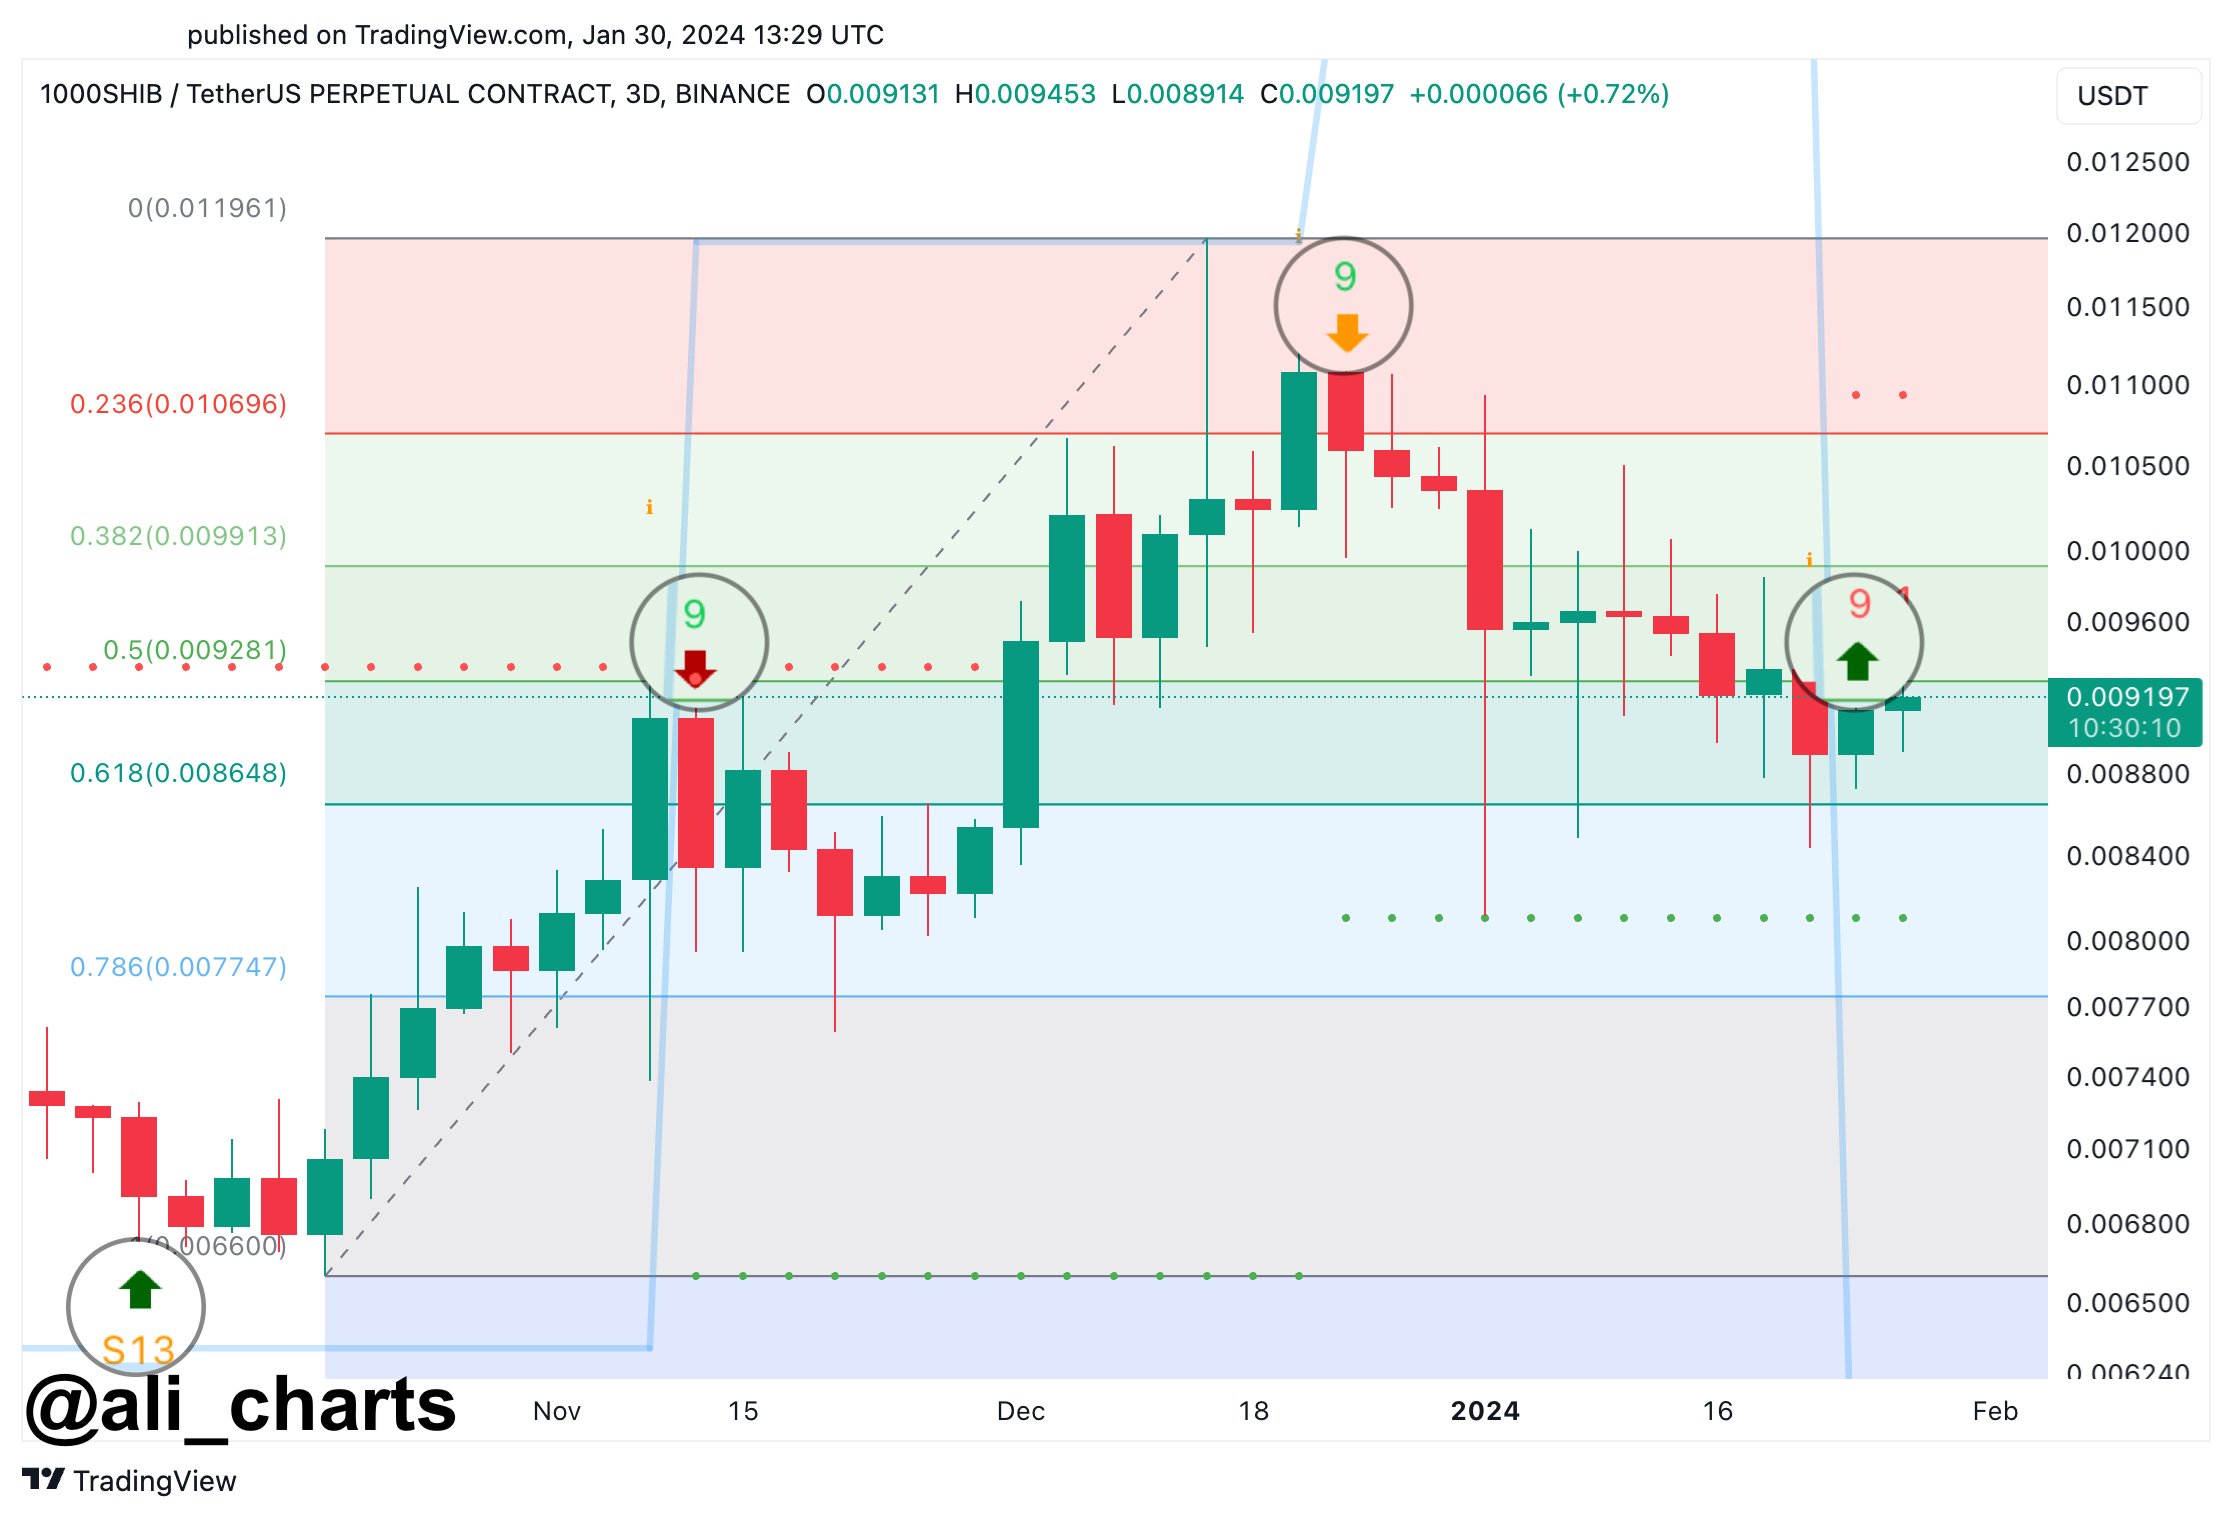
The TD Sequential indicator is a tool used to identify potential price points where an asset’s price is likely to experience an inflection – either a reversal or a continuation of the current trend. On Martinez’s chart, the indicator has presented a “buy signal,” specifically showing a green nine. This suggests the possibility that the current bearish trend could pause, and a bullish trend may ensue.
The chart exhibits a series of green and red candlesticks representing the price movements of SHIB over time. Green candlesticks indicate periods where the closing price was higher than the opening price, while red candlesticks show the opposite. The presence of a green nine suggests that after a succession of price declines over nine periods, the trend may be exhausted, and buyers may soon enter the market.
Martinez points out that the SHIB price is currently hovering around a Fibonacci retracement level of 0.5, at approximately .009281. Fibonacci retracement levels are horizontal lines that indicate where possible support and resistance levels might be located.
These are critical because they can indicate areas where the price of an asset may experience pullbacks or continuations. The chart also shows Fibonacci retracement levels at 0.236 (.010696), 0.382 (.009913), 0.618 (.008648), and 0.786 (.007747).
The chart analysis by Martinez highlights the potential for SHIB to rise to the .010 mark or even extend gains toward .011. These price levels are significant as they align with the 0.236 and 0.382 Fibonacci retracement levels, respectively, which may act as resistance points. A breach above these levels could validate the bullish signal provided by the TD Sequential indicator.
Marinez stated, “The TD Sequential indicator has proven remarkably precise in predicting Shiba Inu price movements. Currently, it’s flashing a buy signal, hinting that SHIB could be gearing up for an upswing. Keep an eye out, as SHIB could climb to .010 or potentially even reach .011!”
More Confirmation Needed
As the crypto market watches closely, the bullish signal for Shiba Inu at this juncture is noteworthy. However, as with any market prediction, it’s important to note that technical indicators are not infallible and should be considered as part of a broader strategy that includes fundamental analysis, market sentiment, and other technical indicators.
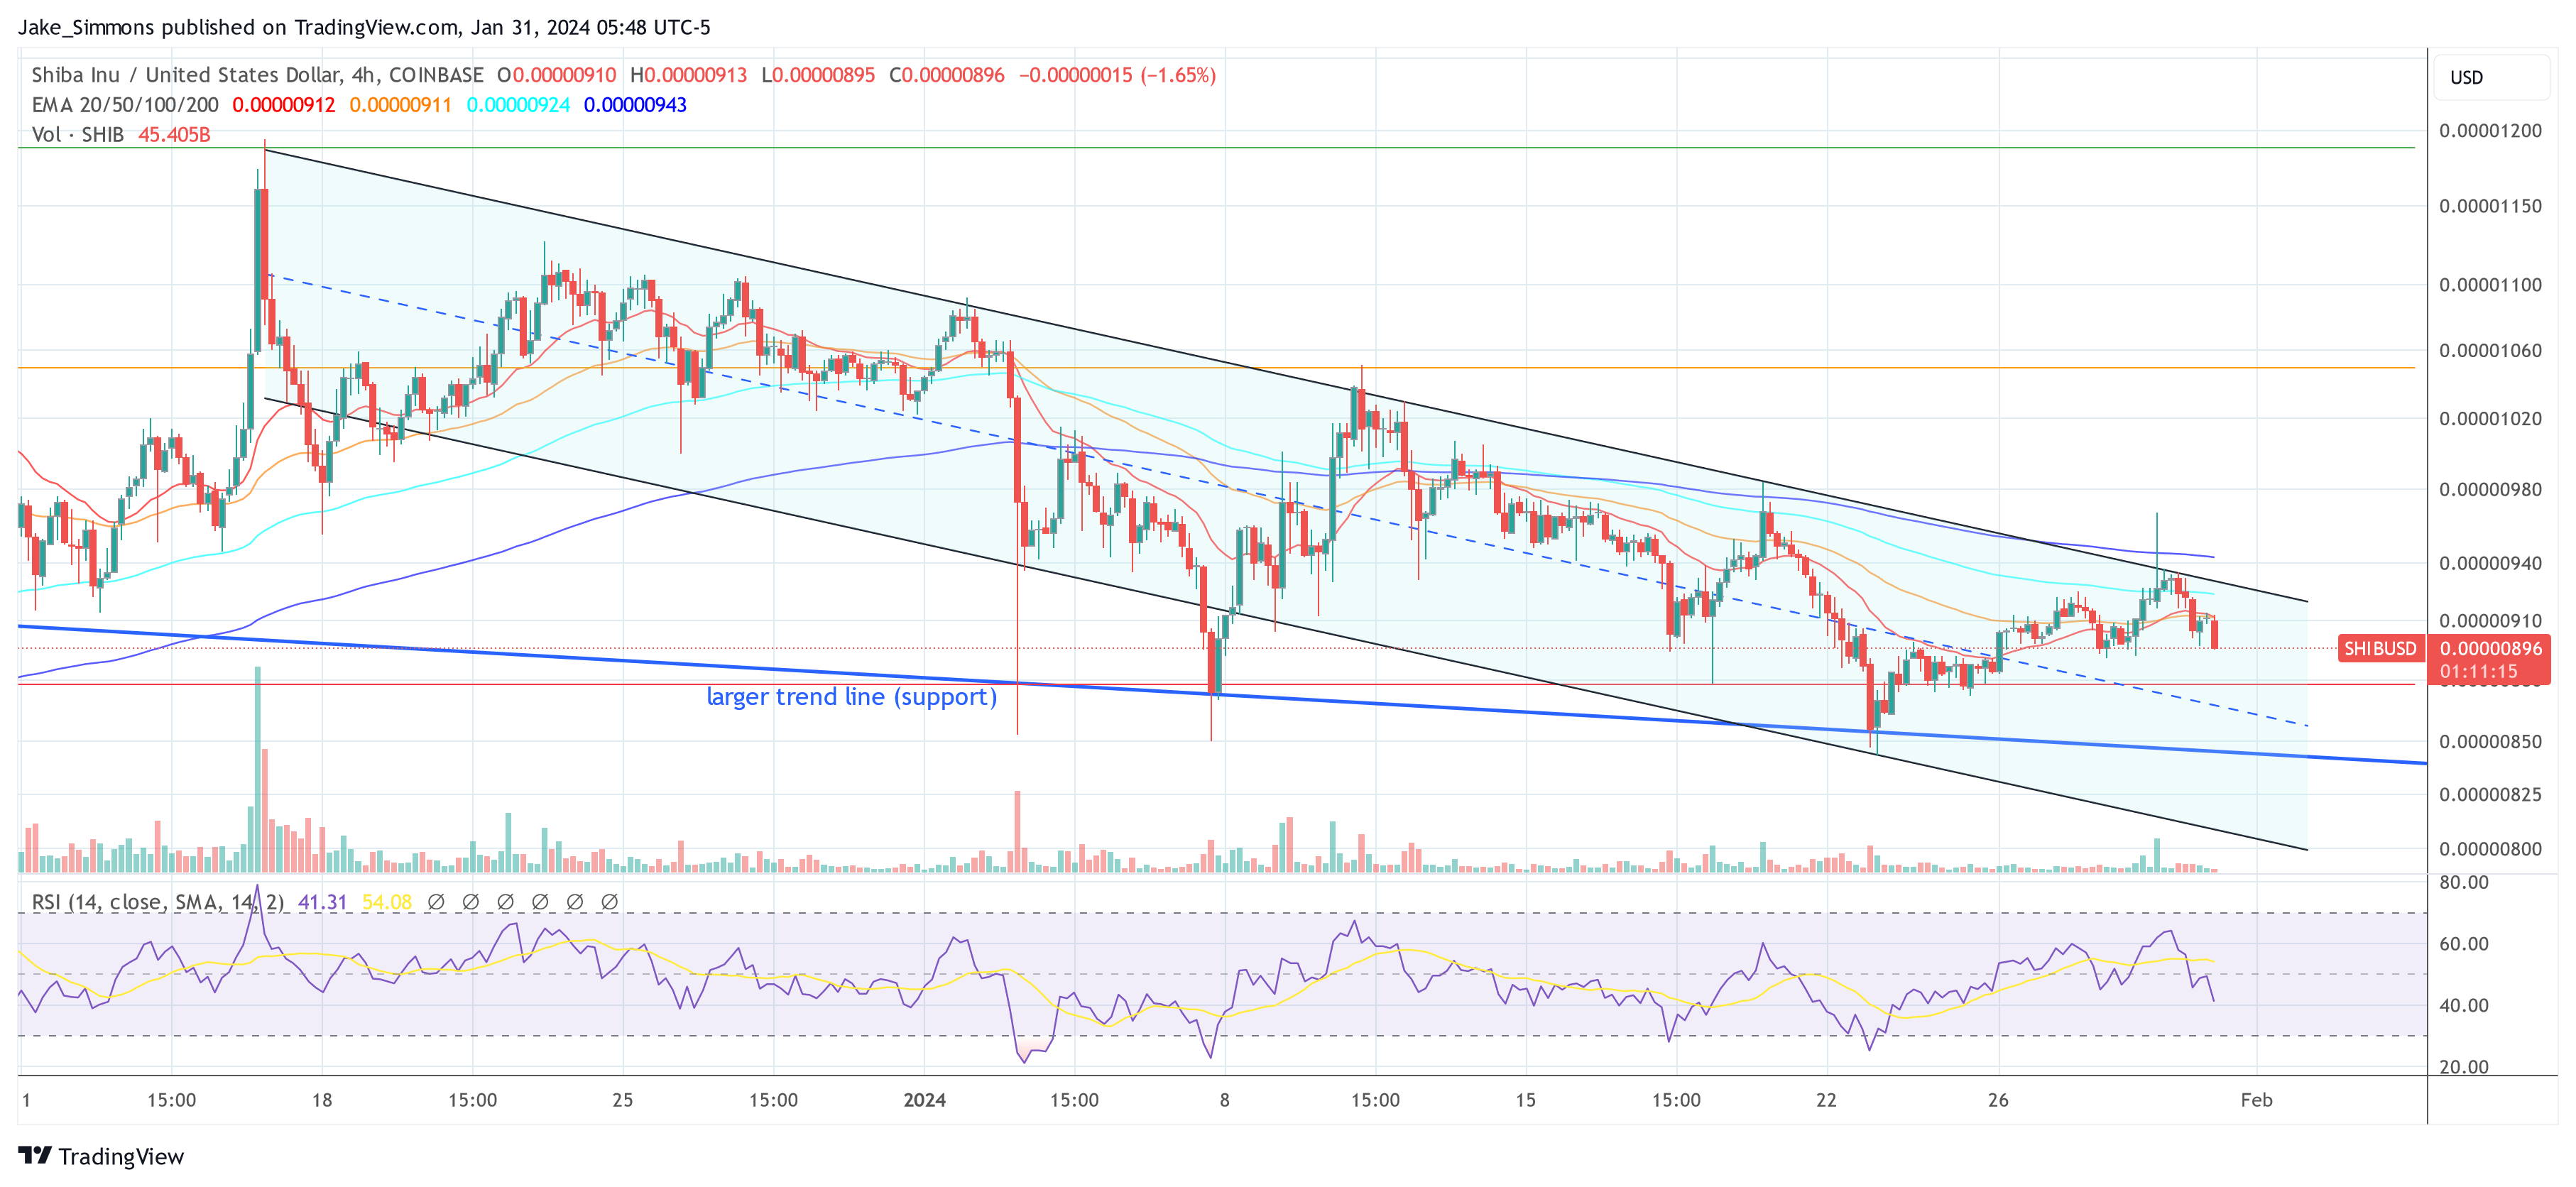
A look at the 4-hour chart of SHIB/USD shows that the price is still in a descending parallel trend channel. Yesterday, Tuesday, the Shiba Inu price was again rejected at the top of the trend channel. A breakout (at around .00000930) could be crucial to reinforce the TD9 signal.
SEC Makes ‘Rare’ Calls to Spot Bitcoin ETF Applicants — Analyst Says ‘Good Sign’ for January 10 Approval

The U.S. Securities and Exchange Commission (SEC) has reportedly made “rare” calls to spot bitcoin exchange-traded fund (ETF) issuers and exchanges regarding their applications. A Bloomberg ETF analyst views this development as a “good sign” for the expected approvals by Jan. 10. The securities regulator has insisted on the cash creation model, rather than the in-kind model, for spot bitcoin ETFs.
SEC’s ‘Rare’ Calls Regarding Spot Bitcoin ETFs
The U.S. Securities and Exchange Commission (SEC) actively held meetings with spot bitcoin exchange-traded fund (ETF) applicants this week. Blackrock, the world’s largest asset manager, and several other spot bitcoin ETF applicants met with the securities watchdog on Thursday, according to filings with the SEC.
Moreover, Fox Business Network’s senior correspondent, Charles Gasparino, shared on social media platform X Thursday that the SEC is “having what’s described as a rare joint conference call with prospective spot BTC ETF filers, as its closely watched decision looms on whether to give these companies the green light to sell to small investors access to crypto.” Fox Business reported a day prior that “the decision is coming by Jan 10.”
Referencing this “rare joint conference,” Bloomberg ETF analyst Eric Balchunas stated on X:
We [are] hearing it wasn’t one giant conf call b/t SEC and every issuer but rather many calls to exchanges/issuers to reiterate that its cash creates or you will wait.
The analyst views this development as interesting and a “good sign” for the expected spot bitcoin ETF approvals by Jan. 10. He has maintained that there is a 90% chance of approval by that date.
While many spot bitcoin ETF issuers prefer to use the in-kind creation model, the SEC prefers the cash creation model. Blackrock, the world’s largest asset manager, recently amended its spot bitcoin ETF filing to adopt the cash creation model.
Balchunas detailed on Wednesday, referencing Gasparino: “SEC worried about money laundering via in-kind creations in a spot bitcoin ETF, this is why they so dug in on cash creates only (which is a much more closed system).” The Fox Business correspondent shared on X: “Firms believe the SEC will rule after Jan 8; they feel confident the SEC will approve but with a twist; unlike normal ETFs, you can only purchase shares with cash; SEC worried about ETFs being used as a vehicle for money laundering.”
Another Bloomberg analyst, James Seyffart, wrote on X:
We still think this is happening by Jan 10. Some issuers may be left behind … base case I’m expecting approvals Jan 8-10.
What do you think about the SEC making rare calls to spot bitcoin ETF applicants? Do you think the regulator will approve these filings by Jan. 10? Let us know in the comments section below.
Rare Signal Predicts Next XRP Price Move: Crypto Analyst
The XRP price has been treading water in recent days. After XRP rose by more than 52% in just 18 days from mid-October to early November, the price is currently in a clear consolidation phase in the shorter time frames. However, a look at the 1-month chart of the XRP/USD trading pair shows that the XRP price has exhibited strong bullish months.
In this sense, Crypto analyst Egrag has drawn attention to an extremely rare phenomenon in the XRP monthly price chart. The pattern in question is a series of three consecutive monthly green candles, which have only been documented twice in the history of the cryptocurrency.
As the market approaches the monthly close today, a confirmation by a close above .5987 could mean the third monthly green candle for XRP. “Get ready—within the next [few] hours, we’re poised to seal another trio of consecutive green candles,” Egrag noted.
Here’s What This Could Mean For XRP Price
Delving into the specifics, Egrag elucidates two distinct historical precedents post such formations. In the first scenario, a 5-month consolidation phase was observed after XRP recorded three consecutive green candles from March to May 2017.
However, the consolidation phase had an extremely bullish effect. After it ended, the XRP price experienced a staggering 1,500% surge within just two months. Egrag suggests that if XRP’s price action were to emulate this historical pattern, investors can anticipate a potential surge to , starting from the 1st of April 2024.
The second instance Egrag refers to the period from December 2015 to February 2016. During this time, the price rose by approximately 102% in three consecutive green months. What followed was a lengthier 12-month consolidation phase. But the wait was worth it again.
In March 2018, the XRP price started an extraordinary 8,000% rally. A replication of this scenario would imply a potential skyrocketing of XRP’s price to , beginning on the 1st of November 2024.
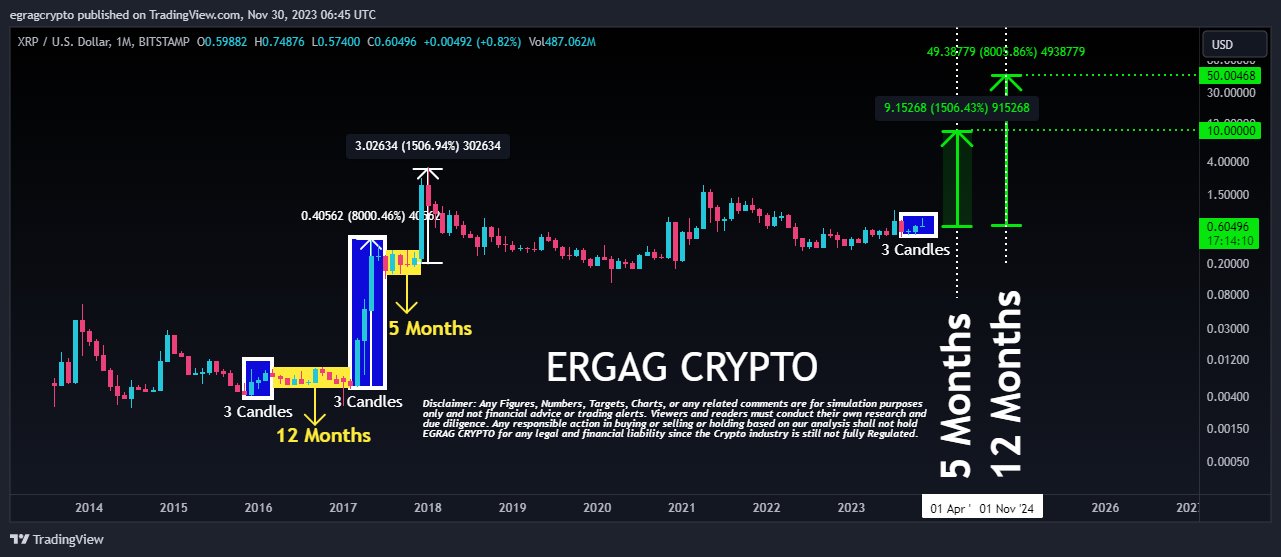
Notably, Egrag offers an average price target standing at . He stated, “XRP army stay steady, the average of these two targets lands at , you know that I always whisper to you my secret target of . Hallelujah, the anticipation is palpable!”
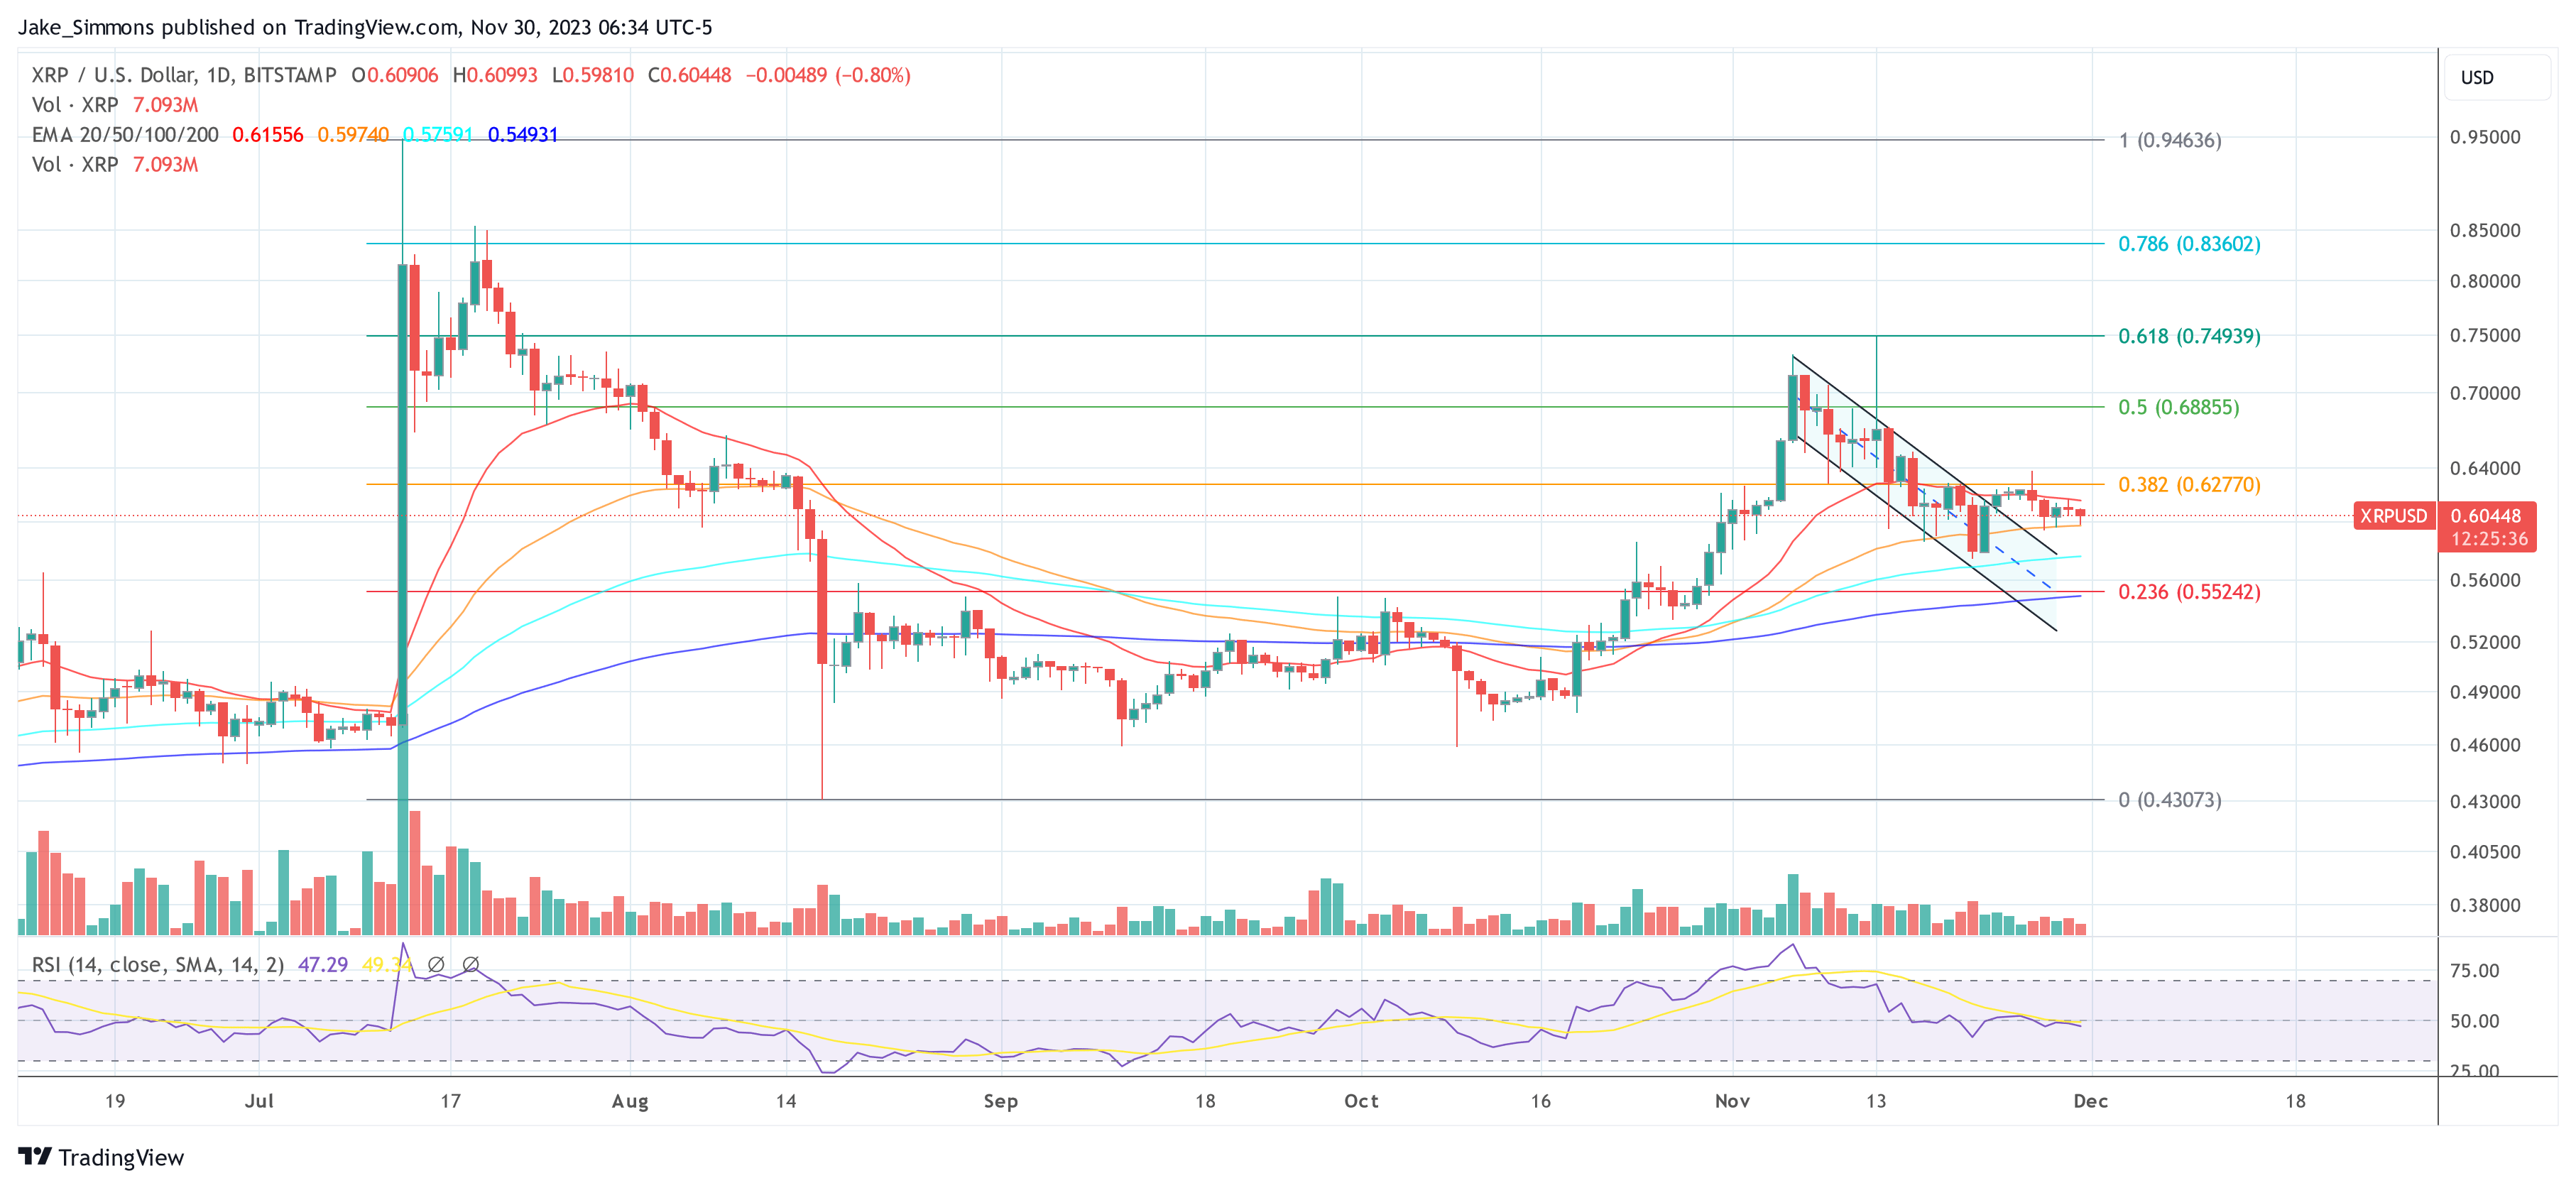
Price Analysis: 1-Day Chart
At press time, XRP was trading at .60333. A week ago, the price managed to break out of a downtrend channel. However, the bullish momentum quickly fizzled out after the price was rejected at the 0.382 Fibonacci retracement level at .627.
Related Reading: Bitcoin Decouples with XRP, BNB But Correlates With Dogecoin and Cardano
For four days now, the XRP price has been squeezed into a tight range between the 20-day and 50-day EMA (Exponential Moving Average), with a breakout to the downside or upside getting closer and closer. In the event of an upside breakout, the price level at .627 would be decisive. Then, the price could tackle the 0.5 Fibonacci retracement level at .688.
However, if a breakout to the downside happens, a 100-day EMA at .575 would be the first support. This must hold to prevent the price from falling towards the 0.236 Fibonacci retracement level at .552, which is also close to the 200-day EMA. The convergence of both indicators signifies a price level that the bulls must defend at all costs.
November Marks Rare Awakening of 2 Vintage 2010 Bitcoin Wallets Valued at $3.4 Million

Bitcoin has surged over 24% against the U.S. dollar this month, and on November 7, 2023, an intriguing event took place: two dormant bitcoin addresses from 2010 were activated and transferred roughly 100 BTC, valued at .4 million according to the current bitcoin exchange rates. While 100 BTC may not be a staggering amount, these two transactions represent the 11th instance of dormant bitcoin wallets from 2010 reawakening in 2023, marking a significant decrease in frequency compared to past years.
2 Bitcoin Wallets From 2010 Spring to Life With .4 Million Transfer
On November 7, 2023, a ripple in the digital realm occurred as two ancient bitcoin addresses, created in the nascent stages of the crypto economy back in 2010, broke over a decade of inactivity. The two 2010 spends were discovered by btcparser.com. The initial transfer was executed at block height 815,655, with the wallet labeled “1BNE4” channeling 50 BTC to another legacy address. This wallet first came into existence on July 9, 2010, aging over 13 years before its first spend.
The transaction achieved a modest level of anonymity, scoring an 81 out of 100 on Blockchair’s privacy scale. Despite this, the transaction was not completely covert, exhibiting issues such as matched inputs and outputs and co-spending indicators. A second transaction, at the same block height, saw an equal amount of 50 BTC being moved from a wallet that began its digital life on May 21, 2010. Notably, the “1CNJv” wallet followed the “1BNE4” wallet in directing funds to identical outputs.
Following the euphoric heights of the bitcoin bull run ending in 2021, the frequency of movements from dormant 2010 bitcoin wallets has declined sharply. During the peak years of 2020 and 2021, a particular whale unleashed several waves of 20 consecutive transfers, each carrying block rewards, amounting to massive 1,000 BTC batches. Contrastingly, in the current year, while there has been a noticeable number of dormant 2011 bitcoin transactions, 2012 has asserted its presence even more conspicuously.
Nevertheless, 2010 wallet activities this year have been rare, with only 11 surfacing in 2023. The sequence began on February 1, followed by the next on March 20, and the subsequent third and fourth 2010 transactions on May 22. The series of vintage 2010 spending continued with the fifth on June 15, the sixth and seventh on June 26, the eighth transaction on July 24, the ninth on August 14, with the most recent, the tenth and eleventh transactions, awakening on Tuesday morning.
What do you think about the two sleeping bitcoin addresses waking up after 13 years to transfer 100 bitcoin? Share your thoughts and opinions about this subject in the comments section below.
Shiba Inu Price Prints Rare Buy Signal, What You Need To Know
Amid the bullish sentiment in the crypto market, Shiba Inu (SHIB) has recently garnered significant attention from traders and investors. A recent analysis by renowned crypto analyst Ali Martinez has spotlighted a rare buy signal for the token, potentially hinting at an upward trajectory for its price.
Buy Shiba Inu Now?
For those not familiar, the TD Sequential is an indicator used by traders to identify potential price patterns and reversals. Developed by Tom DeMark, the TD Sequential is a series of numbers and letters that represent specific counts on a price chart.
When the count reaches a ‘9’ (TD9), it typically suggests a potential reversal in the market’s current trend, whether bullish or bearish. Its utility in predicting market turns has made it a staple in many traders’ toolkits, especially in the realm of cryptocurrencies.
Ali Martinez, in a recent tweet, pointed out that the TD Sequential has flashed a buy signal on the Shiba Inu’s weekly chart. Such an occurrence isn’t just significant due to the potential for a bullish turn but also because of the infrequency of these signals.
Historical data analysis reveals that in the last two instances when such a buy signal manifested, the SHIB price surged by 118% and 71%, respectively. These past performances, while no guarantee of future results, do provide a tantalizing backdrop to the current scenario.
Martinez stated:
The TD Sequential flashed a buy signal on [the] SHIB weekly chart. Notably, the previous two bullish turns from this indicator led to price surges of 118% and 71%, respectively. Given the infrequency yet precision of such signals, it’s a pivotal moment to keep a keen eye on SHIB.
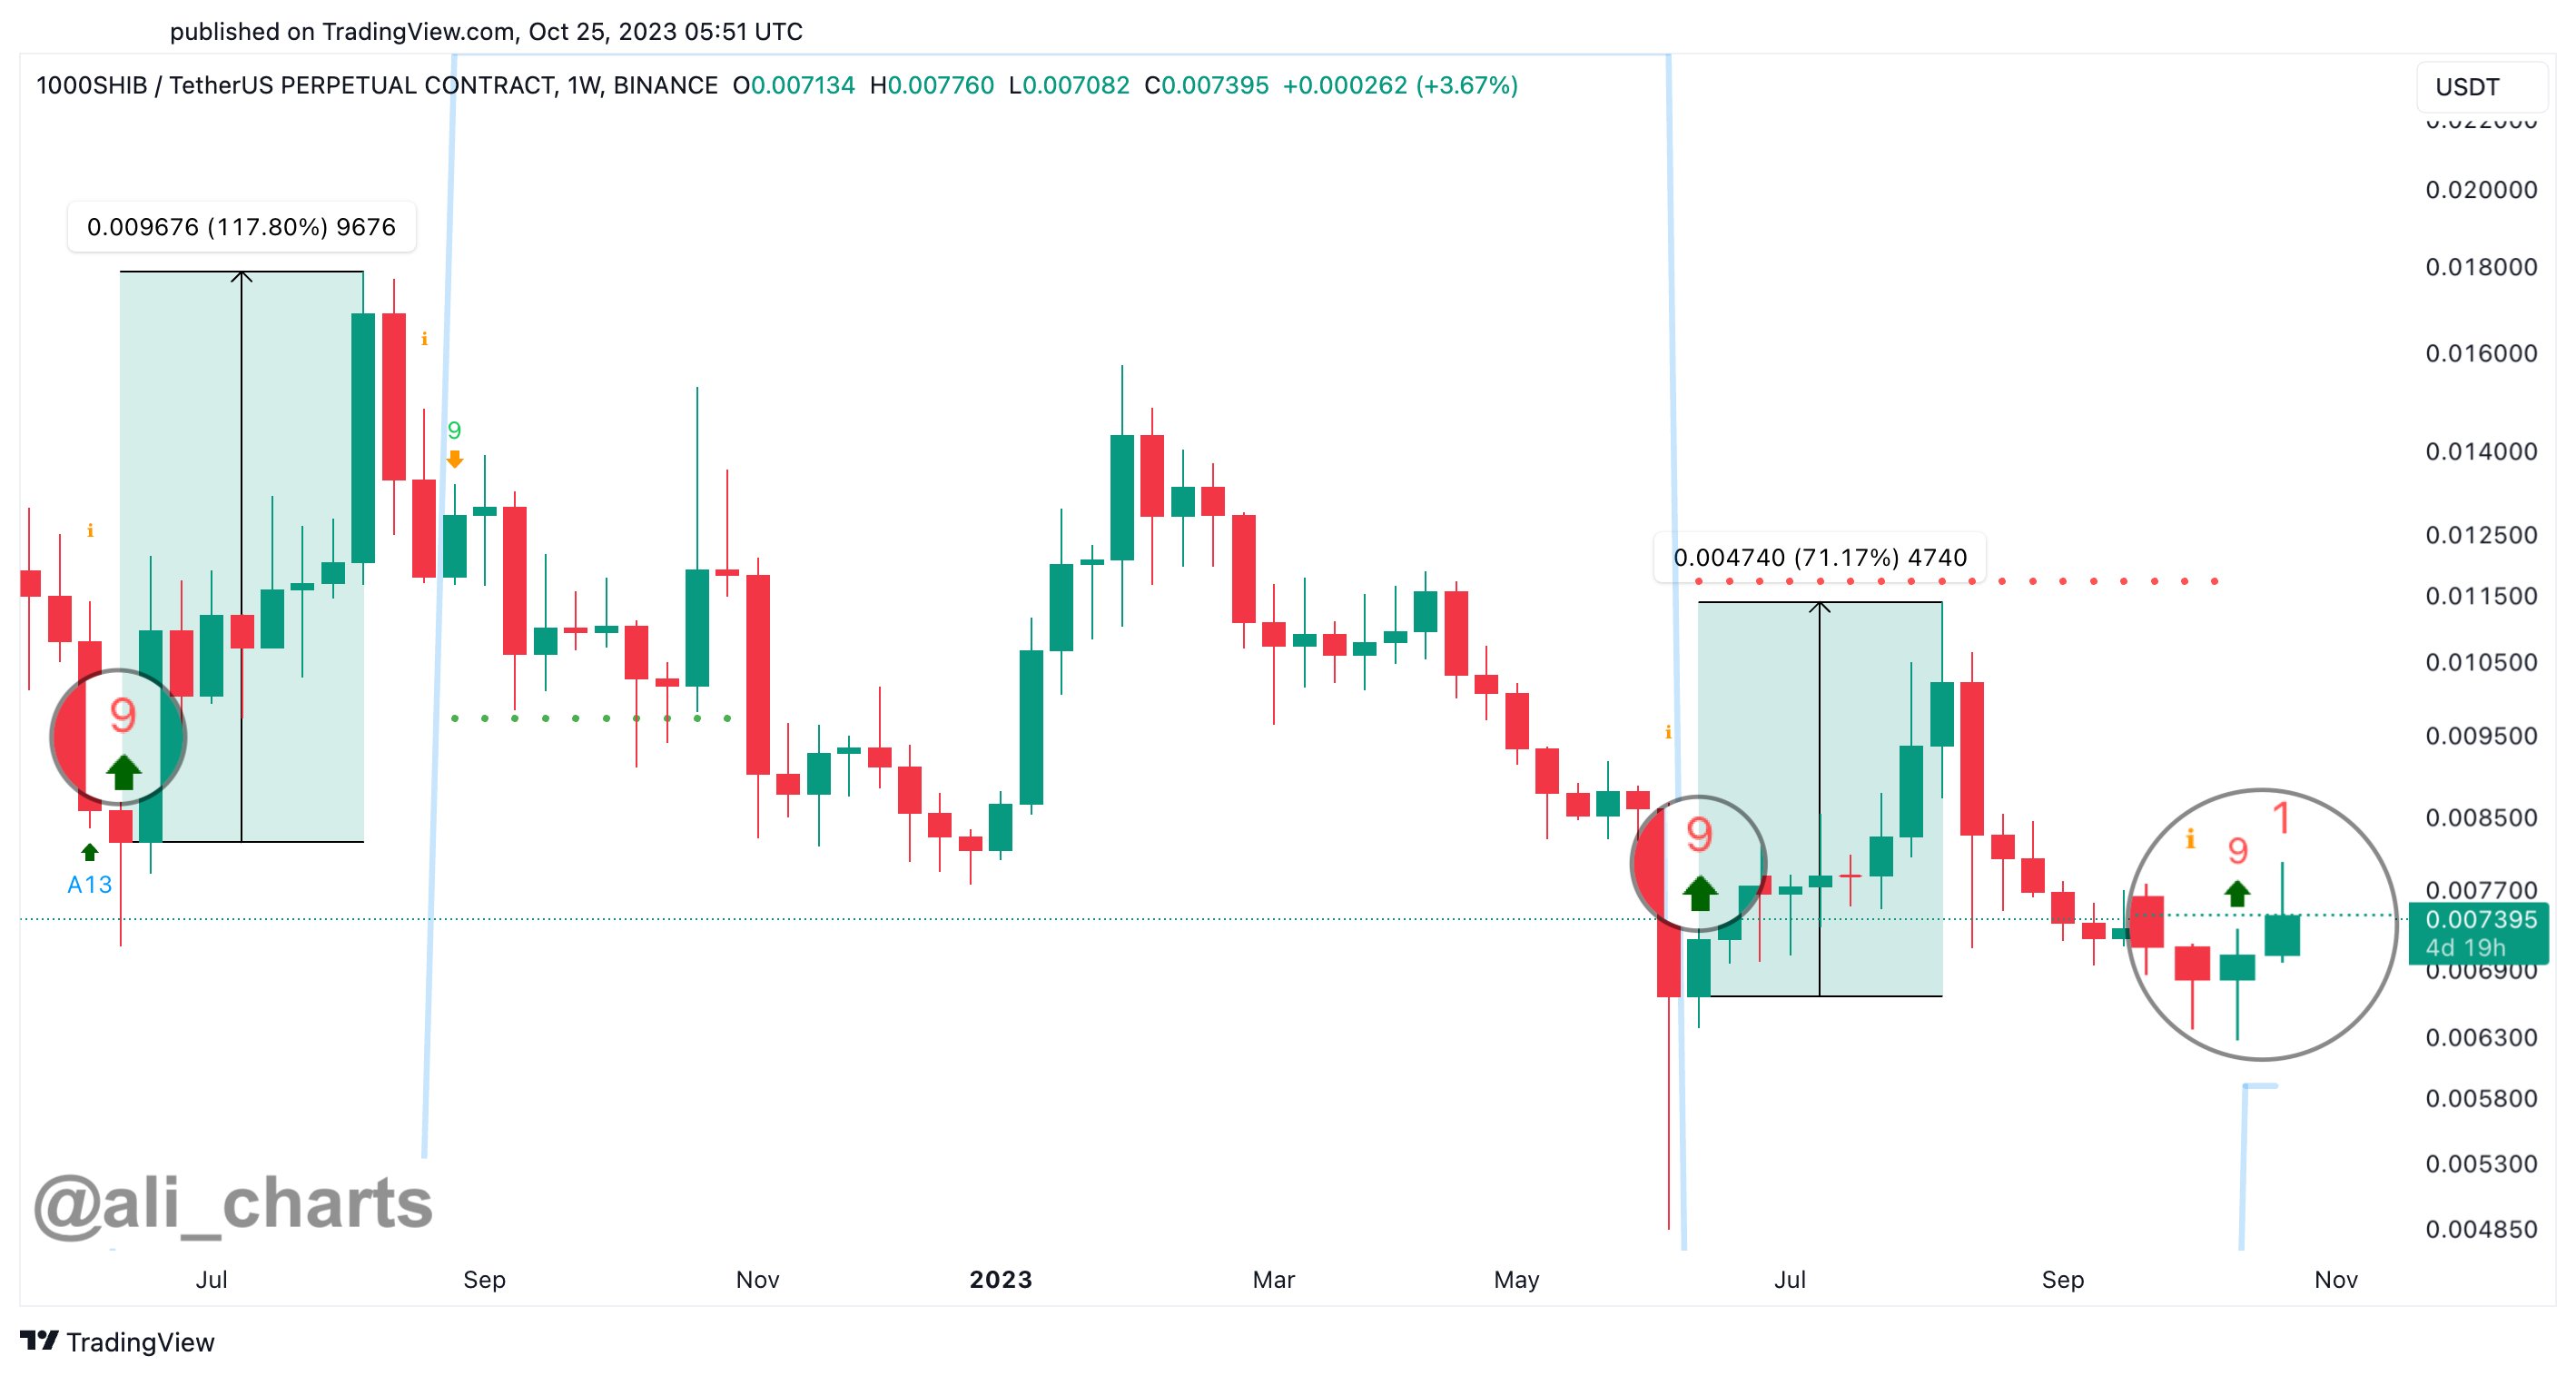
The TradingView chart, shared by Martinez, outlines the SHIB/TetherUS (USDT) Perpetual Contract on the Binance platform. It shows that back in June 2022, Shiba Inu recorded an impressive surge of approximately 117.80% within eight weeks. This rally was preceded by a ‘9’ candlestick on the TD Sequential indicator, hinting at the buy setup.
In late September 2023, another TD Sequential ‘9’ buy signal emerged, resulting in a 71.17% ascent in SHIB’s value within the subsequent nine weeks. As of October 25, 2023, yet another ‘9’ buy setup has manifested on the weekly time frame. Given the token’s historical reaction to these setups, a bullish move seems likely.
However, while the TD Sequential is a respected tool, it’s worth noting that all indicators should be used in conjunction with other tools and analysis methods. The volatile nature of the crypto market means that predictions, even when based on historically successful indicators, come with inherent risks.
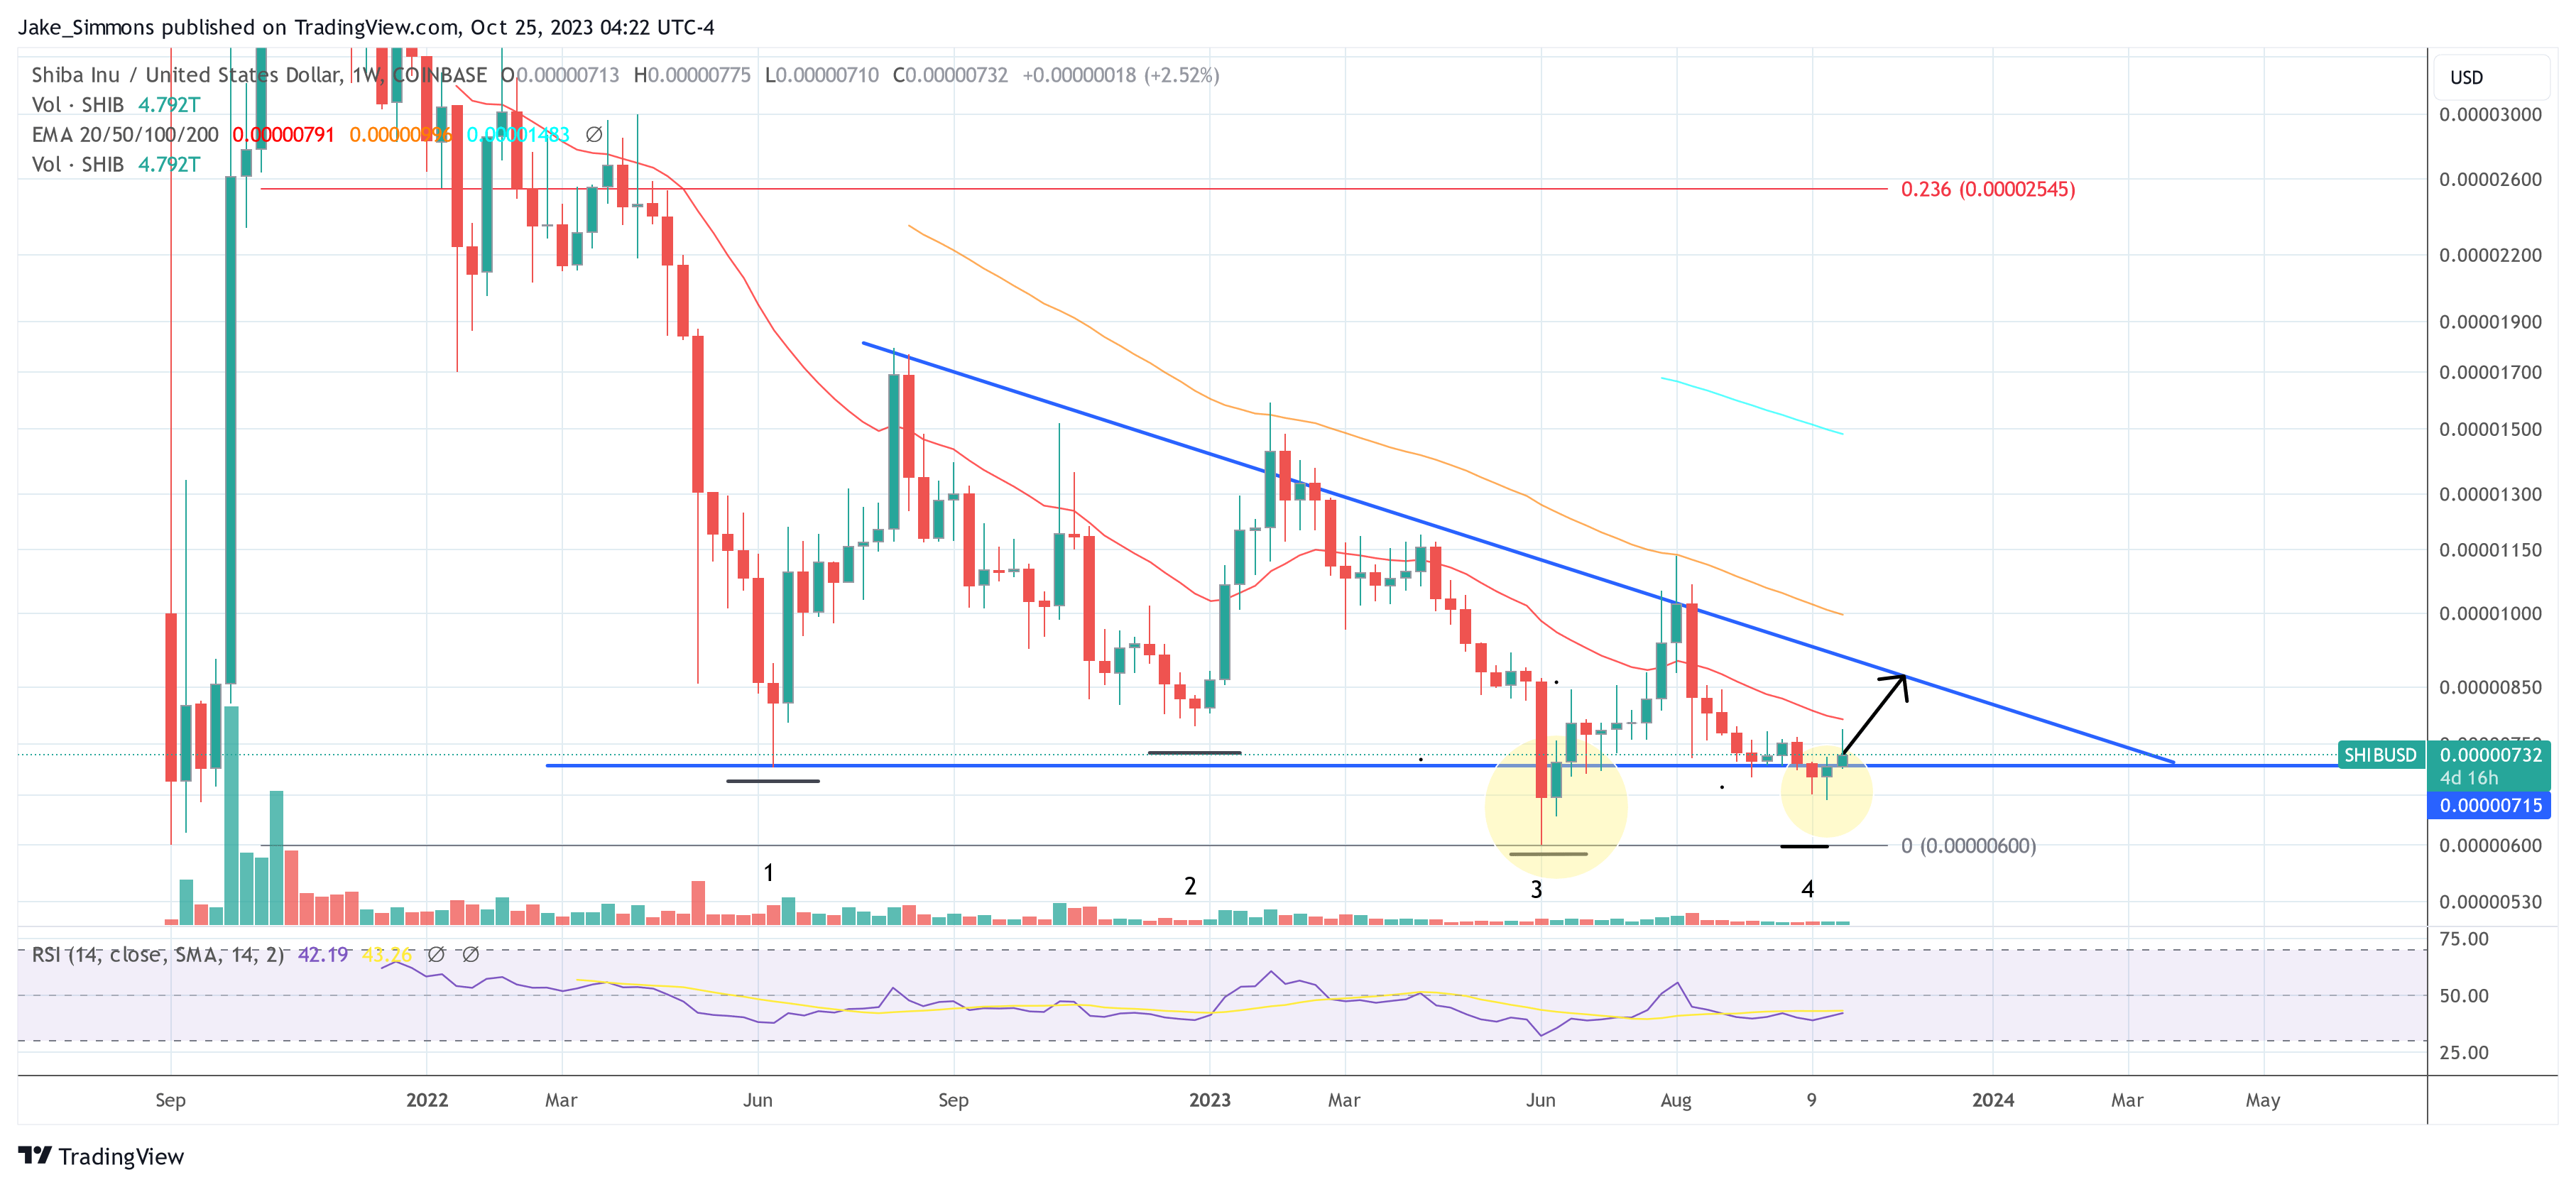
A Consistent Signal
At press time, the Shiba Inu price was trading at .00000732 and has thus managed to recapture the neckline of the descending triangle in the weekly chart. As detailed in earlier analysis, SHIB was in a make-or-break moment in the last two weeks. However, since SHIB was able to bounce above the neckline, the bullish scenario has now come to the fore.
As was the case from June to early August 2022 after the formation of the third bottom (yellow circle), SHIB could now rally again towards the descending trend line of the triangle as a result of the fourth bottom (second yellow circle).
Thus, the TD9 signal and this technical pattern coincide. As then, however, a new decisive moment would come for the Shiba Inu price – the battle to break out of a more than 2-year downtrend.