 Gazzy Garcia, also known as Lil Pump, his professional rapper name, surprised his over 15 million followers on Instagram and X by posting pictures showing two new Solana-themed tattoos. The first featured the stylized name of the Solana blockchain on his forehead, while the second depicted the logo of one of the most popular Solana […]
Bitcoin News
Bitcoin Price Approaches Breakout, Can BTC Pump Above $66K?
Bitcoin price recovered and climbed above the ,000 resistance zone. BTC is now facing hurdles near the ,500 and ,000 levels.
- Bitcoin is now struggling to gain pace for a move above the ,500 resistance zone.
- The price is trading above ,000 and the 100 hourly Simple moving average.
- There is a key contracting triangle forming with resistance at ,100 on the hourly chart of the BTC/USD pair (data feed from Kraken).
- The pair could start a fresh surge if it clears the ,500 resistance zone.
Bitcoin Price Starts Increase
Bitcoin price found support above ,000 and started a fresh increase. BTC climbed above the ,500 and ,500 resistance levels. The bulls even pushed the price above the ,000 level.
However, the bears seem to be active near the ,500 zone. The recent high was formed at ,598 and the price is now consolidating gains. There was a drop below the ,000 level, but the price is still above the 23.6% Fib retracement level of the upward move from the ,666 swing low to the ,598 low.
Bitcoin price is trading above ,000 and the 100 hourly Simple moving average. Immediate resistance is near the ,100 level. There is also a key contracting triangle forming with resistance at ,100 on the hourly chart of the BTC/USD pair.
The first major resistance could be ,500. The next resistance now sits at ,000. If there is a clear move above the ,000 resistance zone, the price could continue to move up. In the stated case, the price could rise toward ,500.
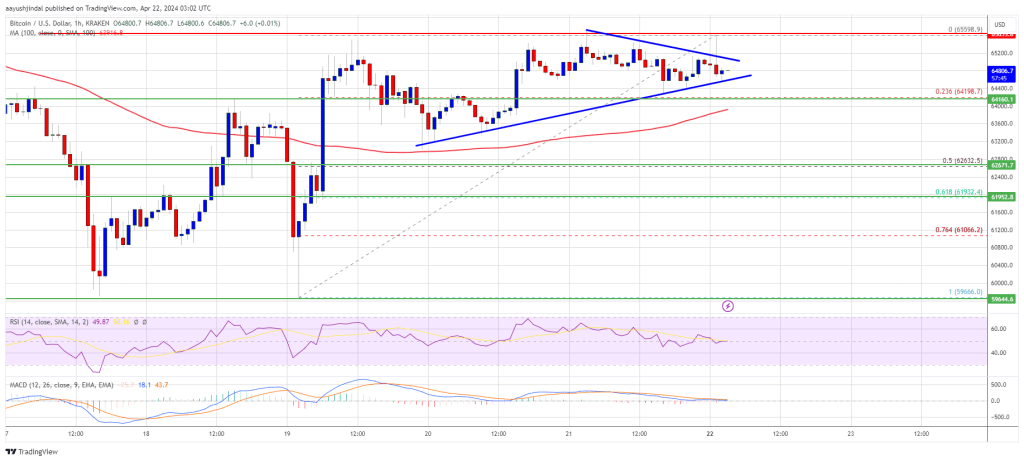
Source: BTCUSD on TradingView.com
The next major resistance is near the ,500 zone. Any more gains might send Bitcoin toward the ,000 resistance zone in the near term.
Downside Correction In BTC?
If Bitcoin fails to rise above the ,500 resistance zone, it could start a downside correction. Immediate support on the downside is near the ,500 level.
The first major support is ,000. If there is a close below ,000, the price could start to drop toward the 50% Fib retracement level of the upward move from the ,666 swing low to the ,598 low at ,500. Any more losses might send the price toward the ,200 support zone in the near term.
Technical indicators:
Hourly MACD – The MACD is now losing pace in the bullish zone.
Hourly RSI (Relative Strength Index) – The RSI for BTC/USD is now near the 50 level.
Major Support Levels – ,500, followed by ,000.
Major Resistance Levels – ,100, ,500, and ,000.
SOL Price Dump and Pump, Can Solana Overcome Selling Pressure?
Solana tumbled and declined toward 0. SOL price is now correcting losses above 0 and facing hurdles near the 0 resistance zone.
- SOL price gained bearish momentum and declined below 0 against the US Dollar.
- The price is now trading below 0 and the 100 simple moving average (4 hours).
- There is a key bearish trend line forming with resistance at 0 on the 4-hour chart of the SOL/USD pair (data source from Kraken).
- The pair could continue to recover if it clears the 0 and 0 resistance levels.
Solana Price Starts Recovery
Solana price started a major decline below the 0 and 0 support levels. SOL declined over 20% and even tumbled below the 0 level. Finally, the bulls appeared near 0.
A low was formed at 5.04 and the price is now attempting a recovery wave like Bitcoin and Ethereum. There was a decent increase above the 5 and 2 levels. The price cleared the 23.6% Fib retracement level of the downward move from the 4 swing high to the 5 low.
Solana is now trading below 0 and the 100 simple moving average (4 hours). Immediate resistance is near the 0 level. The next major resistance is near the 0 level.
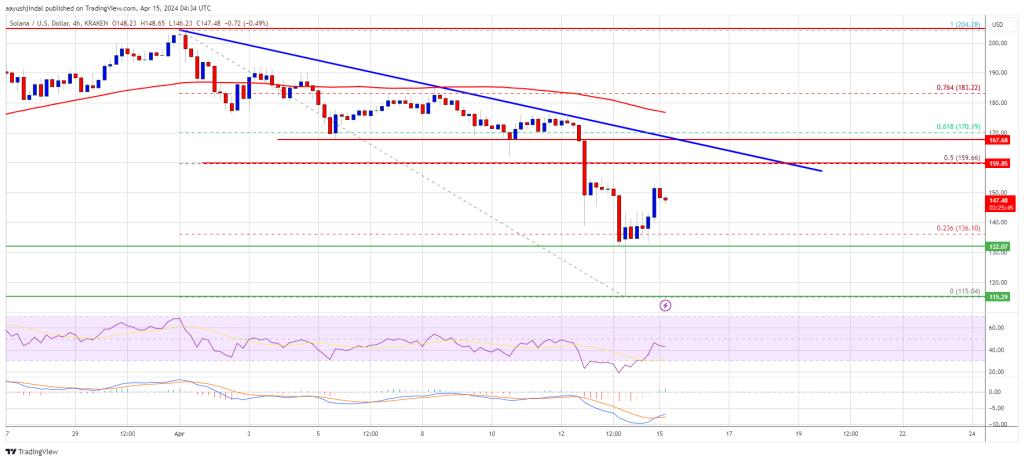
Source: SOLUSD on TradingView.com
There is also a key bearish trend line forming with resistance at 0 on the 4-hour chart of the SOL/USD pair. The trend line is near the 61.8% Fib retracement level of the downward move from the 4 swing high to the 5 low. A successful close above the 0 resistance could set the pace for another major increase. The next key resistance is near 2. Any more gains might send the price toward the 0 level.
Are Dips Supported in SOL?
If SOL fails to rally above the 0 resistance, it could start another decline. Initial support on the downside is near the 0 level.
The first major support is near the 2 level, below which the price could test 5. If there is a close below the 5 support, the price could decline toward the 5 support in the near term.
Technical Indicators
4-Hours MACD – The MACD for SOL/USD is gaining pace in the bullish zone.
4-Hours RSI (Relative Strength Index) – The RSI for SOL/USD is below the 50 level.
Major Support Levels – 0, and 2.
Major Resistance Levels – 0, 0, and 2.
Buying Opportunity: Crypto Institutional Investors Pump $862 Million Into The Market
Crypto investment products are up again in terms of inflows, giving the crypto industry a much-needed breather. Recent market dynamics have seen Bitcoin leading the surge of inflows into crypto investment products, signaling a possible resumption of bullish sentiment.
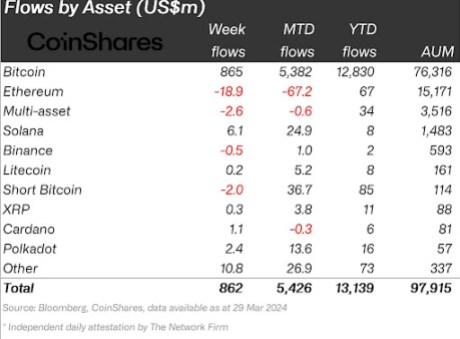
James Butterfill, head of research at Coinshares, reported this inflow in a social media post. The statistics indicate that crypto investment products received inflows of 2 million over the timeframe spanning from March 23 to March 29 to reverse the record net outflows of 2 million set in the prior week. Unsurprisingly, most of the inflow went into Bitcoin, hinting at a potential buying opportunity for investors still waiting to get in on the asset during this bull run.
Institutional Investors Pump 2 Million Into Crypto Market
James Butterfill termed the inflow registered last week as a “recovery for ETFs.” This is rightly so, as these US-based Spot Bitcoin ETFs gave investors a scare in the prior week with lackluster inflow, hinting at the possibility that the bull run could be coming to an end. This led to crypto investment products bleeding for the first time after seven consecutive weeks of inflows.
However, it would seem the sentiment regarding Spot Bitcoin ETFs is now back to a very bullish outlook. As a result, Bitcoin registered 5 million in inflows to bring its year-to-date inflow to .83 billion. On the other hand, Ethereum and multi-asset products registered .9 million and .6 million in outflows, respectively, to offset some of the inflows registered by Bitcoin.
Inflows of .1 million, .2 million, .3 million, .1 million, and .4 million were recorded for Solana, Litecoin, XRP, and Polkadot, respectively. Polkadot also registered an inflow of .4 million. Short Bitcoin products, on the other hand, witnessed outflows of million.
Buying Opportunity For Bitcoin?
Bitcoin’s price surge for the past few months has largely been due to action surrounding Spot Bitcoin ETFs. Interestingly, last week’s inflow activity saw Bitcoin breaking into the ,000 price territory multiple times last week. This bullish momentum wasn’t sustained, allowing the bears to create a resistance at around ,000.
Nevertheless, the inflow indicates something bullish might be brewing behind the scenes. Fundamentals surrounding the crypto point to a bullish price action throughout April, particularly as the next halving approaches.
Bitcoin went through bearish price action over the weekend, correcting by almost 7% from ,285. At the time of writing, Bitcoin has broken below a support at ,500 and is now trading at ,510. According to Santiment, the price dip has given crypto traders a sense of buying opportunity with calls of “buy and bullish” spiking across social media.
Bitcoin Price Consolidates Above $70K, Can Bulls Pump BTC To $75K?
Bitcoin price is consolidating above the ,000 resistance zone. BTC might remain in a range for some time before the bulls attempt a move toward ,000.
- Bitcoin price is struggling to gain pace above the ,500 resistance zone.
- The price is trading above ,500 and the 100 hourly Simple moving average.
- There is a short-term rising channel forming with support at ,750 on the hourly chart of the BTC/USD pair (data feed from Kraken).
- The pair could soon start a fresh rally if it clears the ,500 resistance zone.
Bitcoin Price Remains In Range
Bitcoin price formed a base above the ,000 resistance zone. BTC climbed higher the ,000 resistance zone to move again into a positive zone.
The price broke the ,000 level but the bears were active below the ,500 resistance. The recent high was formed near ,306 and the price is now consolidating gains. It is trading near the 23.6% Fib retracement level of the upward move from the ,128 swing low to the ,306 high.
Bitcoin is now trading above ,500 and the 100 hourly Simple moving average. There is also a short-term rising channel forming with support at ,750 on the hourly chart of the BTC/USD pair.
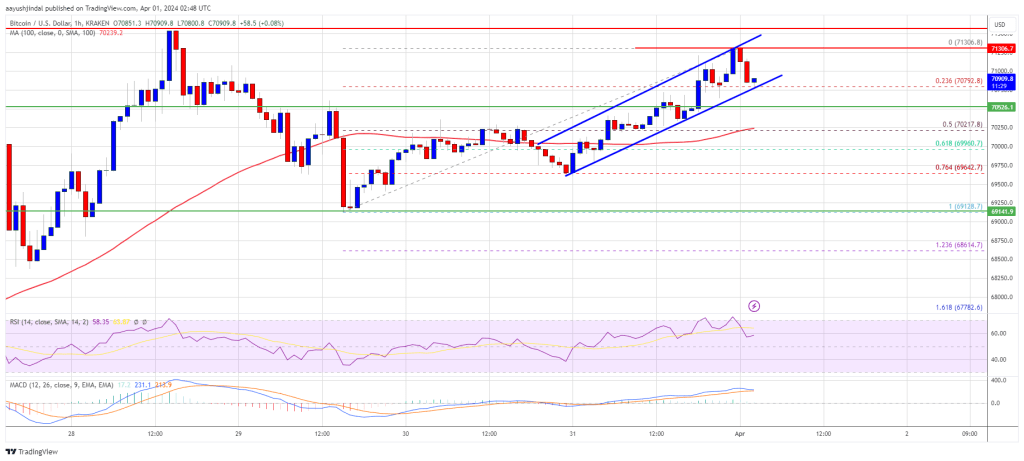
Source: BTCUSD on TradingView.com
Immediate resistance is near the ,300 level. The first major resistance could be ,500. If there is a clear move above the ,500 resistance zone, the price could start a strong increase. In the stated case, the price could even clear the ,500 resistance zone in the near term. The next major resistance is near the ,500 zone.
Another Drop In BTC?
If Bitcoin fails to rise above the ,200 resistance zone, it could start another decline. Immediate support on the downside is near the ,750 level and the channel trend line.
The first major support is ,200 and the 50% Fib retracement level of the upward move from the ,128 swing low to the ,306 high. The next support sits at ,000. If there is a close below ,000, the price could start a drop toward the ,120 level. Any more losses might send the price toward the ,500 support zone in the near term.
Technical indicators:
Hourly MACD – The MACD is now losing pace in the bullish zone.
Hourly RSI (Relative Strength Index) – The RSI for BTC/USD is now above the 50 level.
Major Support Levels – ,750, followed by ,200.
Major Resistance Levels – ,200, ,500, and ,500.
XRP Price Prediction: Can Bulls Pump It Again To $0.75
XRP price found support at .5685 and started a fresh increase. The bulls could gain strength if they manage to push the price above .6560.
- XRP found is attempting a fresh increase from the .5680 support zone.
- The price is now trading above .630 and the 100 simple moving average (4 hours).
- There is a key bullish trend line forming with support near .6440 on the 4-hour chart of the XRP/USD pair (data source from Kraken).
- The pair could start a fresh rally if there is a close above the .6560 resistance zone.
XRP Price Eyes Fresh Surge
After a major decline, XRP price found support near the .5685 level. A low was formed at .5685 and the price started a fresh increase, like Bitcoin and Ethereum.
There was a move above the .5850 and .600 resistance levels. The price cleared the 23.6% Fib retracement level of the downward wave from the .7442 swing high to the .5686 low. The bulls pushed the price above the .640 resistance zone.
Ripple’s token price is now trading above .630 and the 100 simple moving average (4 hours). On the upside, immediate resistance is near the .6560 zone. It is close to the 50% Fib retracement level of the downward wave from the .7442 swing high to the .5686 low.
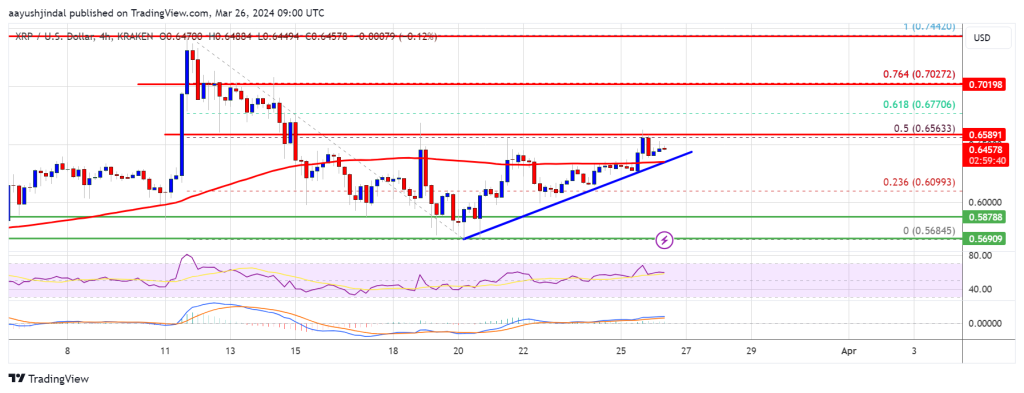
Source: XRPUSD on TradingView.com
The first key resistance is near .700, above which the price could rise toward the .7320 resistance. A close above the .7320 resistance zone could spark a strong increase. The next key resistance is near .7440. If the bulls remain in action above the .7440 resistance level, there could be a rally toward the .800 resistance. Any more gains might send the price toward the .820 resistance.
Another Drop?
If XRP fails to clear the .6560 resistance zone, it could start another decline. Initial support on the downside is near the .640 zone and the trend line.
The next major support is at .620. If there is a downside break and a close below the .620 level, the price might accelerate lower. In the stated case, the price could retest the .5685 support zone.
Technical Indicators
4-Hours MACD – The MACD for XRP/USD is now losing pace in the bullish zone.
4-Hours RSI (Relative Strength Index) – The RSI for XRP/USD is now above the 50 level.
Major Support Levels – .640, .620, and .5685.
Major Resistance Levels – .6560, .700, and .7440.
Bitcoin ‘Real Pump’ Nears New All-Time Highs, Analyst Says
Bitcoin, the ever-enigmatic digital currency, has analysts locked in a heated debate about its 2024 price trajectory. Will it soar to new heights, fueled by institutional adoption and mainstream acceptance, or will it face a reality check and revisit recent lows?
Bullish Vs. Bearish Perspectives On Bitcoin
The optimists, led by the prominent crypto analyst Cryptoyoddha, paint a picture of a bullish future. They point to a meticulously tracked historical chart showcasing the cyclical price movements of Bitcoin.
Each cycle, Cryptoyoddha argues, follows a similar pattern: a period of accumulation followed by a parabolic surge. This analysis paves the way for the highly anticipated “Cycle IV,” which could propel Bitcoin beyond its current all-time high of ,750 and potentially reach a staggering 0,000 or even higher.
The real pump will start after the halving next month. pic.twitter.com/eV5FWkzkxX
— Yoddha (@CryptoYoddha) March 23, 2024
But what’s driving this bullish sentiment? Cryptoyoddha cites several factors: a surge in institutional investment, a shift towards clearer regulations for cryptocurrencies, and a growing public embrace of digital assets. These trends, coupled with the historical pattern of each cycle surpassing the previous one, paint a compelling picture for Bitcoin bulls.
However, not everyone is buying into the euphoria. Michaël van de Poppe, a renowned cryptocurrency trader, injects a dose of caution with his technical analysis. Studying charts that map Bitcoin’s price movements, van de Poppe detects a potentially bearish pattern following the recent price dip.
I wouldn’t be surprised if #Bitcoin eventually takes the liquidity below the lows.
Consolidation, low volatility. pic.twitter.com/CincO9DFjD
— Michaël van de Poppe (@CryptoMichNL) March 23, 2024
He interprets the ongoing period of consolidation – where the price fluctuates within a narrow range – as a potential precursor to a further price drop. This drop, he suggests, could see Bitcoin revisit and even break below its recent lows.
Van de Poppe’s analysis focuses on the presence of “support” and “resistance” levels on his charts. These levels represent price points where historical buying and selling activity has been concentrated. If Bitcoin falls below a key support level, it could trigger a wave of panic selling, pushing the price further down.
Volatility And Uncertainty
The contrasting viewpoints highlight the inherent volatility of the cryptocurrency market. Bitcoin’s price is constantly influenced by a complex web of factors, including unforeseen regulatory decisions, security breaches, and broader economic trends. While historical cycles can offer valuable insights, they are not crystal balls that guarantee future performance.
Investors also need to be wary of placing blind faith in technical analysis. The market is not a purely mechanical system, and unpredictable events can disrupt even the most meticulously drawn charts.
Despite the differing predictions, both analysts acknowledge the likelihood of significant price movement in the coming months. Cryptoyoddha’s bullish outlook hinges on a fundamental shift in the cryptocurrency landscape, while van de Poppe’s technical analysis suggests a potential short-term price correction.
Ultimately, the fate of Bitcoin’s price in 2024 remains a mystery. The upcoming Bitcoin halving in April – an event that cuts the number of new Bitcoins entering circulation and has historically coincided with price increases – adds another layer of intrigue.
Featured image from Pexels, chart from TradingView
Bitcoin Price Jumps 10% But Can Pump BTC Back To $70K?
Bitcoin price started a strong recovery wave from the ,800 zone. BTC is up nearly 10% and now facing hurdles near the ,800 resistance.
- Bitcoin price started a decent increase from the ,800 support zone.
- The price is trading above ,500 and the 100 hourly Simple moving average.
- There was a break above a key bearish trend line with resistance at ,000 on the hourly chart of the BTC/USD pair (data feed from Kraken).
- The pair must clear the ,800 resistance zone to start a fresh uptrend.
Bitcoin Price Recovers 10%
Bitcoin price extended its decline below the ,500 zone. BTC even spiked below the ,200 level before the bulls appeared near ,800. A low was formed near ,778 and the price is now moving higher.
There was a decent increase above the ,000 and ,000 resistance levels. The price even cleared the 50% Fib retracement level of the downward move from the ,898 swing high to the ,778 low. There was a break above a key bearish trend line with resistance at ,000 on the hourly chart of the BTC/USD pair.
Bitcoin is now trading above ,500 and the 100 hourly Simple moving average. It is also above the 76.4% Fib retracement level of the downward move from the ,898 swing high to the ,778 low.
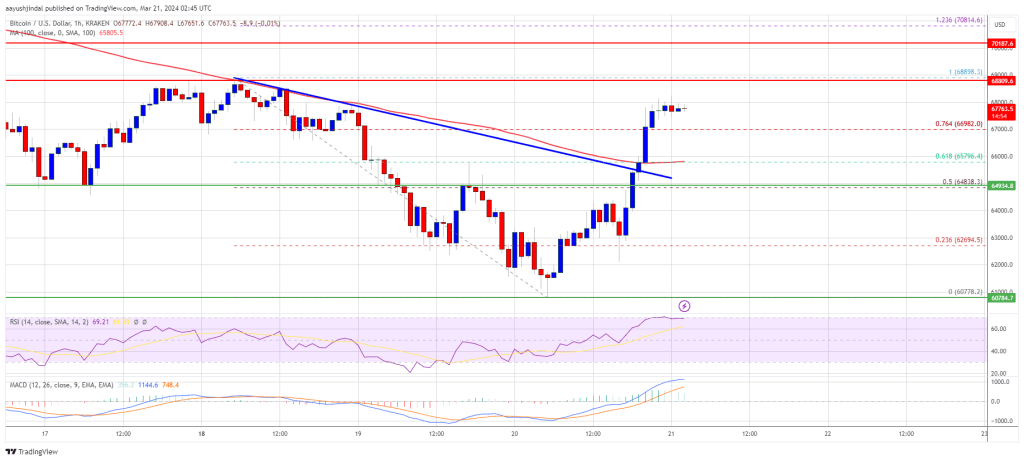
Source: BTCUSD on TradingView.com
Immediate resistance is near the ,000 level. The first major resistance could be ,800. If there is a clear move above the ,800 resistance zone, the price could continue to gain strength. In the stated case, the price could even clear the ,000 resistance zone in the near term. The next key resistance sits at ,500.
Another Decline In BTC?
If Bitcoin fails to rise above the ,800 resistance zone, it could start another decline. Immediate support on the downside is near the ,800 level.
The first major support is ,500. The next support sits at ,800. If there is a close below ,800, the price could start a drop toward the ,000 level. Any more losses might send the price toward the ,500 support zone in the near term.
Technical indicators:
Hourly MACD – The MACD is now gaining pace in the bullish zone.
Hourly RSI (Relative Strength Index) – The RSI for BTC/USD is now above the 60 level.
Major Support Levels – ,500, followed by ,800.
Major Resistance Levels – ,000, ,800, and ,000.
Bitcoin Might Be Poised For A ‘Double Pump Cycle,’ Reveals Analyst – Here’s Why
Bitcoin’s recent downturn has prompted renowned crypto analyst Willy Woo to offer a fresh perspective on the cryptocurrency’s future trajectory. Woo’s analysis, based on the surge in Bitcoin’s Macro Index, suggests an optimistic outlook for the leading digital currency, potentially indicating a pivotal shift in market dynamics.
Unveiling Bitcoin Double Pump Prediction
Willy Woo, a figure well-respected in the cryptocurrency analysis sphere, has recently shared insights that paint an intriguing future for Bitcoin.
According to Woo, the notable increase in the Bitcoin Macro Index could signal more than just a recovery; it might be the precursor to a rare “double pump” cycle.
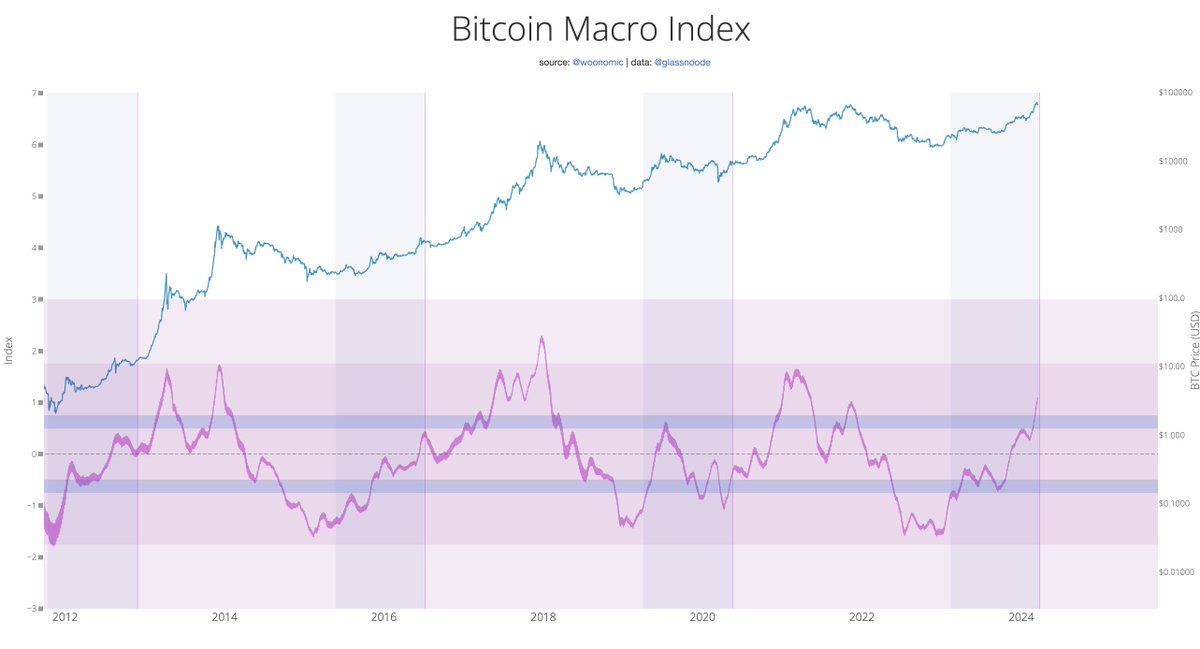
Drawing parallels with the market patterns 2013, Woo’s forecast points towards two significant price surges for Bitcoin in the coming years. He anticipates the first peak by mid-2024 and a second, even more substantial top in 2025.
This dual surge scenario, though historically uncommon, aligns with Woo’s analysis of current market conditions and Bitcoin’s intrinsic growth potential.
At the rate the #Bitcoin Macro Index is pumping, I wouldn’t be surprised if we get a top by mid-2024, which would hint at a double pump cycle like 2013… a second top in 2025. pic.twitter.com/i2a0V5ytPv
— Willy Woo (@woonomic) March 19, 2024
Navigating Through The Bearish Terrain
Meanwhile, the past week has not been kind to BTC, with the asset experiencing a roughly 10% decline. This downward trend extended over the past 24 hours, seeing Bitcoin’s value dip by 4.9%, bringing its price to around ,000—a sharp fall from its recent peak above ,000.
Amid this bearish price action, IntoTheBlock, a notable crypto analytics firm, suggests the ,000 level as a critical demand zone, highlighted by the significant volume of Bitcoin purchased at this price point.
This area is deemed attractive for accumulation by institutional investors and large-scale traders, suggesting a possible recovery in the near future.
Bitcoin is looking for support. But where will it find it?
The k range could be a key area to keep an eye on. 805k addresses acquired over 466k BTC at this level, indicating a healthy appetite for $BTC around that level. pic.twitter.com/XYw7LSC6Ji— IntoTheBlock (@intotheblock) March 19, 2024
Additionally, as Bitcoin navigates its current market challenges, cryptocurrency analyst Charles Edwards points out that a typical pullback during a Bitcoin bull run amounts to about 30%.
With BTC having experienced its longest winning streak in history, a corrective dip to ,000 or even ,000, as per some predictions, remains within the realm of possibility.
A normal Bitcoin bullrun pullback is 30%. Back in December, we were already in the longest winning streak in Bitcoin’s history. A 20% pullback here takes us to K. A 30% pullback would be K. These are all levels we should be comfortable expecting as possibilities.
— Charles Edwards (@caprioleio) March 19, 2024
These levels represent potential buying opportunities for investors looking to capitalize on Bitcoin’s cyclical nature and its anticipated ascension post-pullback.
Featured image from Unsplash, Chart from TradingView
ADA Price Prediction – Here’s Why Cardano Could Pump Again Above $0.75
Cardano (ADA) is correcting gains from the .80 resistance zone. ADA could start a fresh increase if it stays above the .6880 support zone.
- ADA price is slowly moving lower from the .80 zone.
- The price is trading below .720 and the 100 simple moving average (4 hours).
- There is a key bullish trend line forming with support at .6880 on the 4-hour chart of the ADA/USD pair (data source from Kraken).
- The pair could attempt a fresh increase if the bulls remain active above the .680 support.
Cardano Price Reaches Key Support
After forming a base above the .580 level, Cardano started a fresh increase. ADA price was able to climb above the .620 and .680 resistance levels to move into a positive zone, like Bitcoin and Ethereum.
The bulls pushed the pair above the .700 resistance zone. However, the bears were active near the .80 resistance zone. A high was formed near .8097 and the price started a downside correction. There was a move below the .750 level.
The price declined below the 23.6% Fib retracement level of the upward wave from the .5754 swing low to the .8097 high. ADA price is now trading below .7250 and the 100 simple moving average (4 hours).
There is also a key bullish trend line forming with support at .6880 on the 4-hour chart of the ADA/USD pair. The trend line is near the 50% Fib retracement level of the upward wave from the .5754 swing low to the .8097 high.
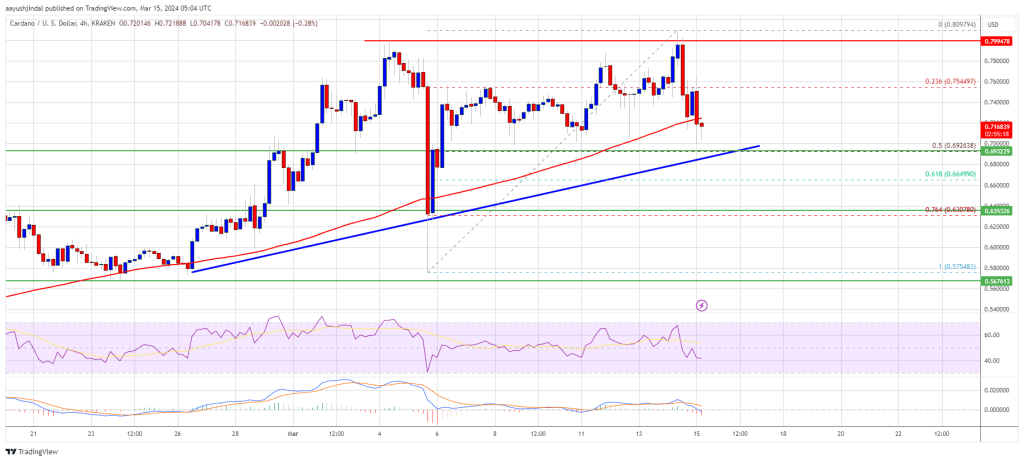
Source: ADAUSD on TradingView.com
The bulls might remain active near the .680 support. On the upside, immediate resistance is near the .7220 zone. The first resistance is near .740. The next key resistance might be .800. If there is a close above the .800 resistance, the price could start a strong rally. In the stated case, the price could rise toward the .8250 region. Any more gains might call for a move toward .850.
More Losses in ADA?
If Cardano’s price fails to climb above the .7220 resistance level, it could continue to move down. Immediate support on the downside is near the .6880 level.
The next major support is near the .680 level. A downside break below the .680 level could open the doors for a test of .6350. The next major support is near the .6120 level.
Technical Indicators
4 hours MACD – The MACD for ADA/USD is losing momentum in the bearish zone.
4 hours RSI (Relative Strength Index) – The RSI for ADA/USD is now below the 50 level.
Major Support Levels – .6880, .6800, and .6350.
Major Resistance Levels – .7220, .7400, and .8000.