 The Financial Stability Board (FSB) Plenary met in Toronto on June 14 to discuss various financial stability issues. Key topics included the financial stability outlook, lessons from the March 2023 banking turmoil, and enhancing the resilience of non-bank financial intermediation (NBFI). The FSB also reviewed progress on implementing its global regulatory framework for crypto asset […]
Bitcoin News
Bitcoin’s Crucial Lifeline: Analyst Unveils Support That Could Prevent Crash To $60K
Bitcoin has once again been the center of attention following its recent surge to a new all-time high, only to face a subsequent downturn that tested the resilience of its market value.
A few days ago, Bitcoin traded at ,328 for the first time ever, but It experienced a pullback, dipping to the ,000 region before regaining its footing and stabilizing above the ,000 mark.
Bitcoin Crucial Support Level
Ali, a recognized figure in the crypto analysis sphere, has pinpointed a critical support level that could play a pivotal role in Bitcoin’s short-term price trajectory. He highlights ,112 as a key support threshold, supported by a significant transaction volume of 306,676 BTC.
Should Bitcoin’s price venture below this crucial level, it may encounter increased selling pressure, potentially leading it toward the ,600 mark.
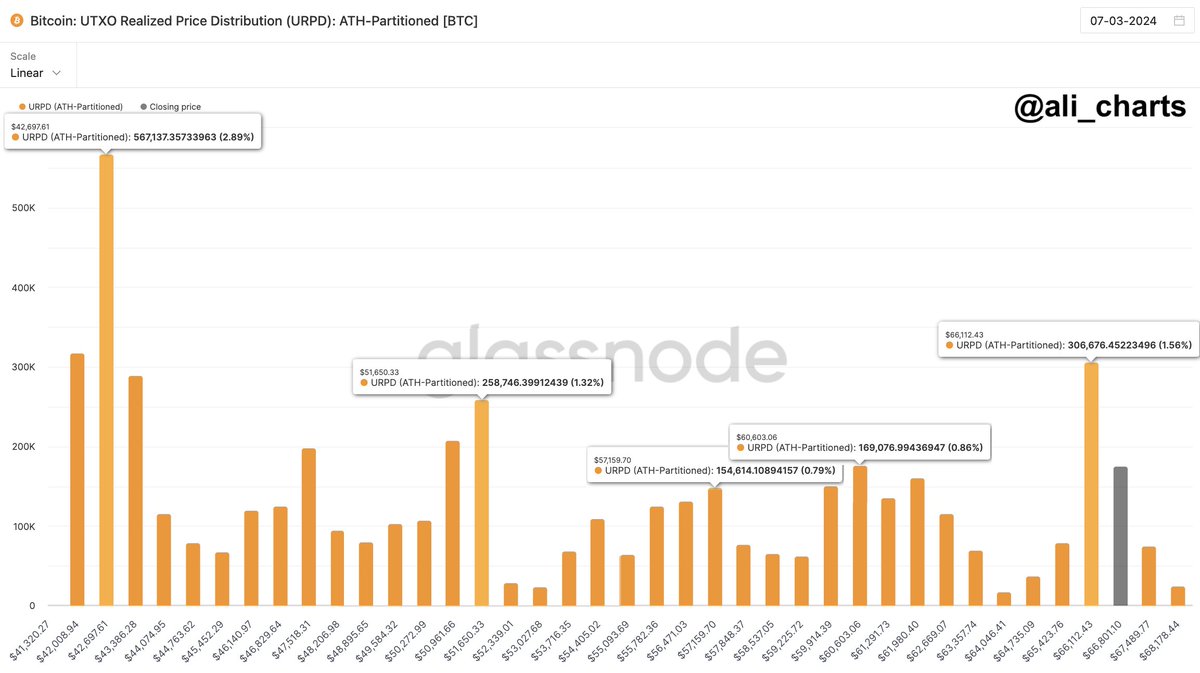
Notably, a substantial transaction volume at the ,112 support level is a bullish signal, indicating strong market support for Bitcoin.
The key support level for #Bitcoin stands at ,112, marked by a substantial volume of over 306,676 $BTC transactions. Should #BTC break below this pivotal threshold, eyes will turn to ,600 as the next crucial support zone. pic.twitter.com/etuBRlvIOR
— Ali (@ali_charts) March 7, 2024
Analyst Insights On Corrections And Market Maturity
As Bitcoin navigates through its current market cycle, the conversation around potential corrections and their implications has intensified. Analysts like CryptoJelleNL have projected a correction in the 20-25% range, hinting at a possible dip to the ,500 range.
Such predictions are grounded in cycle analysis, which examines market corrections’ historical precedence and impact on Bitcoin’s value. Observations from past cycles reveal a trend toward diminishing severity of corrections, indicating a maturing market that is becoming increasingly resilient to shocks.
For instance, the 2016-2017 cycle witnessed seven significant corrections with an average pullback of 32%, whereas the current cycle has seen fewer and less severe downturns, with an average pullback of 21%.
Corrections are an essential part of a #Bitcoin bull market — but with each passing cycle, the dips become shallower.
This cycle, it looks like ±20-25% will be the sweet spot for dip-buying.
Your job is to be ready to take advantage when it comes. pic.twitter.com/xrI7iKfiPR
— Jelle (@CryptoJelleNL) March 1, 2024
Amid the fluctuations, Bitcoin maintains its bullish stance, reclaiming the ,000 mark with a curating trading price of ,761. This resilience follows a significant pullback from Tuesday’s recent all-time high of ,328.
Over the last 24 hours, Bitcoin has seen a 1.3% increase, complemented by a 6.6% gain over the past week, underscoring the asset’s enduring strength in the market.
Featured image from Unsplash, Chart from TradingView
Bitcoin Triumphs Over $41,000, But Here’s What Could Prevent $50,000
Bitcoin has broken past the ,000 level during the past day, but FOMO could be the number one danger to a further surge towards ,000.
Bitcoin Social Dominance Has Spiked Following The Rally
According to data from the on-chain analytics firm Santiment, signs of euphoria have appeared among Bitcoin traders following the latest climb in the asset’s price.
The main indicator of interest here is the “social dominance,’ which is based on another metric called the “social volume.” This latter indicator basically tells us about the amount of discussion related to a given topic that is happening on the major social media platforms right now.
The metric tracks this by going through each post/thread on these platforms to see if they are making mentions of the topic or not. However, rather than counting the number of mentions themselves, it separates the posts and counts the total number of them instead.
Because of this approach, a more organic overview of the market becomes apparent, as the indicator will only spike when discussions are happening across social media, rather than inside just one or two large threads.
The social dominance compares this social volume of any given coin against that of the top 100 cryptocurrencies combined. Thus, whenever this indicator shoots up, it means that the mindshare related to the asset is going up among social media users.
Now, here is a chart that shows the trend in both the Bitcoin social volume and social dominance over the past year:
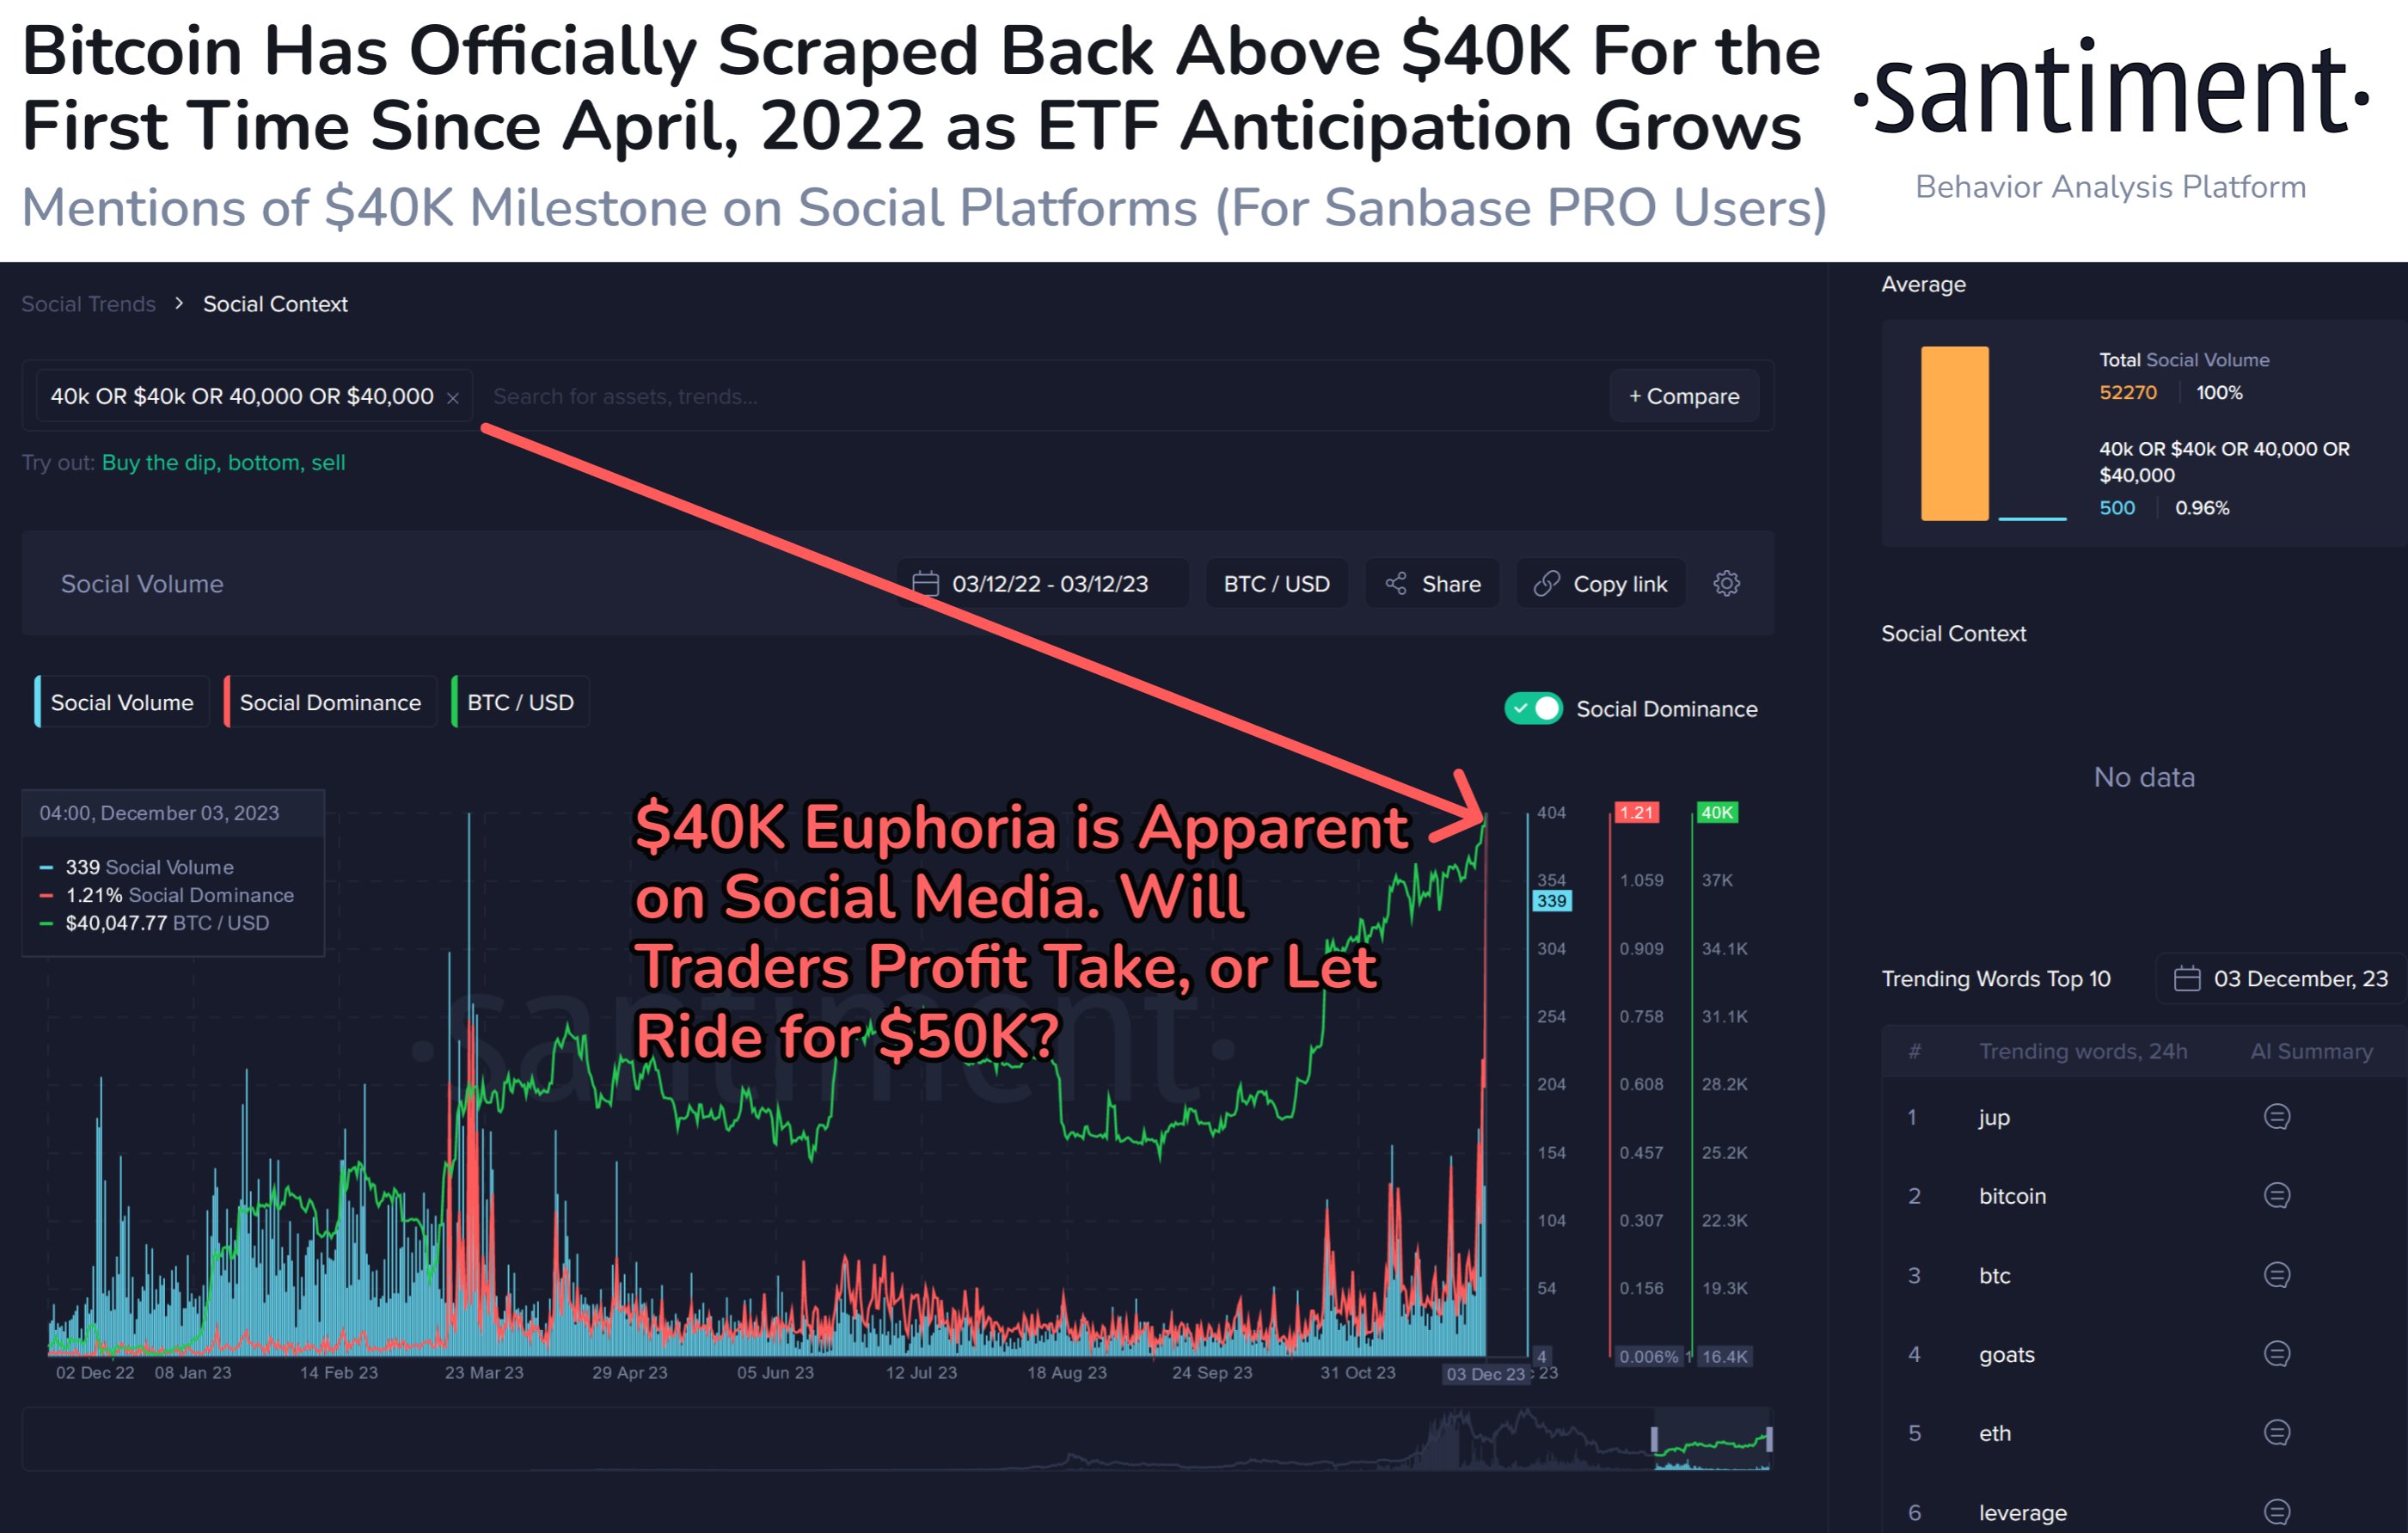
As displayed in the above graph, the Bitcoin social dominance observed a huge increase when the Bitcoin price broke above ,000 during the past day. This implies that users shifted focus toward BTC from the other coins after this rally.
While some attention is healthy (it’s even required, otherwise the move would become unsustainable), too much hype has often not turned out to be favorable for the cryptocurrency in the past.
An example of this is clearly visible in the chart, where the BTC rally hit its brakes back in March of this year after the social volume and social dominance both registered significant spikes.
Going by this, the current even higher values of social dominance could be a worrying sign for the asset’s hopes of rallying toward the ,000 mark. Though, so far, BTC has still been able to continue its climb despite this development, as it has now broken past the ,000 barrier as well.
In the end, it comes down to whether the discussions have a bullish or a bearish view. More of the latter would provide better chances for the rally to continue. As Santiment explains, “FUD & FOMO toward the ongoing ETF confirmation dates will dictate whether ,000 arrives sooner rather than later.”
BTC Price
It would appear that Bitcoin isn’t done with its surge yet as the coin has now risen above ,800, inching closer to ,000.
146 Top Executives Urge Biden to Prevent US Default — Warns of ‘Disastrous Consequences’
Top executives from 146 major companies in the U.S. — including Morgan Stanley, Goldman Sachs, Nasdaq, and Pfizer — have urged President Joe Biden and congressional leaders to act swiftly to prevent the U.S. from defaulting on its debt, which could occur as early as June 1. They warned of “potentially disastrous consequences” if the U.S. defaults on its debt obligations.
Executives Warn of ‘Disastrous Consequences’ From US Default
A total of 146 executives from major companies in the U.S. have jointly written an open letter to President Joe Biden and congressional leaders urging them to take swift action to save the U.S. from defaulting on its debt obligations.
Among the letter signers are Goldman Sachs CEO David Solomon, Morgan Stanley CEO James Gorman, Nasdaq CEO Adena Friedman, Guggenheim Partners Executive Chairman Alan Schwartz, and Pfizer CEO Albert Bourla.
Addressing President Biden, Senate Majority Leader Chuck Schumer, Senate Minority Leader Mitch McConnell, House Speaker Kevin McCarthy, and House Minority Leader Hakeem Jeffries, the executives wrote:
We write to emphasize the potentially disastrous consequences of a failure by the federal government to meet its obligations. Absent a resolution, the government is likely to run out of money as soon as June 1. Action to end the pending debt crisis is necessary now.
“Failure to resolve the current impasse could easily have more negative consequences,” they continued. “Although the American economy is generally strong, high inflation has created stresses in our financial system, including several recent bank failures.”
The executives added: “Much worse will occur if the nation defaults on our debt obligations, which would weaken our position in the world financial system. Large amounts of our trillion debt are held by pension funds, individuals, and other governments.” They noted:
The inability to incur new debt would also threaten the government’s ability to pay its other bills, potentially including some payments to Social Security or Medicare recipients. This cannot be allowed to happen.
“We strongly urge that an accord be reached quickly so that the country can avert this potentially devasting scenario,” they concluded.
U.S. Treasury Janet Yellen has warned that the Treasury may not be able to pay all of the government’s bills as early as June 1. The Congressional Budget Office similarly estimated that the U.S. could default on its debt obligations in the first two weeks of June.
However, President Biden is “confident” that he can reach a deal with Republicans on the debt ceiling. Meanwhile, a group of Senate Democrats is reportedly circulating a letter urging him to prepare to invoke the 14th amendment to unilaterally resolve the debt ceiling standoff.
“I’m confident we’ll get the agreement on the budget and America will not default … We’re going to come together because there’s no alternative way to do the right thing for the country. We have to move on,” Biden said Wednesday. Former President and 2024 presidential candidate Donald Trump recently urged Republican lawmakers to let the U.S. default on its debt if the Democrats do not agree to spending cuts.
What do you think about 146 executives urging President Joe Biden and congressional leaders to act swiftly to prevent the U.S. from having to default on its debt obligations? Let us know in the comments section below.
Yellen Says US Could Back All Deposits at Smaller Banks if Needed to Prevent Contagion

U.S. Treasury Secretary Janet Yellen says the federal government could guarantee all deposits of smaller banks if they “suffer deposit runs that pose the risk of contagion.” The government recently protected all deposits of Silicon Valley Bank and Signature Bank after they failed.
U.S. Government Ready to Guarantee More Deposits if Needed
U.S. Treasury Secretary Janet Yellen said in a speech to the American Bankers Association Tuesday that the government is ready to provide additional deposit guarantees if the banking crisis worsens.
Following the failures of several major banks, including Silicon Valley Bank and Signature Bank, the government stepped in and guaranteed all deposits of the two failed banks beyond the usual 0,000 Federal Deposit Insurance Corporation (FDIC) coverage limit. The former Federal Reserve chair explained:
The steps we took were not focused on aiding specific banks or classes of banks. Our intervention was necessary to protect the broader U.S. banking system. And similar actions could be warranted if smaller institutions suffer deposit runs that pose the risk of contagion.
“The situation is stabilizing. And the U.S. banking system remains sound,” Yellen insisted.
Nonetheless, Treasury Department staff are reportedly exploring ways to temporarily expand FDIC insurance coverage to all deposits, Bloomberg reported Monday.
Last week, the Mid-Size Bank Coalition of America asked federal regulators to extend FDIC insurance to all deposits for the next two years. “It is imperative we restore confidence among depositors before another bank fails, avoiding panic and a further crisis,” the group said. In addition, U.S. Congressman Blaine Luetkemeyer has urged the government to temporarily insure every bank deposit in the country to prevent runs on smaller banks.
However, Yellen dismissed last week the idea of the government providing guarantees for all deposits in the event of future bank failures.
Do you think the government should guarantee all deposits of every bank? Let us know in the comments section below.
Bulls Have To Defend This Level To Prevent Cardano From Sliding Further
Due to recent losses, the Cardano price is moving within a descending channel. Over the last 24 hours, the ADA price fell by 2%, and the altcoin price has failed to progress in the past week. The bears have maintained control of Cardano for the last two weeks.
At the moment, the ADA price is moving closer to its key support line. The technical outlook of the altcoin is siding with the bears as the altcoin lost buying pressure at press time. Both demand and accumulation fell on the daily chart, reflecting that the bears are attempting to take over the altcoin price.
The market capitalization of ADA fell on the chart, which suggests that sellers have made a subsequent entrance into the market. If ADA falls below its crucial support line, the bears will gain complete control over the price before the altcoin attempts to reverse that. For ADA to break out of the descending channel, demand has to note an appreciation over the subsequent trading sessions.
Cardano Price Analysis: One-Day Chart
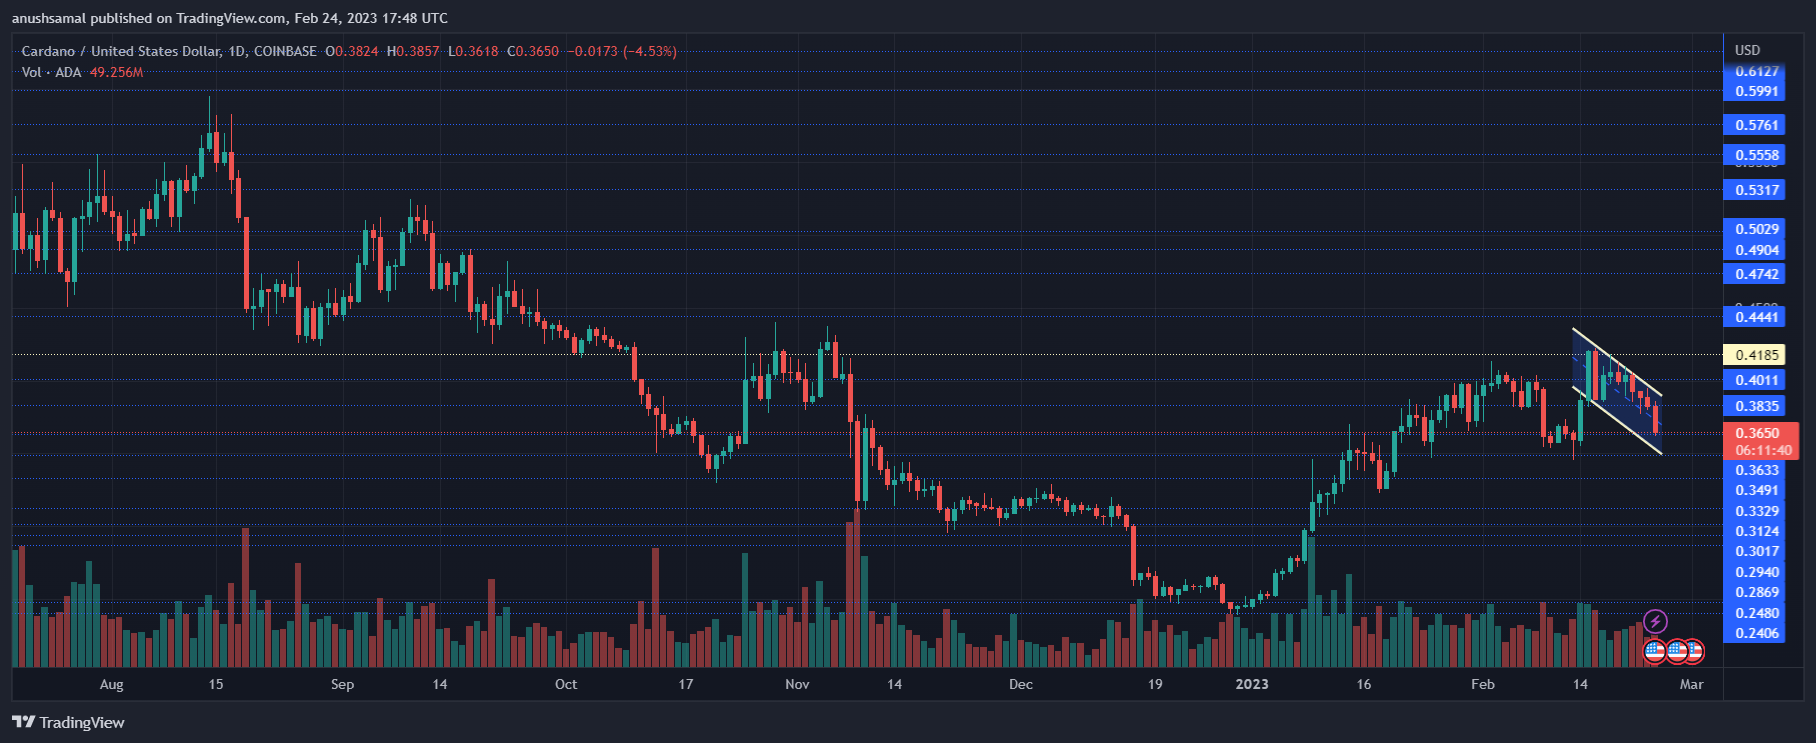
ADA was trading at .364 at the time of writing. It happens to be moving inside a descending channel, which reflects bearishness on the chart. The bulls struggle to defend the altcoin from falling below the direct line.
ADA has to remain above its critical, crucial level of .349; The altcoin just fell below a vital price floor of .370. Overhead resistance for the coin stood at .383.
Once the altcoin clears the price mentioned above the mark, it could attempt to trade near the .400 resistance level. The amount of Cardano traded in the last session declined, which indicated that buying strength faded.
Technical Analysis
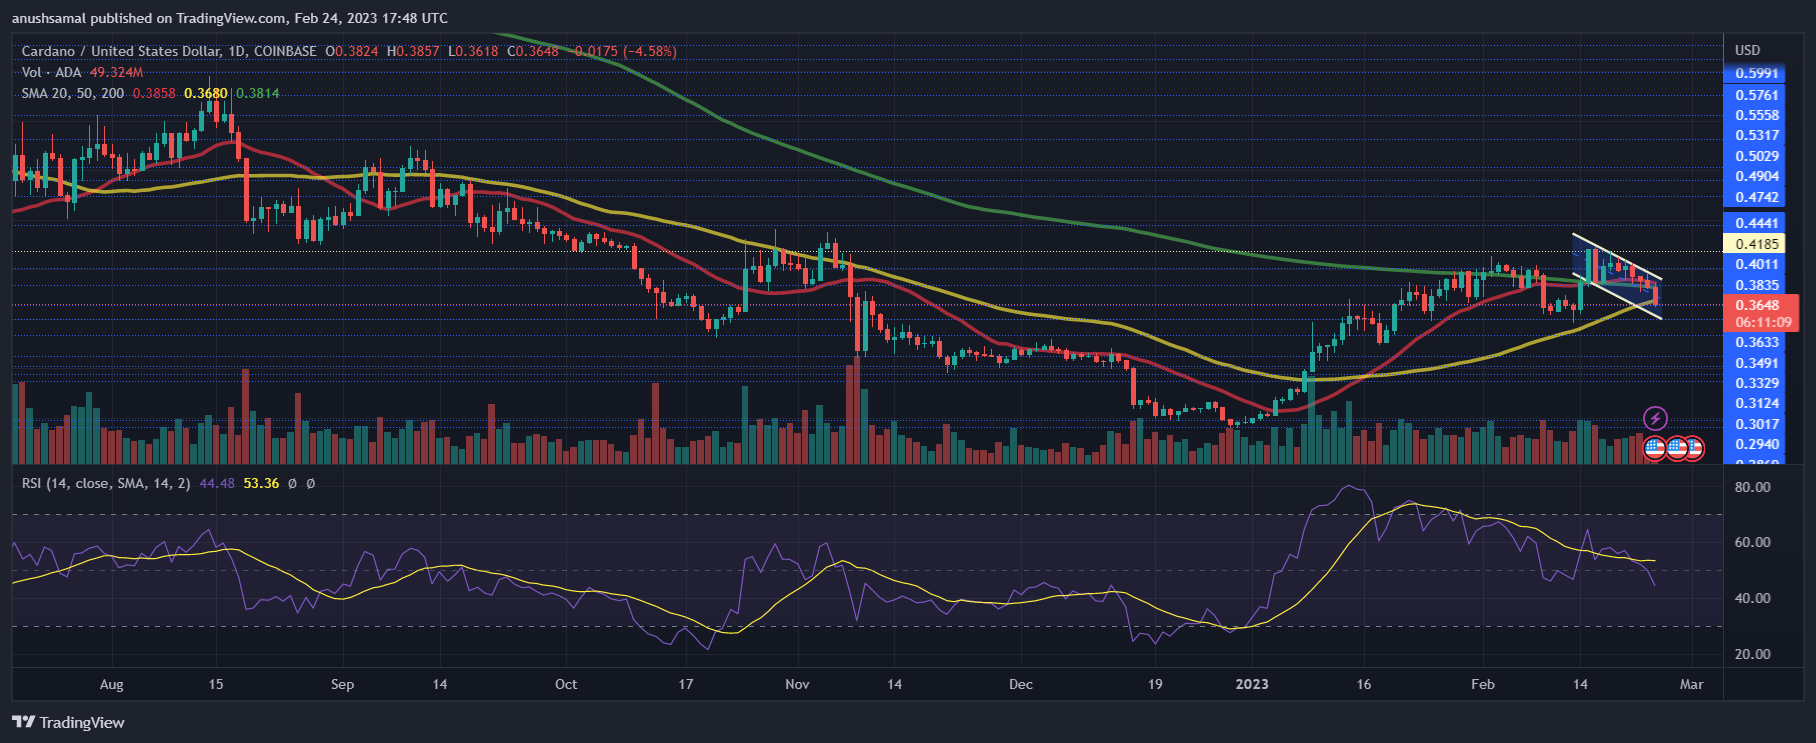
As ADA moved within the descending channel, demand for the altcoin also noted a significant fall. The Relative Strength Index fell below the half-line, meaning sellers started taking over the market.
ADA must climb above the .380 mark for the bears to be invalidated. Similarly, the ADA price slowly moved below the 20-Simple Moving Average (SMA) line. This meant that sellers had started to drive the price momentum in the market.
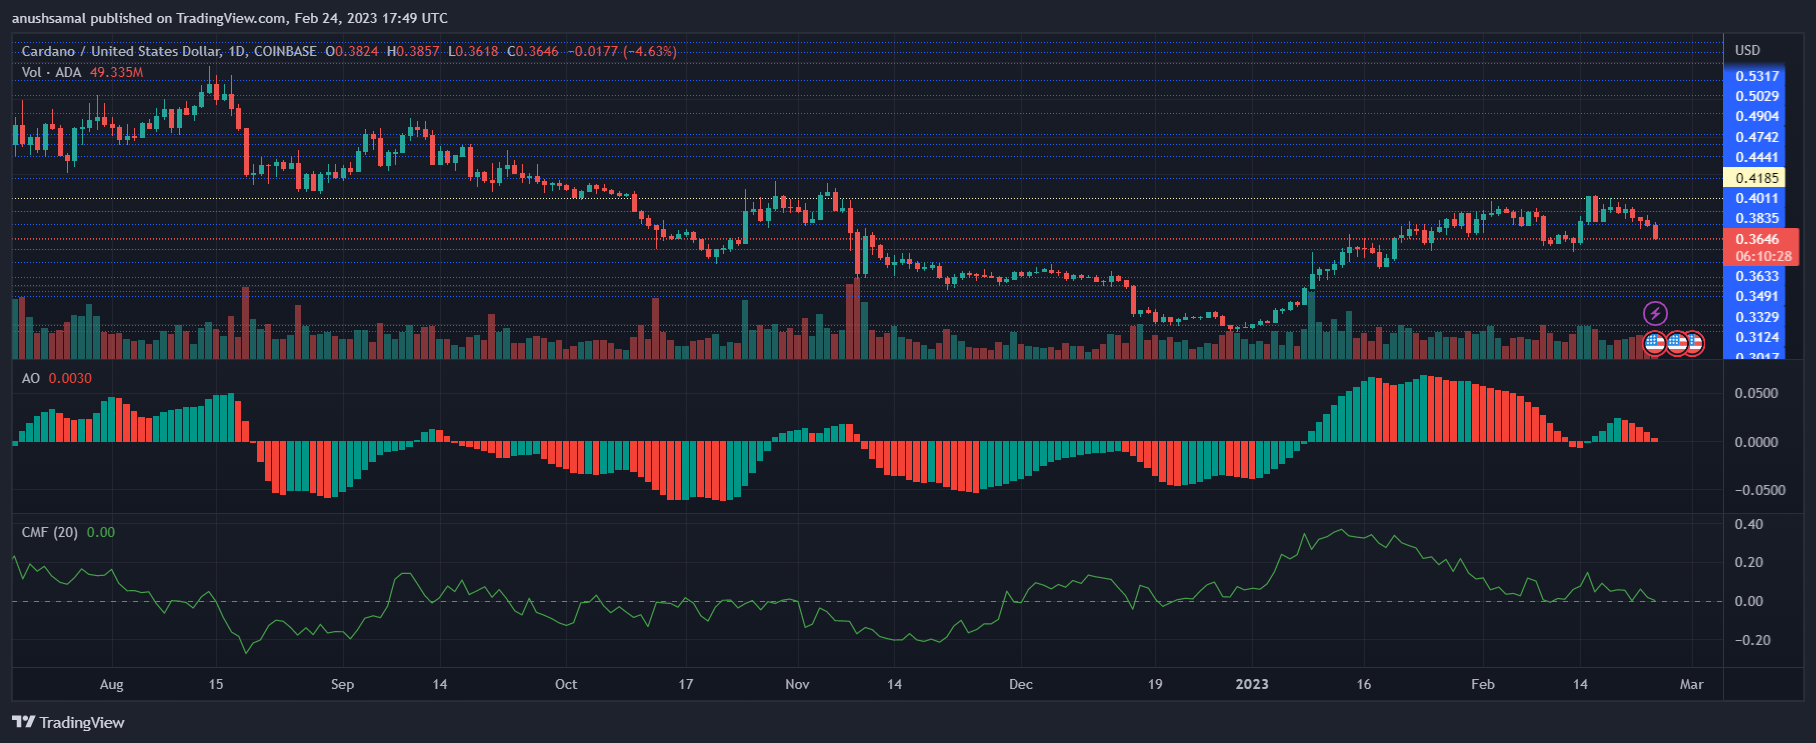
Technicals have indicated that the bears have started to take charge. The altcoin noted sell signals on the daily chart. The Awesome Oscillator shows price momentum and reversals, forming red signal bars considered sell signals for the altcoin.
The Chaikin Money Flow measures capital inflows and outflows at a given time. The indicator fell and stood on the half-line, meaning that capital inflows noted a decline, further strengthening the bearish outlook. This often means another fall in price before the coin begins to recover.
This CBDC Act Will Prevent The US Government From Surveilling Citizens’ Finances
Tom Emmer, the House Majority Whip serving as the representative for Minnesota’s 6th congressional district for the last seven years, is introducing the Central Bank Digital Currency (CBDC) Anti-Surveillance State Act to prevent the government from “violating citizens’ right to privacy” should they go in this direction.
The CBDC Anti-Surveillance State Act
In a tweet on February 22, Tom said the act would prevent what he said are “unelected bureaucrats” in Washington, the center of power in the United States, from stripping Americans of the right to financial privacy.
Today, I introduced the CBDC Anti-Surveillance State Act to halt efforts of unelected bureaucrats in Washington, DC from stripping Americans of their right to financial privacy.
pic.twitter.com/lONbHFZMk7
— Tom Emmer (@GOPMajorityWhip) February 22, 2023
The bill will prevent the United States Federal Reserve from directly issuing anyone Central Bank Digital Currency (CBDC). Moreover, it will prevent the central bank from using CBDC to implement their monetary policy or control the economy. If this bill is enacted, it will demand all CBDC projects to be transparent to Congress, the policy-making body of the United States, and the American people.
This bill comes on the heightened crackdown, especially by the Securities and Exchange Commission (SEC) on stablecoin issuers, including Paxos, and cryptocurrency projects in the country. Crypto exchange Kraken, for example, settled with the agency after paying a million disgorgement fee and promising to halt its retail staking service in the United States.
Meanwhile, Paxos, the issuer of BUSD, a stablecoin pegged to the USD, received a notification from the regulator. The SEC claims all BUSD in circulation is unregistered securities.
FED Is Undecided On The Digital Dollar
The United States is considering a CBDC, the Digital Dollar, which the Federal Reserve will mint. It is unlike Bitcoin, which runs on a trustless public network.
Even so, the central bank has not decided whether to proceed with the project and implement a CBDC that will effectively digitize the USD. However, they have been exploring the benefits and risks of the CBDC from “different angles.” As they research, the objective is to check whether this would improve what the FED says, an “already safe and efficient US domestic payments system.”
Tom Emmer is tabling this bill to prevent government excesses should the FED decide to implement a CBDC system, launching the digital dollar.
Any digital version of the dollar must uphold our American values of privacy, individual sovereignty, and free market competitiveness. Anything less opens the door to the development of a dangerous surveillance tool.
Critics say CBDCs can be turned into a tool to surveil the population illegally, infringing on their privacy rights, a concern.
Nigeria has already implemented the eNaira, and several other countries, including China, are digitizing their currencies.
Can Ethereum Prevent More Losses As Altcoin King ETH Slips 7% In Last 7 Days?
Further pain was inflicted on the markets as major cryptocurrencies Bitcoin and Ethereum slipped on macroeconomic pressures and other factors. As of time of writing, the top altcoin Ether has lost nearly 7% in the weekly timeframe.
This is reflected in the other altcoins as most, if not all, move alongside ETH. However, if the crypto slides further downwards, will it deal a heavy blow on the broader market as well?
The FTX Shockwave Still Felt
Since the collapse of crypto exchange FTX, Ethereum has been in the red, but then that seems normal as other cryptos are, as well.
The decline in ETH’s value, however, began after it reached a record high of ,635 in December of last year. Since then, the crypto has had massive highs and lows, but mostly the latter.
With Ethereum network fees plummeting to .9 million per day from .8 million on June 13, the price of ether plunged. The total value locked (TVL) in Ethereum-based smart contracts were also down by 4.5% in the last 24 hours.

Other Factors At Play For ETH
More suffering has been inflicted on ETH as a result of recent occurrences. For instance, the U.S. Federal Reserve raising interest rates last week took a toll on its price, allowing the bears to continue testing the present support price range of ,164.
Further market pain is to be predicted if the coin breaks its current support. The bulk of altcoins on the top 10 list of Coingecko are heavily correlated to ETH, so this is significant for the altcoin market.
Thus, if ETH declines, other cryptocurrency holders may interpret this as a sign of market weakness, resulting in greater market misery. ETH is trading at ,184, down 0.2% in the last 24 hours.
Ethereum: Further Struggle Anticipated?
Today, prominent indices such as the S&P 500 and Dow Jones have declined by a couple of percentage points as a result of the fear of an economic recession, which impacts sentiment around the crypto.
Ethereum may have difficulty retaining investors if further rate hikes occur at the beginning of the first quarter of next year.
Despite the fact that the altcoin is down 7% in the last seven days, we expect to see a slight bullish pullback so that we may once again test the ,222 level as resistance.
Currently, the prior price fluctuations of the token indicate that a recovery is forming. However, this is counterbalanced by negative macroeconomic causes and a very pessimistic market mentality, which is a continuation of the bear market that preceded the current events.
Investors and traders should be cautious as the current market volatility might invalidate long positions in the short-term. If ETH continues to backpedal, there will be no doubt that there will be pain for altcoins.
Bitcoin Cash Price: Investors Must Avoid These Levels To Prevent Losses
Investors, who are keeping a close eye on Bitcoin Cash and want to avoid losses, should steer clear of these crucial price points.
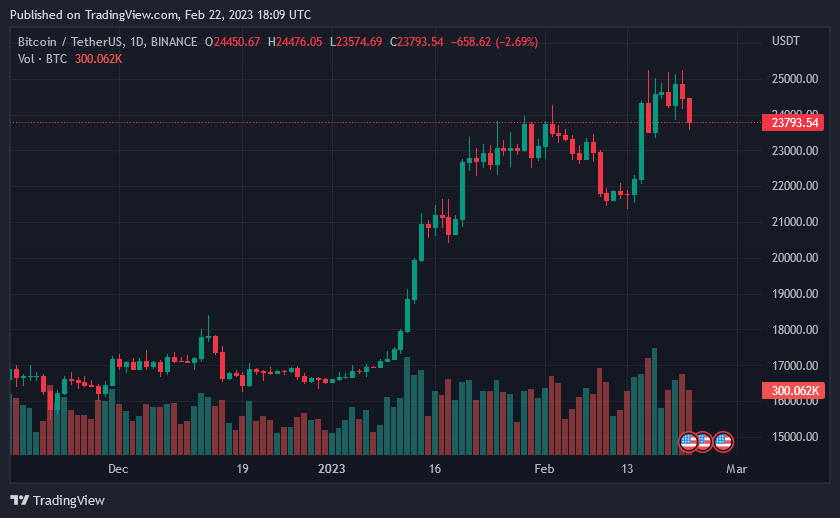
As of this writing, Bitcoin is still showing a little bit of bullishness, despite losing a few digits from its price. BTC retreated below the K mark, and now trades at ,998, according to data from Coingecko.
Short-term support for the bears came from rejection wicks at the .5k level. Even Bitcoin Cash, the fork of BTC, isn’t immune to this issue.
BCH is in such a jam, despite Bitcoin losing the k psychological support.
There have been recent reports regarding a number of developments with potentially profound implications for BCH. This report indicates that Bitcoin Cash’s transaction volume has been below the average of 27,734 daily transactions.
Lower transaction volumes are a negative indicator to both potential and existing investors for BCH, thus this could be an issue.
Bitcoin Cash: Formidable Wall For The Bulls
Bitcoin Cash’s value fell 35.50% between the July 29 rally and the September 19 low, before rebounding 17.40%. After that time, however, Bitcoin Cash’s price remains stable.
These days, you can buy Bitcoin Cash for as little as .559 and as much as 6.025. Furthermore, BCH has a support level at 2.246 and a resistance level at 5,912.
Although CCI and Stoch RSI readings are optimistic, the stated resistance level remains a formidable obstacle for BCH bulls to overcome.
Even though the Chaikin money flow index is optimistic, it is establishing a downward trajectory, indicating that the velocity of selling is increasing.
The CMF index’s gloomy prognosis, on the other hand, is more pronounced on the 4-hour time range.
The 4-hour CMF is -0.05, indicating that sellers are gaining control of the BCH market. Currently, the question is whether BCH can still recover.
Possible Recuperation? Or Further Decline?
The BCH support line stays unchanged. However, there are two levels of resistance that investors and traders should target: 5.912 and 8.835.
Source: TradingView
The former level was breached twice on August 23 and September 9, but the bulls were unable to sustain the break, resulting in a price decline to 2.246.
A breach of the 5.912 resistance can be interpreted as a psychological buy signal for investors. Since the fall on September 13, a modest uptrend is building on the 4-hour time period.
A strong closing in today’s trade could aid the bulls in maintaining momentum and finally surpassing the indicated resistance levels.
BCH market cap at .28 billion | Featured image from CriptoFacil, Chart: TradingView.com
NewsBTC
TA: Bitcoin Recovers Losses But Here’s Why $41.5K Could Prevent Gains
Bitcoin extended decline below the ,000 level against the US Dollar. BTC found support near the ,550 zone and started a strong recovery wave.
- Bitcoin extended decline below the ,250 and ,000 levels before it found support.
- The price is now trading above ,000 and the 100 hourly simple moving average.
- There was a break above a major bearish trend line with resistance near ,220 on the hourly chart of the BTC/USD pair (data feed from Kraken).
- The pair must clear the ,500 resistance zone to start a major upward move.
Bitcoin Price Still Faces Hurdles
Bitcoin price followed a bearish path below the ,000 level. BTC even traded below the ,200 support and declined to a new weekly low.
It spiked below ,000 and traded as low as ,570. Recently, it started a strong recovery wave and climbed above the ,000 resistance zone. There was a break above a major bearish trend line with resistance near ,220 on the hourly chart of the BTC/USD pair.
Bitcoin is now trading above ,000 and the 100 hourly simple moving average. It even traded above the ,000 level, but failed to clear the ,500 resistance zone.
A high is formed near ,334 and the price is now correcting gains. It is testing the 23.6% Fib retracement level of the recent increase from the ,570 swing low to ,334 high. An immediate resistance on the upside is near the ,000 level.
Source: BTCUSD on TradingView.com
The next key resistance could be ,350. The main resistance is still near the ,500 zone. To start a strong upward move, the price must clear the ,500 zone. In the stated case, the price may perhaps rise towards the ,500 resistance zone. Any more gains could set the pace for a move towards the ,200 level.
Fresh Decline in BTC?
If bitcoin fails to clear the ,500 resistance zone, it could start another decline. An immediate support on the downside is near the ,250 level and the 100 hourly simple moving average.
The next major support is seen near the ,950 level. It is near the 50% Fib retracement level of the recent increase from the ,570 swing low to ,334 high. A downside break below the ,950 support zone could push the price towards the ,000 level.
Technical indicators:
Hourly MACD – The MACD is now losing pace in the bullish zone.
Hourly RSI (Relative Strength Index) – The RSI for BTC/USD is now above the 50 level.
Major Support Levels – ,250, followed by ,950.
Major Resistance Levels – ,350, ,500 and ,500.