 PRESS RELEASE. Penguiana, the penguin-themed meme coin on the Solana blockchain, with an upcoming play to earn game has witnessed a staggering 70% surge in its market valuation after its recent listing on CoinMarketCap. This significant achievement underscores growing investor confidence and marks a pivotal advancement in Penguiana’s journey within the cryptocurrency landscape. $PENGU the […]
Bitcoin News
Is Polkadot Preparing For A 100% Surge And Spike Above $20?
Polkadot, the interoperable blockchain, remains one of the largest and most popular networks in the top 20. At press time, DOT, the platform’s native currency, is 14th, ahead of Tron and the NEAR Protocol.
However, despite recent gains, it is still down 87% from all-time highs, undeniably facing a brutal market correction.
Even with this bearish sentiment, a wave of optimism is building around DOT’s future. Taking to X, one analyst thinks not only will the coin shake off weakness but will surge, rallying to over in the coming months.
This confidence, the analyst said, will be primarily because of crucial developments in the broader Polkadot ecosystem.
Eyes On Polkadot 2.0, Better On-Chain Governance
Of the many, the analyst thinks the upcoming Polkadot 2.0 upgrade will be a game-changer. Already, Polkadot is interoperable and scalable. However, once the new upgrade comes into play, the platform’s developers expect the network to be more interoperable, scalable, and with better governance.
Specifically, to address scalability, they will eliminate the Parachain slot auction and introduce the concept of coretime. This feature will give developers more flexibility.
Instead of bidding and locking resources in the auction, they must purchase block space dynamically as needed. This will improve resource allocation, leading to more accessibility and efficiency.
Additionally, Polkadot developers are introducing the OpenGov system for more decentralized governance. The objective here will be to give all DOT holders a voice in decision-making, which is crucial in decentralized networks.
JAM Upgrade Proposal Passed, Will DOT Bulls Break ?
The network is also preparing for more changes. The community recently approved the Join-Accumulate Machine (JAM) chain.
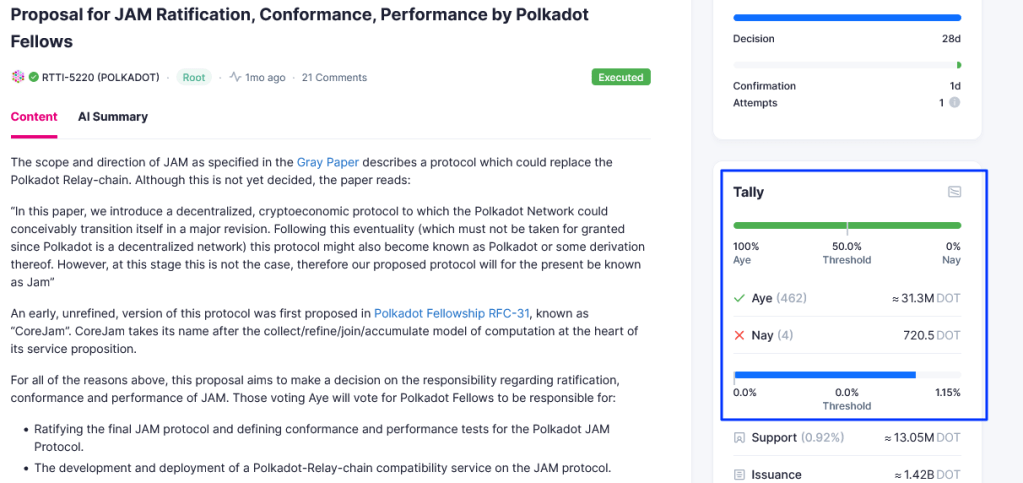
The proposal, which was unanimously passed by the community, paves the way for developers to build services similar to Ethereum smart contracts directly on the Polkadot Relay Chain. Gavin Wood, the former Ethereum developer who introduced the proposal, said this would make the network more accessible.
Beyond network-related upgrades, the analyst also said that more DOT’s are being locked, which is a huge boost. Usually, with staking, coins are taken out of circulation, increasing scarcity. If more activity and the demand for DOT increases, it would positively impact the price, helping lift it from the current ranges.
As of June 3, over 1.4 billion DOT were in circulation. By the fourth week of May, over 820 million DOT had been staked. Looking at the price chart, if the coin breaks above , the incentive to stake and early rewards plus capital gains will increase.
Is Solana Preparing For Liftoff Or Meltdown? Analysts Forecast SOL’s Future
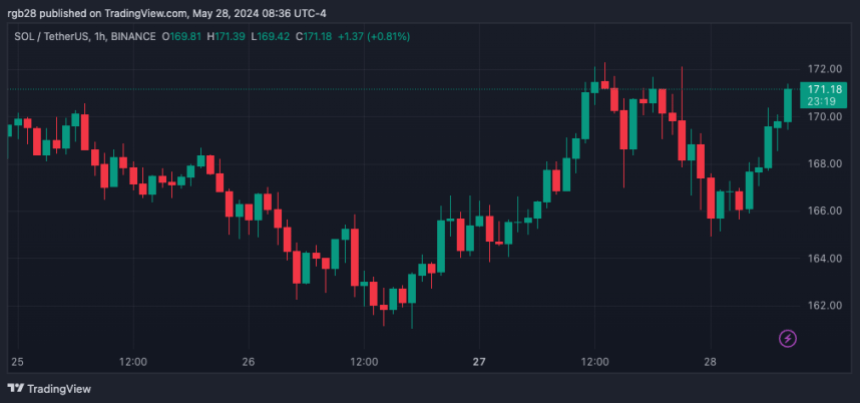
After the recent market pump, Solana (SOL) recovered an important support zone. As a result, analysts have debated whether the altcoin is poised for a liftoff to a new all-time high (ATH) or about to face a meltdown.
Analysts Fear SOL’s Top Is In
After recovering the 0 support zone over a week ago, Solana reached heights not seen since the beginning of April. SOL neared the 0 resistance level but failed to surpass it. Instead, the token’s price hovered between the 0 and 0 mark before returning near the 0 support zone over the weekend.
Despite underperforming compared to Bitcoin (BTC) and Ethereum (ETH), the token reached a new ATH in a key metric during this cycle. In March, Solana’s market capitalization surpassed its previous ATH, reaching a market cap of billion.
Last week’s pump saw SOL surge by over 56% from its price during the May 1 retrace, propelling its market cap above its 2021 ATH to levels resembling March’s ATH. Nonetheless, some crypto analysts see the possibility of a meltdown ahead for Solana.
Crypto analyst Bluntz posted a video looking at SOL’s macro chart. Per the post, the analyst considers that “SOL is done, SOL is exhausted, and it’s probably time for ETH to catch up, which will probably be the last leg of the bull market.”
The analyst considers the macro chart to display some concerning signs that suggest the token has “probably topped.” Per Bluntz’s chart, SOL had a five-way climb to its cycle high of 0 in March. Despite not making the price ATH due to inflation, the analysts highlighted Solana’s market cap ATH as a key factor.
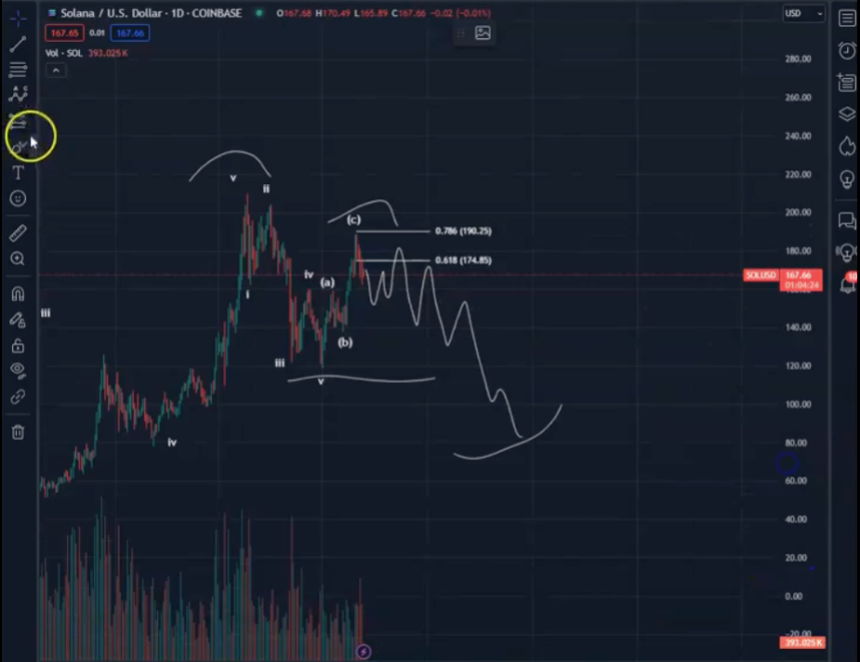
Moreover, the crypto trader pointed out a five-way decline since March’s highs, followed by a three-way move up. To the analyst, this suggests that Solana is “exhausted” as it’s starting to struggle.
According to Bluntz, there’s a high chance that the highlighted performance will result in a “macro lower high.” Additionally, he forecasted SOL’s price to retrace below the 0 mark.
Is Solana Poised For A Liftoff Or A Meltdown?
Similarly, pseudonym analyst Credible issued a warning regarding SOL’s future. To the analyst, “coins like $SOL are just in larger distribution structures now.” However, Credible considers that BTC’s strength will relieve SOL as it initially “drags the whole market up.”
The analyst agreed with Bluntz’s prediction, stating that it is “ultimately where we are headed,” but considers there’s a good chance Solana sees highs above March’s mark “before the real meltdown.”
Nonetheless, some crypto analysts disagree with the gloomy forecast. DocXBT asserted he has “seen a lot of terrible Solana takes lately.” The analyst believes the token is “holding daily trends” and displays positive support and resistance levels.
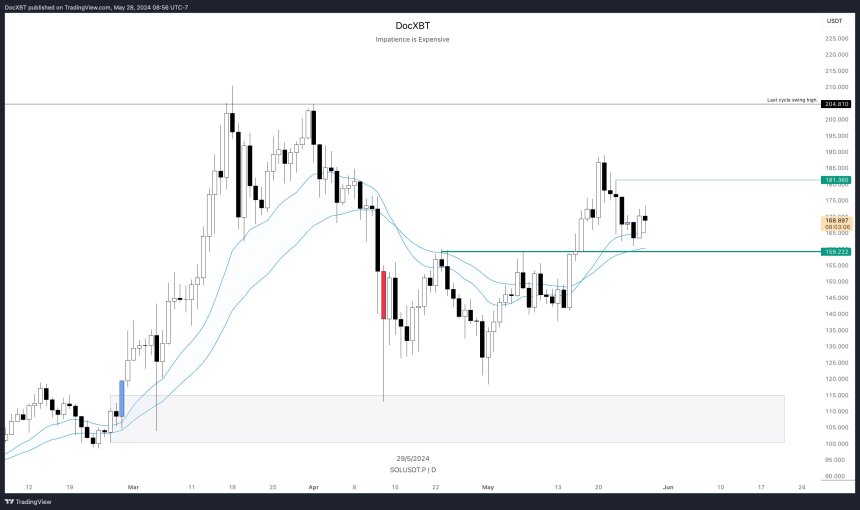
Moreover, he considers that investors should “stop overthinking it” unless “we lose daily trends” as the performance looks “supper clean.”
On a similar note, CryptoJelle pointed out that SOL is “forming the post-breakout higher low.” To the analyst, Solana is following the same behavior it did during the February-March leg.
Ultimately, Jelle suggests that the token could have found its bottom, and it’s currently getting ready for liftoff to a new ATH. The analyst forecasted a 0 price prediction for SOL this cycle.
Ethereum Deposits At 4-Month High: Whales Preparing For Selloff?
On-chain data shows that the Ethereum exchange netflow recently spiked significantly, a sign that could be bearish for the cryptocurrency’s price.
Ethereum Exchange Netflow Registered A Large Positive Spike Recently
In a new post on X, the market intelligence platform IntoTheBlock has discussed about the latest trend that has been occurring in the exchange netflow metric for Ethereum.
The “exchange netflow” here refers to an on-chain indicator that tracks the net amount of any given cryptocurrency entering into or exiting the wallets associated with centralized exchanges.
When this metric’s value is positive, it means that investors are depositing a net number of tokens on these platforms right now. Generally, one of the main reasons holders may transfer to the exchanges is for selling-related purposes, so this trend can have bearish implications for the asset’s price.
On the other hand, the negative indicator implies the exchanges are currently bleeding supply as outflows are outpacing the inflows. Such a trend may be a sign that the investors are accumulating, which can naturally be bullish for the coin.
Now, here is a chart that shows the trend in the Ethereum exchange netflow since the start of the year 2024:
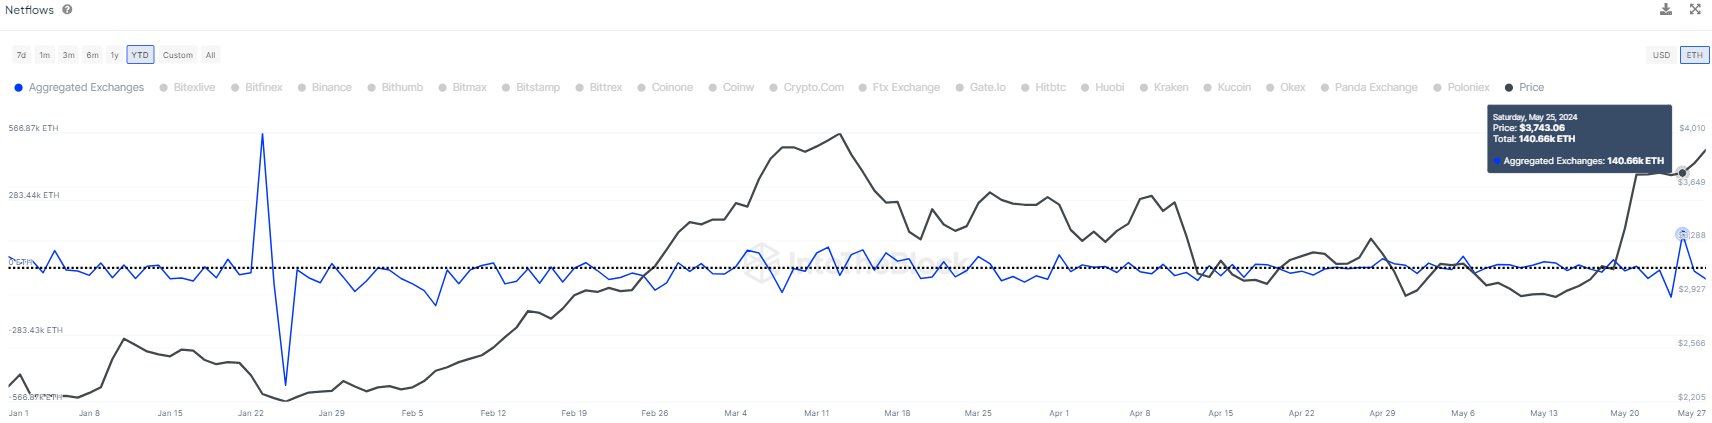
The graph shows that the Ethereum exchange netflow has registered a positive spike recently. At the height of this spike, the exchanges received 140,660 ETH in net deposits.
At the current price of the cryptocurrency, this amount is equivalent to almost 7 million. This is a huge amount and the largest net deposit spree these central entities have witnessed since January.
“High inflows to exchanges are typically a sign of selling behavior, as people either try to claim profits or succumb to FUD,” notes the analytics firm. Interestingly, though, since these deposits have come, the asset’s price has increased.
This could suggest that either the whales making the inflows haven’t pulled the trigger on selling these coins yet, or they never planned to sell to begin with. Of course, it’s also possible that the market demand has been able to absorb the selling if the whales have indeed sold.
In the scenario where the whales made the deposits with the intention of selling but haven’t made the trade yet, Ethereum could feel a bearish effect.
It now remains to be seen how the cryptocurrency’s price will develop in the coming days and if these large deposits will play any visible role at all.
ETH Price
Ethereum had seen a pullback earlier, but the asset has managed to make a recovery, as its price is now once again floating above the ,900 mark.
Altcoins ‘Maniac Phase’ Preparing, Analysts Call For Next Leg Up
The crypto industry has seen a positive shift with the recent market recovery. After a Q1 full of bullish sentiment, Q2 saw many sectors of the crypto space brewing a pessimistic feeling toward altcoins.
Experts and market watchers have reassured investors that the price corrections were part of the cycle, predicting that the bullish rally would resume after the cool-off. Now, analysts consider that altcoins are about to embark on a “massive leg higher” for the alt season.
Ethereum’s Surge Refuels Sentiment
The crypto market is up by 8.3%, with a market capitalization of .55 trillion. This market surge has seen Bitcoin, the flagship cryptocurrency, soar past ,000 in the last day.
Similarly, the “king of altcoins” remarkably performed these past 24 hours. Ethereum (ETH)’s price has risen 22% since yesterday, surpassing levels not seen since mid-March.
However, ETH is yet to test its all-time high (ATH) of ,878, set nearly two years ago. As a result, the second-largest cryptocurrency has been criticized this cycle for being “a major disappointment.”
In a turn of events, rumors of an approval of ETH spot Exchange-Traded Funds (ETFs) have refueled investors’ bullish tank, “erasing 65 days of down only” with a single daily candle.
As ETH rallies, analysts believe it’s only a matter of time before the whole altcoins sector surges to kick off the altcoin season. Crypto analyst Rekt Capital highlighted the ‘Crypto Money Flow Cycle’, stating that, now that BTC and ETH have rallied, “it’s time for Altcoins to rally.”
Is The Altcoins Season Here?
During the slowdowns, market watchers have analyzed altcoins’ run this cycle. Altcoin Sherpa has stated that many tokens didn’t “run that hard” during round 1 of the bull run, resulting in his forecast of a 1-4 months “cool-off” period before resuming the uptrend.
Despite the similarities with previous bull runs, the singularities of this cycle, like the approval of Spot Bitcoin ETFs and the Memecoin pre-sale frenzy, have made investors question whether they would see the alt season this time.
Nonetheless, several analysts, who urged investors not to panic before, suggest the community prepares for the “maniac phase” ahead. Crypto Yoddha shared his chart for the 2024 altcoin cycle, stating that the dip was “just a higher low in an uptrend.”

Per the chart, the altcoins market is now looking to retest the .27 trillion resistance level seen in March before testing last cycle’s .7 trillion ATH. To crypto Yoddha, “we’re looking at the bullish continuation” that will lead to a new market ATH during round 2.
Similarly, Top analyst Michaël van de Poppe, who recently sold all his BTC for Altcoins, stated that the Altcoin market capitalization has finished its correction:
The next step: reaching all-time high, which is ~60-70% from here.
I think #Ethereum is likely reaching that in the next 2-4 months.
Lastly, Crypto Jelle considers that “Altcoins are about to embark on a massive leg higher” after an 18-month accumulation period. The analyst compared the market’s recent breakout to a ball being held underwater, claiming that “it’s time for history to repeat.”

Despite Price Lull, Shiba Inu Burn Rate Heats Up: Are Investors Preparing For A Mega Rally?
In a fascinating twist for the Shiba Inu (SHIB) community, the rate at which SHIB tokens are being burned has increased significantly, even as the price of the meme coin shows modest gains.
Recent data from the Shibburn explorer indicates a 62.58% increase in the SHIB burn rate over the past 24 hours, with approximately 6.9 million SHIB tokens removed from circulation through 10 separate transactions.
Recent SHIB Burn Events And Market Response: A Detailed Analysis
Details of the 10 transactions show that the largest single burns were 2.55 million SHIB, 1.5 million SHIB, and 1 million SHIB, respectively.
In addition, over the last week, 57.6 million SHIB were burned, marking a nearly 57% decrease from the previous week, indicating a weekly burn rate in decline.
HOURLY SHIB UPDATE$SHIB Price: .00002383 (1hr -1.77% ▼ | 24hr -3.80% ▼ )
Market Cap: ,172,538,490 (-2.80% ▼)
Total Supply: 589,273,577,774,968TOKENS BURNT
Past 24Hrs: 6,985,600 (62.58% ▲)
Past 7 Days: 57,671,544 (-56.28% ▼)— Shibburn (@shibburn) May 20, 2024
Despite this aggressive approach to reducing supply recorded in the past day, Shiba Inu’s price has not mirrored the enthusiasm seen in the burn rate. Currently, SHIB has seen a modest increase, up by 0.1% over the last 24 hours and 1.6% over the past week.
This performance is less pronounced than that of other meme coins like PEPE, BOME, and FLOKI, which have seen increases of 11.6%, 8.9%, and 6.5%, respectively, over the same seven-day period.
Meanwhile, the total SHIB burned since the token’s inception now stands at approximately 410.73 trillion SHIB, a significant chunk of the initial quadrillion supply created by the anonymous founder Ryoshi in 2020.
The current circulating supply of Shiba Inu is around 582.99 trillion SHIB, with an additional 6.28 trillion SHIB locked in various staking platforms.
Shibarium’s Downturn and Bullish Predictions for Shiba Inu Price
On the other hand, the Shibarium layer-2 solution, designed to enhance Shiba Inu’s scalability and efficiency, is experiencing a slowdown in on-chain activity.
The daily transaction count has dropped to 11.91k, a sharp decrease of more than 90% from the 121.91k transactions recorded in the middle of last month.
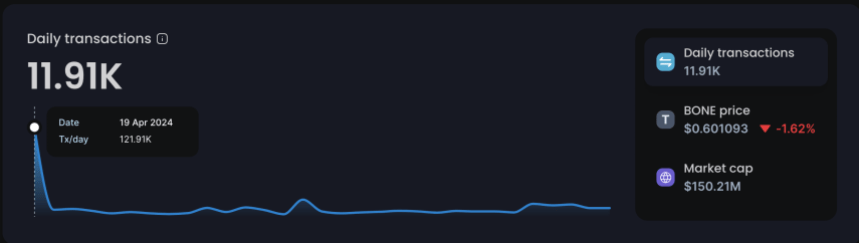
This blockchain platform’s total number of transfers has reached 417.50 million, with 1.8 million wallets currently connected.
Despite all these, crypto expert Dami Defi has shared an optimistic outlook for Shiba Inu’s price action. The analyst noted that the meme coin has formed a descending wedge pattern in the one-day timeframe.
According to Dami Defi’s analysis, a breakout from this pattern could potentially lead to a surge of over 50% in SHIB’s price, pushing it to around the .000035 level.
$SHIB formed a falling wedge pattern on the 1D time frame
If we breakout, a price pump of 50% + is expected
Memeseason continues. pic.twitter.com/kgA353oLZK
— Dami-Defi (@DamiDefi) May 15, 2024

Featured image created with DALL·E, Chart from TradingView
Robert Kiyosaki Advises Preparing for Depression — ‘For Years I Could See This Crisis Coming’
 Rich Dad Poor Dad author Robert Kiyosaki has advised preparing for an economic depression. He emphasized the importance of being ready for the worst, cautioning against the complacency prevalent among many who prefer to “live in Disneyland.” He added that he could see this crisis coming for years, which is why he has adopted a […]
Bitcoin News
AI Tokens ‘Preparing For Round 2’: Industry Shows 8% Growth With RNDR And FET
Excluding Bitcoin, memecoins were the biggest narrative of this cycle. However, Artificial Intelligence (AI) tokens also performed remarkably during the first quarter of 2024.
The crypto market recovered over the weekend from the May 1st retrace, with AI tokens showing significant gains. As a result, many industry experts think that the sector is poised for a ‘Round 2’ this cycle.
AI Sector Recovers By 8%
Crypto analysts highlighted AI tokens alongside memecoins as the hottest topic of 2024, responsible for most of the massive gains during this cycle.
According to CoinGecko’s report, AI was one of the three sectors that delivered three-digit returns in Q1. Moreover, the largest AI token by market capitalization, Fetch.ai (FET), saw gains of 378.3% during this period.
As a result, some analysts deem the AI sector to be the next main narrative of the cycle. Trader John Walsh, known as CryptoGodJohn, considers “The future of AI coins preparing round 2.”
Walsh added that the AI season is “extremely obvious” and will go “so much higher” based on the developments in the sectors, including Nvidia earnings, Apple AI, and Microsoft’s 0 billion AI fund.
To this, crypto analyst MacroCRG replied that a massive AI growth “will be obvious in hindsight,” considering that the sector’s market capitalization is “just” .3 billion.
AI mcap still just B
It will be obvious in hindsight https://t.co/HH0Tb86fNY pic.twitter.com/71qgdwdM1C
— CRG (@MacroCRG) May 6, 2024
According to a MacroCRG post, the AI market cap had increased 8% by Monday morning, and its daily trading volume was around .9 billion. On Tuesday, the market cap surged to .8 billion, a 2.3% increase from 24 hours ago.
In comparison, memecoins .4 billion market cap doubles AI’s. However, its market cap decreased by 2.8% in the last day, with the top ten memecoins showing red numbers in the past 24 hours.
Is Artificial Intelligence About To Bloom Or Ruin the World?
Despite the remarkable performance, some figures think the sector has a more pessimistic future. According to memecoin trader Murad, the developments in the industry will “be replacing more & more jobs every year.” As a result, there will be an increase in “Anxieties and desperate attempts to ‘make it.’”
To the trader, the industry will serve as a push for the memecoins sector, as “Growing AI capabilities will be one of the big forces accelerating the Memecoin Bubble.”
Financial giant Warren Buffett shared a more skeptical view on Saturday. The Co-founder and CEO of Berkshire Hathaway revealed he is not sold yet by artificial intelligence. To the CEO:
We let a genie out of the bottle when we developed nuclear weapons. AI is somewhat similar — it’s part way out of the bottle.
Despite this, Buffet recognized the potential for AI technology to change the world positively.
On The Brink Of A Millionaire Boom
“The AI industry is on the brink of a multi-trillion-dollar boom,” stated Alex Wacy. The analyst believes the reasons behind this are the vast and diverse potential of applications.
Moreover, the expert highlights that interest in the sector has steadily increased over the last year. A crypto and AI combination could potentially “create a market valued in the trillions.”
According to the post, the market is projected to reach nearly trillion by 2030, which suggests that the crypto industry should not overlook it.
Tokens like RNDR showed a remarkable performance over the past week, with the price soaring by 45%. RNDR regained the support zone this week after struggling to retest it over the last month.
In the past 24 hours, the token’s price surged 6.4%, and its daily trading volume increased by 16.8%, with over 5 million being traded.
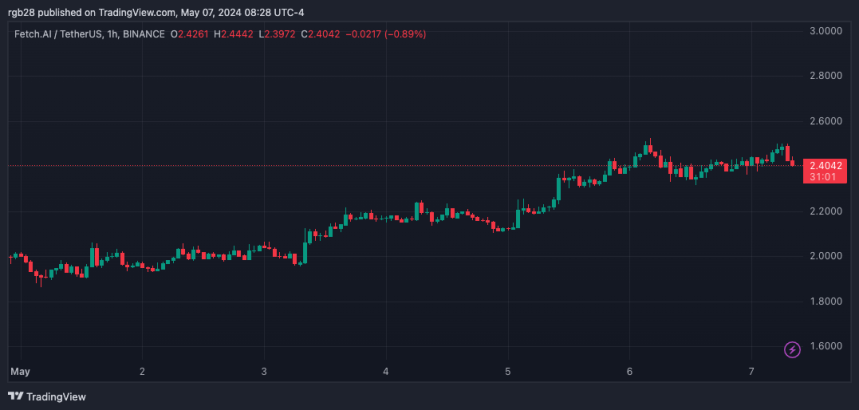
FET is “a top performing AI coin headed into the Nvidia earnings,” as stated by John Walsh. The trader forecast that the token is “looking for a next leg higher up” after successfully retesting the .35 resistance level.
$FET break retest now looking for next leg up higher
FET will be a top performing AI coin headed into the nvidia earnings pic.twitter.com/Agl0eqB9mD
— Johnny (@CryptoGodJohn) May 6, 2024
FET broke above this level over the weekend, rising to .5 on Monday and remaining above the .40 support zone since.
At writing time, the token is trading at .42, representing a 2.4% increase in the last 24 hours and a .9% surge in the past week.
PEPE Preparing For A 54% Move? Analyst Thinks So
An analyst has explained how a PEPE daily close outside of a certain price range could lead its value to go on a rally of 54%.
PEPE Symmetrical Triangle May Hint At The Next Move For The Memecoin
In a new post on X, analyst Ali discussed the recent trend forming in the PEPE price. According to the analyst, the memecoin is currently forming a symmetrical triangle pattern on its one-day chart.
The “symmetrical triangle” here refers to a pattern in technical analysis (TA) that, as its name suggests, looks like a triangle. In this pattern, there are two lines of interest between which the asset’s price consolidates for a period.
The upper line connects successive tops, while the lower one joins together bottoms. The main feature of the pattern is that these two lines approach each other at a roughly equal and opposite slope (hence the “symmetrical” in the name).
There are other triangle patterns in TA, but those have either differently angled lines (as is the case with wedges) or one line parallel to the time-axis (ascending and descending triangles).
Like other TA patterns that represent a consolidation phase, the lines of the symmetrical triangle also serve as a point of potential reversal for the price. The upper line usually offers resistance (meaning tops can occur), while the lower line may provide support (bottom formation).
When a break takes place from either of these lines, the price may likely see sustained momentum in that direction. This implies that a break above the triangle could be a bullish signal, while one below may be bearish.
The symmetrical triangle may be viewed as a phase of the market in which the bulls and bears are at a standstill, hence why the price is ranging sideways. During a break, one of these wins out, and price action follows in that direction.
Naturally, as the lines converge towards a center point in this pattern, a breakout becomes increasingly probable the closer to the apex of the triangle the asset’s price gets.
Now, here is the chart shared by Ali that highlights the symmetrical triangle pattern that PEPE has been trading inside recently:
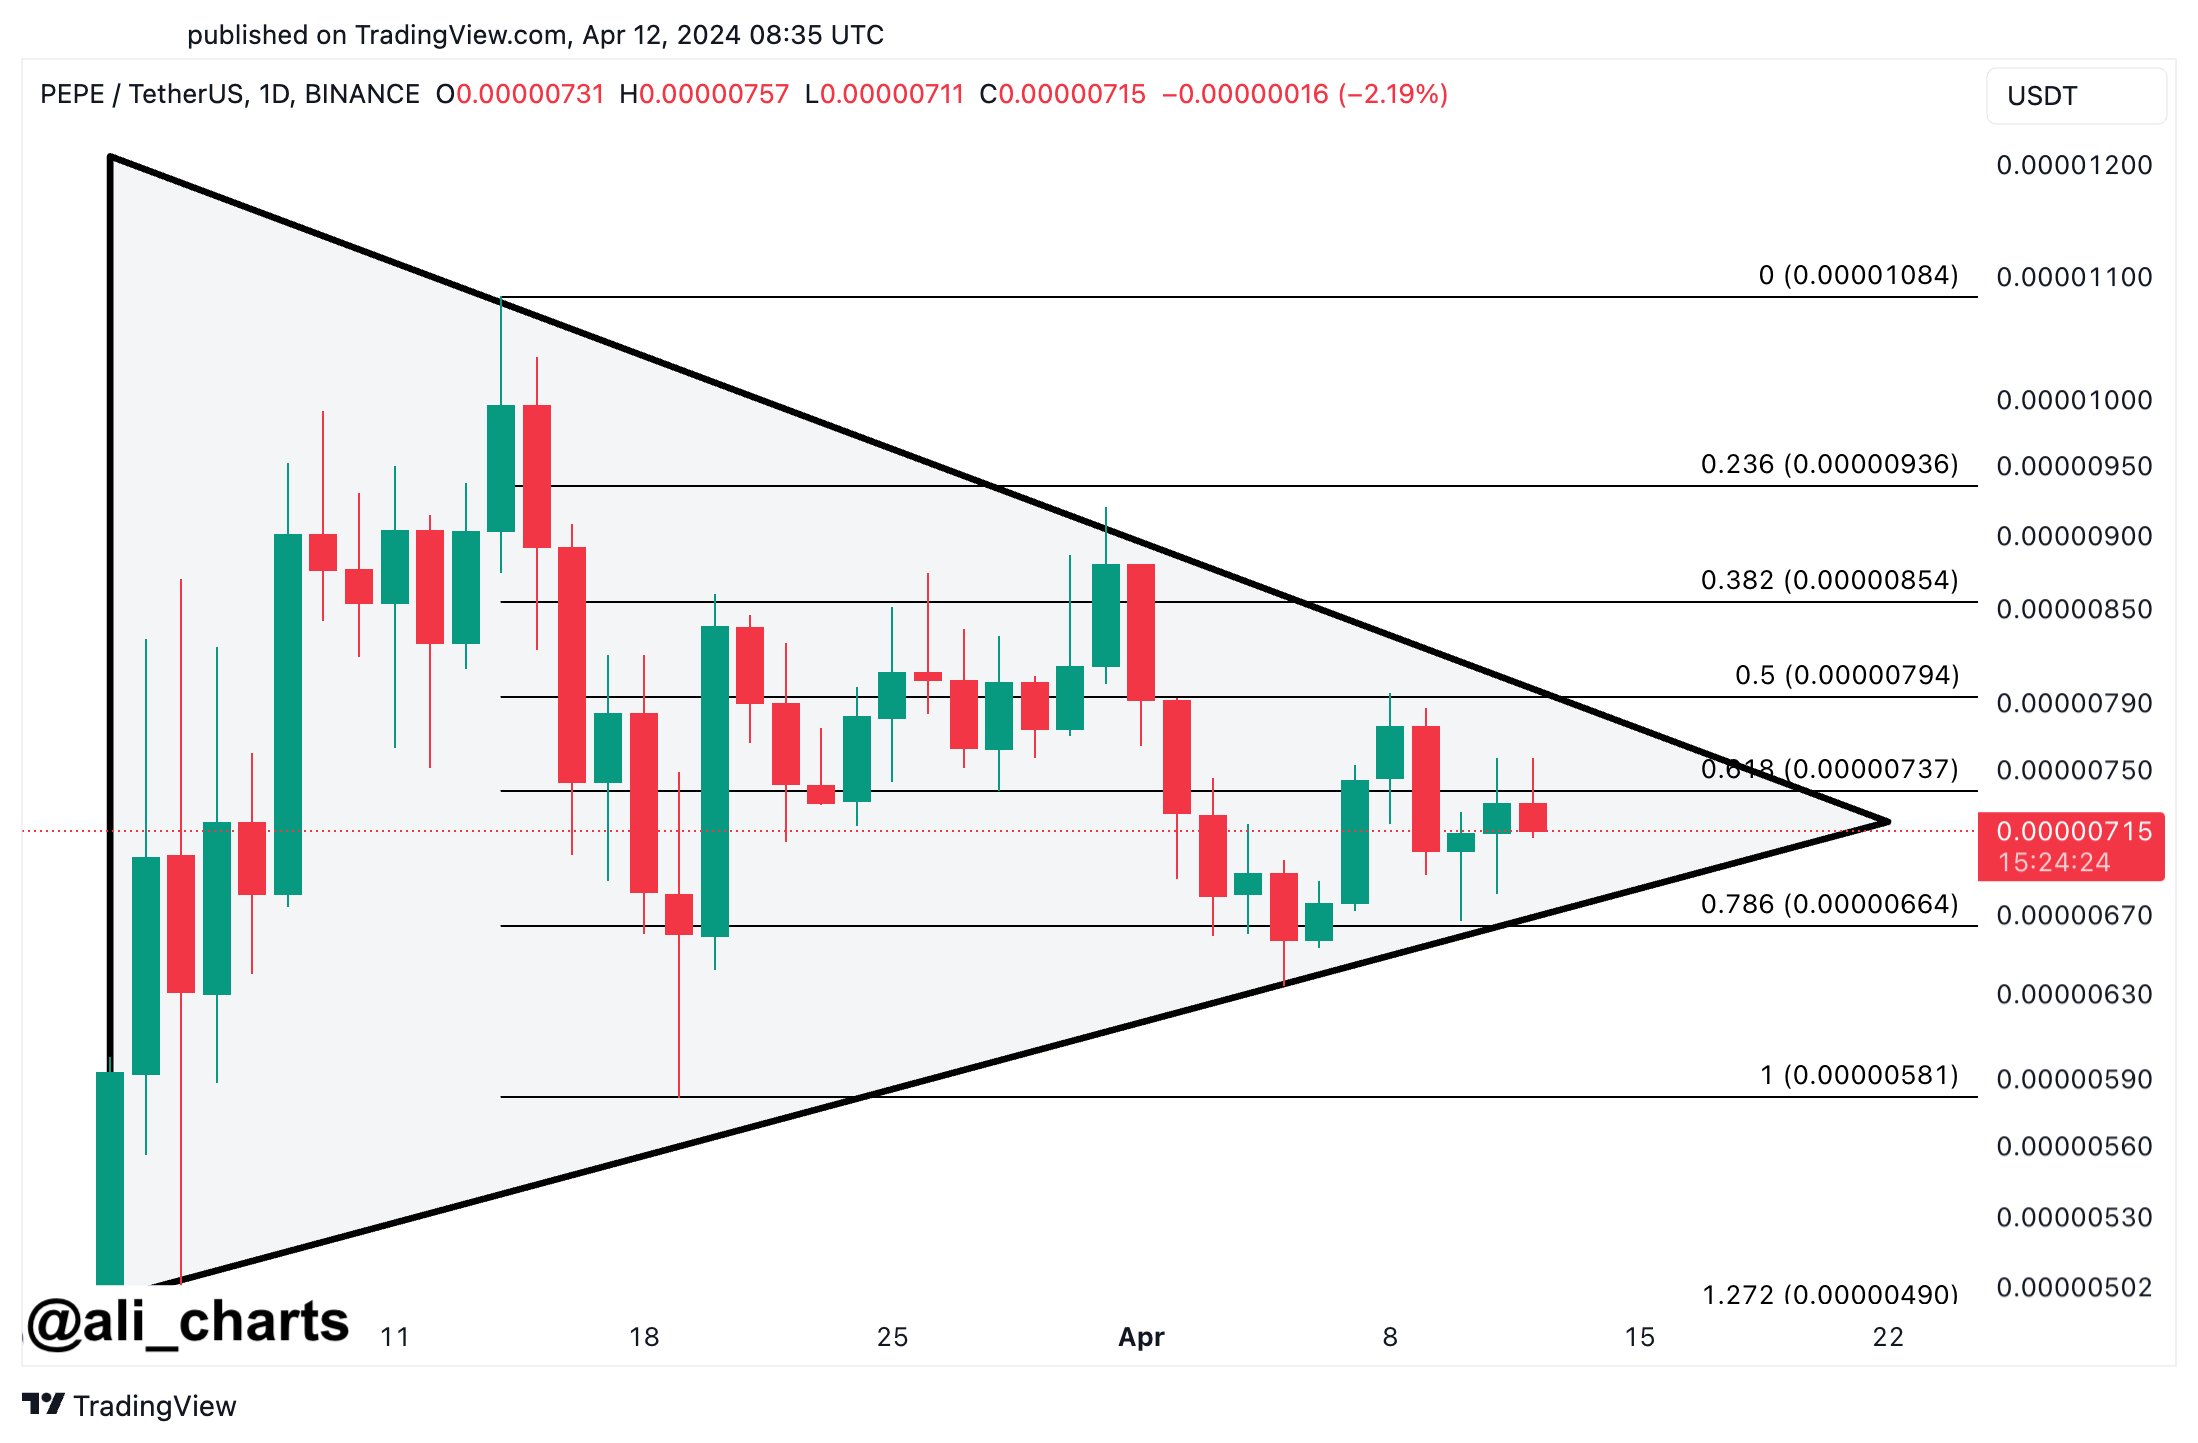
As is visible in the graph, the 1-day price of PEPE has been approaching the triangle’s apex recently, implying that a break in a direction may be coming for the memecoin.
“Watch out for a daily close outside of the .00000793 – .00000664 range, which could lead to a 54% move for PEPE,” explains the analyst. Given the pattern that has been forming, it now remains to be seen how the asset’s price will play out from here.
PEPE Price
At the time of writing, PEPE is trading around .000006868072, up 3% over the past week.
South Korea Preparing Tax System to Avoid Cryptocurrency Tax Evasion
 The National Tax Service in South Korea is preparing to launch a virtual asset tax system to help analyze the information received from cryptocurrency holders to avoid cryptocurrency tax evasion. Local sources reported that the agency had contracted the services of a third-party company to help in this task, and it is scheduled to be […]
Bitcoin News