 The world of finance is standing on the brink of a transformative era driven by the rising prominence of tokenized assets. According to a recent McKinsey & Company report, tokenization—the process of converting assets into digital tokens on a blockchain—has reached a tipping point, setting the stage for at-scale implementations that promise enhanced liquidity, operational […]
Bitcoin News
Dogecoin Bears Return: Indicators Point To More Losses In DOGE
Dogecoin started another decline from the .1285 resistance zone against the US Dollar. DOGE is consolidating and might resume its decline below .1220.
- DOGE price is moving lower below the .1250 support zone.
- The price is trading below the .1250 level and the 100-hourly simple moving average.
- There is a key rising channel or a bearish flag pattern forming with support near .1220 on the hourly chart of the DOGE/USD pair (data source from Kraken).
- The price must settle above .1260 and .1285 to gain bullish momentum and start a fresh increase.
Dogecoin Price Dips Again
After a decent recovery wave, Dogecoin price faced resistance near the .1285 zone. DOGE failed to continue higher and started a fresh decline from the .1285 high like Bitcoin and Ethereum.
There was a move below the .1250 support level and the 100-hourly simple moving average. The price dipped below the 23.6% Fib retracement level of the upward move from the .1129 swing low to the .1285 high. However, the bulls are now active near the .1220 zone.
Dogecoin is now trading below the .1250 level and the 100-hourly simple moving average. There is also a key rising channel or a bearish flag pattern forming with support near .1220 on the hourly chart of the DOGE/USD pair.
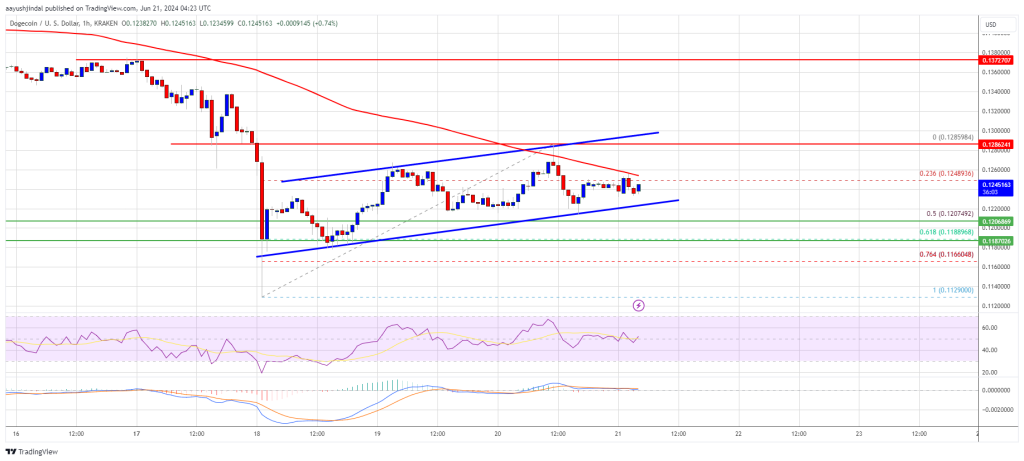
If there is a fresh increase, the price might face resistance near the .1260 level. The next major resistance is near the .1285 level. A close above the .1285 resistance might send the price toward the .1350 resistance. Any more gains might send the price toward the .1420 level. The next major stop for the bulls might be .150.
More Losses In DOGE?
If DOGE’s price fails to gain pace above the .1285 level, it could continue to move down. Initial support on the downside is near the .1220 level.
The next major support is near the .1185 level. If there is a downside break below the .1185 support, the price could decline further. In the stated case, the price might decline toward the .1120 level.
Technical Indicators
Hourly MACD – The MACD for DOGE/USD is now gaining momentum in the bearish zone.
Hourly RSI (Relative Strength Index) – The RSI for DOGE/USD is now below the 50 level.
Major Support Levels – .1220, .1185 and .1120.
Major Resistance Levels – .1260, .1285, and .1320.
Ethereum Price Decline: Market Indicators Point to More Dips
Ethereum price struggled to clear the ,650 resistance. ETH started another decline and there is now a risk of more dips below the ,420 support.
- Ethereum started a fresh decline below the ,550 support zone.
- The price is trading below ,540 and the 100-hourly Simple Moving Average.
- There is a crucial bearish trend line forming with resistance near ,550 on the hourly chart of ETH/USD (data feed via Kraken).
- The pair could extend losses if it stays below the ,550 resistance zone.
Ethereum Price Struggle Continues
Ethereum price failed to start a recovery wave above the ,550 and ,580 resistance levels, like Bitcoin. ETH remained in a short-term bearish zone and extended losses below the ,500 level.
The price declined below the ,450 support level. A low was formed at ,428 and the price is now consolidating losses. There was a minor increase above the 23.6% Fib retracement level of the recent decline from the ,655 swing high to the ,428 low.
Ethereum is still trading below ,550 and the 100-hourly Simple Moving Average. There is also a crucial bearish trend line forming with resistance near ,550 on the hourly chart of ETH/USD. If there is a fresh increase, the price might face resistance near the ,540 level and the 50% Fib retracement level of the recent decline from the ,655 swing high to the ,428 low.
The first major resistance is near the ,550 level and the trend line. An upside break above the ,550 resistance might send the price higher. The next key resistance sits at ,650, above which the price might gain traction and rise toward the ,720 level.
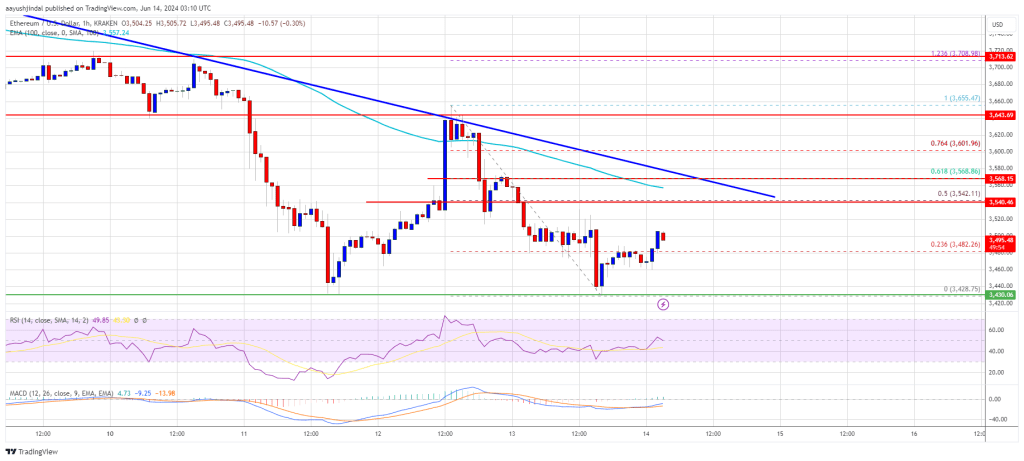
A clear move above the ,720 level might send Ether toward the ,800 resistance. Any more gains could send Ether toward the ,880 resistance zone.
More Downsides In ETH?
If Ethereum fails to clear the ,550 resistance, it could continue to move down. Initial support on the downside is near ,420.
A clear move below the ,420 support might push the price toward ,350. Any more losses might send the price toward the ,250 level in the near term.
Technical Indicators
Hourly MACD – The MACD for ETH/USD is losing momentum in the bearish zone.
Hourly RSI – The RSI for ETH/USD is now below the 50 zone.
Major Support Level – ,420
Major Resistance Level – ,550
Cardano (ADA) Headed For Reversal? Analyst Eyes $0.50 As Turning Point
Cardano (ADA), the smart contracts platform known for its meticulous development process, finds itself at a critical juncture. Analysts are split on the cryptocurrency’s immediate future, with some predicting a bullish breakout and others bracing for a bearish correction.
Analyst Buckles Up For A Reversal
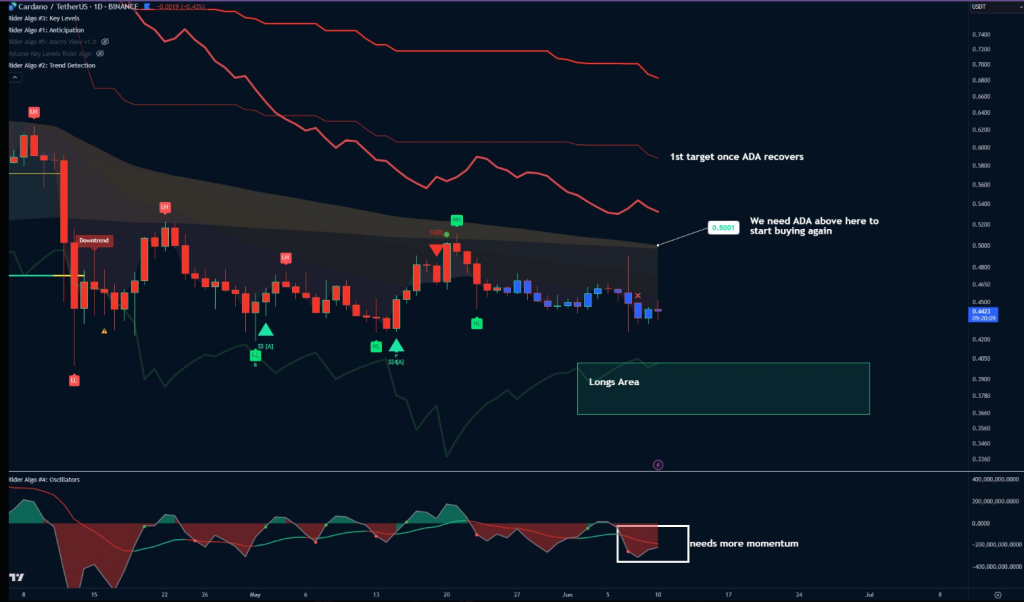
One analyst, known by the moniker Trend Rider, has taken an optimistic stance. They’ve identified a technical pattern suggesting a potential trend reversal for ADA. This pattern involves an initial price surge followed by a pullback, a scenario mirrored by several other cryptocurrencies recently.
$ADA had a brief pump and then corrected, just like all other coins.
Based on the facts, I see it lacks momentum. On the chart, I’ve marked the key levels:
Zone for longs: .36–.40
Key price to start reversing the trend: .50
Note: Daily Timeframe pic.twitter.com/3fH7xI08Ke
— Trend Rider (@TrendRidersTR) June 10, 2024
Trend Rider believes a key breakout point lies at .50. Surpassing this level could signal a significant shift in momentum, potentially ushering in a new uptrend for ADA. Furthermore, they’ve identified a buying zone between .36 and .40, suggesting this could be a favorable entry point for investors seeking long positions.
Analyst Averages Offer Tentative Midpoint
Adding another layer to the complexity is the average price prediction from various crypto analysts. These predictions collectively suggest an average price of .422 for ADA in June 2024, with a range between .405 and .439. This midpoint prediction positions ADA precariously close to its current price, offering little guidance for investors seeking decisive direction.
ADA Price Forecast
The current analysis of Cardano (ADA) indicates a potential price increase of 5.00%, potentially reaching .446851 by July 12, 2024. Despite this optimistic price projection, the technical indicators suggest a bearish market sentiment.
This is further corroborated by the Fear & Greed Index, which currently reads 72, signifying a state of greed in the market. Over the past 30 days, Cardano has experienced a moderate level of volatility at 3.52%, and only 40% of those days have been positive, indicating limited bullish momentum.
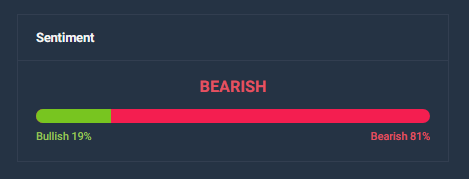
Given the prevailing market conditions and sentiment indicators, it appears that now is not an opportune time to invest in Cardano. The bearish sentiment and high greed level suggest a potential market correction or increased risk of downside volatility. Investors might consider waiting for a more favorable market environment or clearer bullish signals before entering a position in Cardano.
Ultimately, the fate of ADA’s price hinges on a confluence of factors beyond the realm of pure technical analysis. Regulatory developments, institutional adoption, and broader market sentiment will all play a role in shaping ADA’s trajectory.
Featured image from Goodwood, chart from TradingView
Experts Say Dollar Dominance Debate Misses the Point, US Needs Economic Focus
 Two experts have explained that the global debate on the future of dollar dominance misses the point because it doesn’t focus on how the dollar’s future will evolve. They warned: “If the U.S. doesn’t keep its house in better order, dollar dominance will be the least of our worries.” Experts Discuss US Dollar’s Dominance Steven […]
Bitcoin News
The Half-Million Dollar Bitcoin: Predictions Point To Monumental Price Surge In 18 Months
Bitcoin (BTC), the largest cryptocurrency in the market, recently touched the crucial ,000 level, proving to be a significant hurdle for its price consolidation in recent months.
Despite surpassing its previous high and reaching a record all-time high (ATH) of ,700 in March, BTC experienced a 20% price correction to around ,500 at the beginning of May. However, this correction marked the start of a renewed bullish momentum, with BTC currently trading at approximately ,300.
While Bitcoin’s price has seen some volatility and a lack of sustained bullish action, venture capitalist and market expert Chamath Palihapitiya has provided optimistic predictions for the cryptocurrency’s future.
Bitcoin Price And Halving Analysis
In a recent episode of the All In Podcast, Palihapitiya analyzed BTC’s historical patterns about the Halving event, which occurs approximately every four years and reduces the block reward given to miners.
The venture capitalist noted that after a Halving, investors typically spend the first three months reassessing the price and the overall market situation. However, significant price appreciation has historically occurred within six to 18 months.
To support his analysis, Palihapitiya referred to the previous Halving events. For further context, the first Halving took place on November 28, 2012, reducing the block reward from 50 BTC to 25 BTC. At the time of the Halving, Bitcoin was priced at , and within a year, it peaked at ,152.
The second Halving occurred on July 16, 2016, reducing the block reward to 12.5 BTC. Bitcoin’s price at that time was 4, and within a year, it peaked at ,760.
The most recent Halving occurred on May 11, 2020, reducing the block reward to 6.25 BTC. During that halving, Bitcoin was priced at ,734, and within a year, it reached an all-time high of ,000.
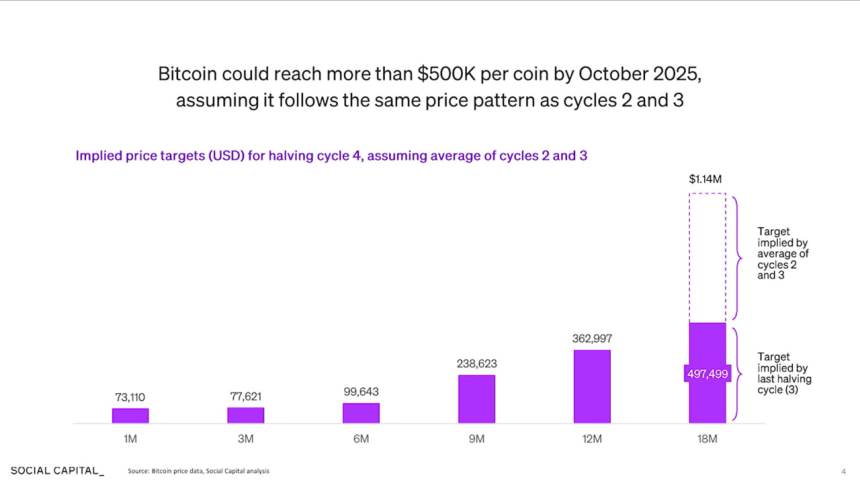
Based on these historical patterns and applying the average increases from previous Halvings, Palihapitiya suggests that if Bitcoin continues to follow its performance from the last market cycle, it could skyrocket to around 0,000 by October 2025, as seen in the chart above.
Notably, the expert believes that as Bitcoin’s value appreciates to such levels, it has the potential to replace gold and serve as a transactional utility for hard assets. This scenario, combined with concerns about the debasement of fiat currencies, presents intriguing opportunities for Bitcoin’s future.
Increased Demand For BTC?
Palihapitiya further argued during the interview that as more countries adopt a dual-currency approach, with Bitcoin being recognized as a valuable asset alongside their local currency, the demand for Bitcoin will increase.
This shift would only occur as people recognize the need for Bitcoin in daily transactions for goods and services and as a store of value for permanent assets.
Overall, Palihapitiya’s analysis of Bitcoin’s historical patterns following the Halving events provides an optimistic outlook for the cryptocurrency’s price.
The potential for Bitcoin to reach 0,000 by October 2025 and its growing recognition as a dual-currency asset alongside fiat currencies offers renewed prospects for investors and the broader cryptocurrency market.
Featured image from DALL-E, chart from TradingView.com
XRP Price Nears Major Converging Point: Analyst Predicts 3,600% Jump To $20
A crypto analyst has predicted the next price target for the XRP price, noting that the altcoin was nearing a key point that could potentially trigger a major bull rally for the cryptocurrency.
XRP Price Roadmap to
In an X (formerly Twitter) post on May 20, Crypto analyst, Javon Marks forecasted a strong bullish breakout for the XRP price in this market cycle. Marks explained that XRP was steadily approaching a critical converging point, with an emerging Relative Strength Index (RSI) pattern indicating strong underlying momentum for the cryptocurrency.
An RSI is a technical tool used to measure the speed and change of price movements in a cryptocurrency. It is also used to determine the short-term momentum of a cryptocurrency’s market.
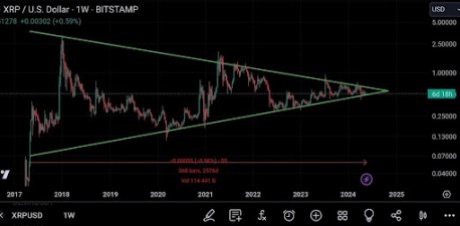
Sharing a price chart depicting the XRP price movements from 2018 to 2025, the analyst predicts that XRP’s closing converging point and RSI pattern are signaling a massive breakout to new all-time highs. He has projected a “conservative” target that could see XRP’s price soaring between and in the coming weeks.

Additionally, XRP’s present price actions are displaying a bullish pattern reminiscent of the one observed during its mega rally to a new all-time high of .84 in January 2018. Marks noted that for XRP to reach the ambitious price target, the cryptocurrency would have to witness a massive surge of 2,000% to 3,000%, translating to 20X to 36X from its current price.
Concluding his analysis, the crypto analyst disclosed that all the factors and indicators were pointing towards a potential rise in XRP’s price. However, the exact timing of when this will occur is uncertain.
More Bullish Projections For XRP
XRP has been drawing significant attention from market analysts, who are projecting increasingly bullish price movements for the cryptocurrency. Despite its struggles to reach the coveted , the XRP price has still exhibited some strength as it continues to maintain a price position around the .5 mark.
Prominent XRP supporter and crypto analyst identified as ‘JackTheRippler,’ on X predicts that XRP is poised for an explosive rally after years of accumulation. Sharing a price chart illustrating XRP’s price action from 2017 to 2024, the crypto analyst revealed indicators that suggested a potential rise to new highs.
Another XRP community member and crypto analyst identified as ‘XRP Captain,’ has also confirmed a potential breakout for the cryptocurrency. He disclosed that XRP’s next target will likely be .7 before June 2024.
At the time of writing, XRP’s price is trading at .53, marking a decline of 1.06% in the last 24 hours, according to CoinMarketCap. Over the past seven days, the cryptocurrency has performed relatively well, recording a series of minor rallies that contributed to a 6.67% gain.
A bullish breakout for XRP will require sustained momentum and increased trading activities from investors. Currently, the cryptocurrency’s daily trading volume has not demonstrated significant growth, indicating only a slight increase of 3.25% in the last 24 hours.
Ethereum Bulls On The Rise? Crucial Indicator Point To A Major Upturn
Ethereum (ETH), the second-largest crypto by market capitalization, has recently shown signs that suggest a potential rebound is on the horizon.
Analysts have been closely monitoring various technical indicators, and one such analyst, Ali, has highlighted a key signal that points to an impending price surge.
TD Sequential Signals Buy As Ethereum Eyes Recovery
According to Ali’s social media platform X analysis, the TD Sequential indicator on Ethereum’s daily chart has issued a strong buy signal, hinting at a possible upward movement lasting one to four candlesticks.
The TD Sequential presents a buy signal on the #Ethereum daily chart! It anticipates that $ETH could see a rebound of one to four candlesticks. pic.twitter.com/Vg7FTl9X2a
— Ali (@ali_charts) May 15, 2024
This positive outlook is supported by Ethereum’s recent performance, which increased the asset by 2.3% over the last 24 hours.
However, Ethereum remains below the critical ,000 mark. Despite the optimistic technical signals, external factors such as regulatory challenges could influence Ethereum’s trajectory.
Specifically, the potential decline of the spot Ethereum ETF application with the US Securities and Exchange Commission (SEC) is a concern, as analysts like Eric Balchunas of Bloomberg suggest that the SEC’s view of ETH as a security could significantly lower the chances of ETF approval.
TLDR: the SEC asked commenters re the Eth spot ETFs whether these filers have properly filed their ETF listing proposals as commodities. This shows the SEC is perhaps considering to Eth is a security in their denial. Our odds of approval remain the same: slim to none. Nice job of… https://t.co/g9HGPzGyOp
— Eric Balchunas (@EricBalchunas) May 14, 2024
Market Sentiments And Options Trading Trends
While the regulatory landscape presents challenges, market sentiment around Ethereum remains largely bullish. The options market, in particular, shows a clear preference for calls over puts, indicating that traders are betting on Ethereum’s price increase.
Data from Deribit, a leading crypto options exchange, reveals that the most popular strike price among these bullish bets is an ambitious ,500.
This concentration of call options, especially those above the ,600 mark, suggests that a significant portion of the market expects Ethereum to reach higher levels by the end of June.
In contrast, According to a recent NBTC analysis, Ethereum’s failure to breach the ,925 resistance level could trigger another price decline. Initial support is located near the ,880 level, followed by major support at the ,860 zone.
Should Ethereum break below ,810, it could potentially fall towards the ,740 mark, and further losses might push the price down to ,650 in the near term.
Featured image from Unsplash, Chart from TradingView
Byte Federal Launches Point of Sale System for Merchants Seeking to Accept Bitcoin
 PRESS RELEASE. Byte Federal, a leading company in the global financial technologies space, is proud to announce the official launch of its point of sale (POS) system, ByteConnect. This product launch marks a significant expansion of Byte Federal’s “fintech focused” services, showcasing a commitment to building a full suite of financial tools for economic freedom. […]
Bitcoin News
Ethereum Price Stays Bullish As Indicators Point To Fresh Upside
Ethereum price is signaling positive moves above the ,550 zone. ETH could gain bullish momentum if it clears the ,650 resistance zone in the near term.
- Ethereum started another increase from the ,500 support zone.
- The price is trading above ,550 and the 100-hourly Simple Moving Average.
- There is a key bullish trend line forming with support at ,550 on the hourly chart of ETH/USD (data feed via Kraken).
- The pair could gain bullish momentum if it settles above the ,650 resistance zone.
Ethereum Price Could Accelerate Higher
Ethereum price remained strong above the ,500 zone. ETH formed a base and recently started a fresh increase above the ,600 resistance zone, like Bitcoin.
However, the bears are still active near the ,650 and ,680 resistance levels. A high was formed near ,654 and the price is now consolidating gains. It moved a few points lower and traded below the 23.6% Fib retracement level of the upward move from the ,491 swing low to the ,654 high.
Ethereum is still trading above ,550 and the 100-hourly Simple Moving Average. There is also a key bullish trend line forming with support at ,550 on the hourly chart of ETH/USD. The trend line is close to the 61.8% Fib retracement level of the upward move from the ,491 swing low to the ,654 high.
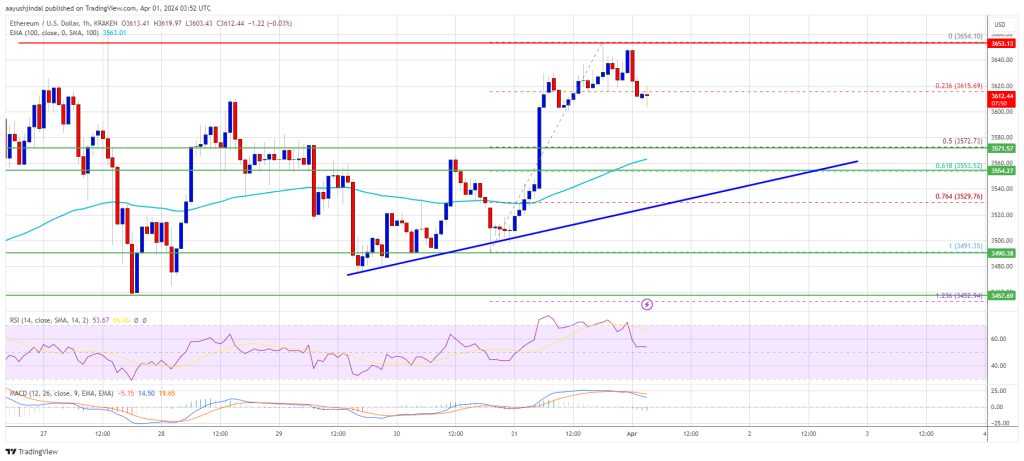
Source: ETHUSD on TradingView.com
On the upside, immediate resistance is near the ,630 level. The first major resistance is near the ,650 level. The next key resistance sits at ,680, above which the price might gain bullish momentum. In the stated case, Ether could rally toward the ,800 level. If there is a move above the ,800 resistance, Ethereum could even climb toward the ,880 resistance. Any more gains might call for a test of ,000.
Are Dips Limited In ETH?
If Ethereum fails to clear the ,650 resistance, it could start another decline. Initial support on the downside is near the ,600 level.
The first major support is near the ,575 zone. The next key support could be the ,550 zone and the trend line. A clear move below the ,550 support might send the price toward ,440. Any more losses might send the price toward the ,320 level.
Technical Indicators
Hourly MACD – The MACD for ETH/USD is losing momentum in the bullish zone.
Hourly RSI – The RSI for ETH/USD is now above the 50 level.
Major Support Level – ,550
Major Resistance Level – ,650