 The Bitcoin mining industry has come a long way since the days when block rewards were 25 or even 50 BTC, and individuals had a high chance of success using just a single PC to solve blockchain “puzzles.” Today, the competition to mine the next block is intense, with large mining enterprises predominantly dominating the […]
Bitcoin News
Cardano Holds Strong After DDoS Attack: Market Outlook Turns Bullish For ADA
The Cardano network recently faced a distributed denial of service (DDoS) attack, a malicious attempt to disrupt its operations. However, the mechanisms and decentralized structure of Cardano effectively mitigated the attack, ensuring uninterrupted stability and operation.
This display of resilience has garnered praise from bullish investors and renewed confidence in the price appreciation prospects of Cardano’s native token, ADA.
DDoS Attack Propels Bullish Sentiment
Jaromir Tesar, an industry expert, highlighted that most services, including SundaeSwap, which processed many orders, continued to operate effectively during the attack.
The attacker incurred transaction fees, resulting in financial losses without causing significant disruption. According to Tesar, this incident demonstrates Cardano’s ability to withstand and thwart malicious activities, establishing it as a winner in terms of network resilience.
In an in-depth analysis of Cardano’s security, Tesar highlights the complexity of executing a DDoS attack on the network when compared to traditional client-server networks.
Cardano’s distributed structure includes numerous nodes, each with its own memory pool, making simultaneous attacks on multiple nodes challenging. Unlike centralized systems, where attacks are directed at a limited number of servers, Cardano’s design distributes the network load across its nodes, making it much more resilient.
Within Cardano’s ecosystem, each block-producing node maintains a mem-pool, which acts as a waiting room for transactions before they are included in a block. Transactions are processed on a first-come, first-served basis, passing through relay nodes and diffusing to other block-producing nodes.
Lastly, Tesar noted in its analysis that the demand-driven protocol of Cardano allows nodes to manage their data rate, concurrency, and data volume, thereby preventing overwhelming resource consumption. This protocol protects both parties involved in transaction transfers, mitigating the risk of resource consumption attacks.
Cardano Season Begins?
Dan Gambardello, founder of Crypto Capital Venture, highlighted the top-tier security measures and decentralized design of Cardano as key reasons for his bullish sentiment.
The ongoing attack showcased Cardano’s ability to handle such situations as intended. Interestingly, the attacker’s funds were exposed in the process and are now essentially being used to fund Cardano’s development, reinforcing the network’s resilience.
As “Cardano season” begins, Gambardello said, with anticipation and excitement surrounding the network growing, the recent DDoS attack serves as a testament to the strength and reliability of the Cardano ecosystem.
Its security measures, decentralized architecture, rapid response from developers and users, and the exposure of attackers’ funds have added to the bullish sentiment surrounding Cardano’s prospects, Gambardello concluded.
ADA Price Analysis
After experiencing a sharp correction that led to ADA’s price plummeting to a yearly low of .356 over the weekend, the cryptocurrency has regained the .392 level.
Currently, it is setting its sights on overcoming the .400 resistance, expecting a potential price increase to bridge the gap between its current value and the yearly high of .811 achieved in March.
Adding to the positive outlook for ADA’s price, technical analyst Ali Martinez recently identified a buy signal on ADA’s daily chart, indicated by the TD Sequential indicator. This signal anticipates a price rebound for the altcoin.
Nevertheless, it is crucial for ADA to successfully surpass its current resistance at .400 to continue recovering from the losses incurred in recent months. The next significant resistance level on the daily chart is at .439.
It remains to be seen if network developments and a general market recovery can lift the price of ADA to previously lost levels and start a new uptrend to surpass the milestone.
Featured image from DALL-E, chart from TradingView.com
Solana (SOL) Dives Nearly 10%: Market Reactions and Future Outlook
Solana failed to climb above the 5 resistance. SOL price started another decline, dropping nearly 10%, and now the bears aim for more downsides.
- SOL price remained in a bearish zone below the 2 resistance against the US Dollar.
- The price is now trading below 0 and the 100-hourly simple moving average.
- There is a connecting bearish trend line forming with resistance at 0 on the hourly chart of the SOL/USD pair (data source from Kraken).
- The pair could extend losses if there is a close below the 2.50 support zone.
Solana Price Takes Hit
Solana price attempted a recovery wave above the 2 level. However, SOL bears defended upsides above the 5 level and the price started another decline like Bitcoin and Ethereum.
There was a drop below the 0 and 5 support levels. A low was formed at 3.24 and the price is currently trading in a downtrend. There is also a connecting bearish trend line forming with resistance at 0 on the hourly chart of the SOL/USD pair.
Solana is now trading below 0 and the 100-hourly simple moving average. If there is a recovery wave, the price might face resistance near the 6.50 level or the 23.6% Fib retracement level of the downward move from the 6.65 swing high to the 3.24 low.
Immediate resistance is near the 8.50 level. The next major resistance is near the 0.00 level or the trend line. It is close to the 50% Fib retracement level of the downward move from the 6.65 swing high to the 3.24 low.
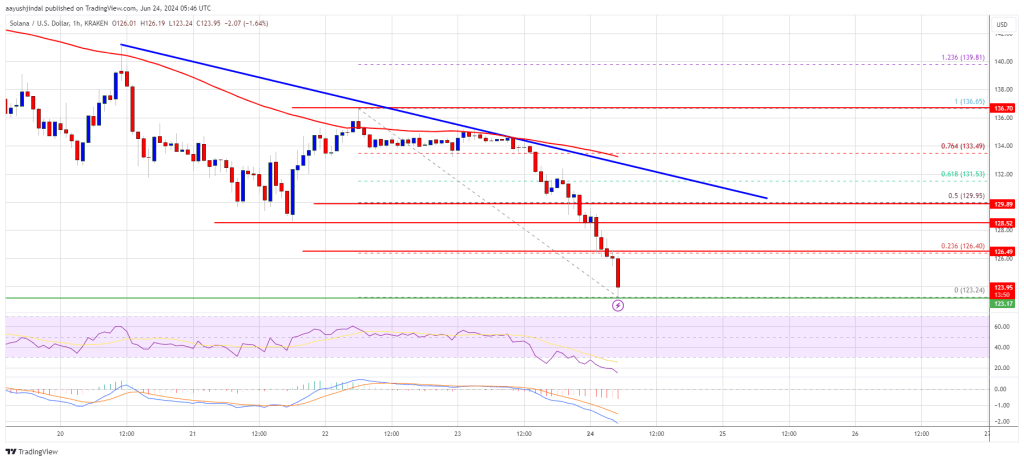
A successful close above the 0.00 resistance could set the pace for another steady increase. The next key resistance is near 2.50. Any more gains might send the price toward the 6.50 level.
More Losses in SOL?
If SOL fails to recover above the 0.00 resistance, it could start another decline. Initial support on the downside is near the 3.50 level.
The first major support is near the 2.00 level, below which the price could test 0.00. If there is a close below the 0.00 support, the price could decline toward the 2.50 support in the near term.
Technical Indicators
Hourly MACD – The MACD for SOL/USD is gaining pace in the bearish zone.
Hourly Hours RSI (Relative Strength Index) – The RSI for SOL/USD is below the 20 level.
Major Support Levels – 2.00, and 0.00.
Major Resistance Levels – 6.50, 0.00, and 2.50.
Bitcoin Buoyed By Big Money: Whales Gobble More BTC, Signaling Bullish Outlook
Bitcoin (BTC) finds itself in a curious position, caught in a tug-of-war between the bullish conviction of whales (large investors) and the jittery hands of short-term holders. The world’s top cryptocurrency recently surged to within a hair’s breadth of its all-time high, fueled by a buying spree from whales. However, lurking beneath the surface are potential threats that could derail this rally.
Whale Appetite Increasing
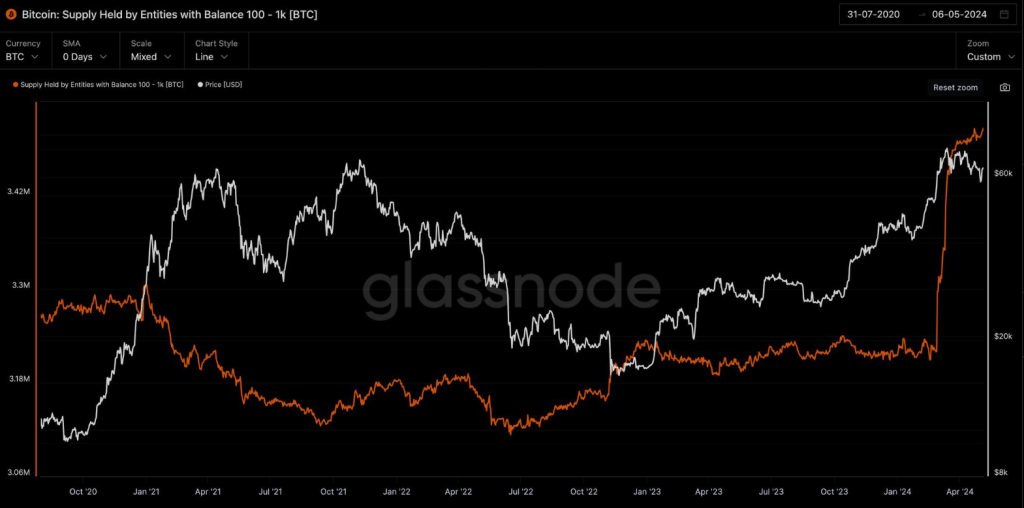
Big investors have been accumulating Bitcoin at an alarming rate, close to billion worth per day according to some estimates. This insatiable appetite suggests a strong belief in Bitcoin’s long-term potential. Analysts point to this whale activity as a bullish indicator, fueling optimism that Bitcoin can break past its previous highs of around ,000.
While you are scared, whales are buying #Bitcoin like never before. pic.twitter.com/QAVXpdWER4
— Vivek
(@Vivek4real_) June 8, 2024
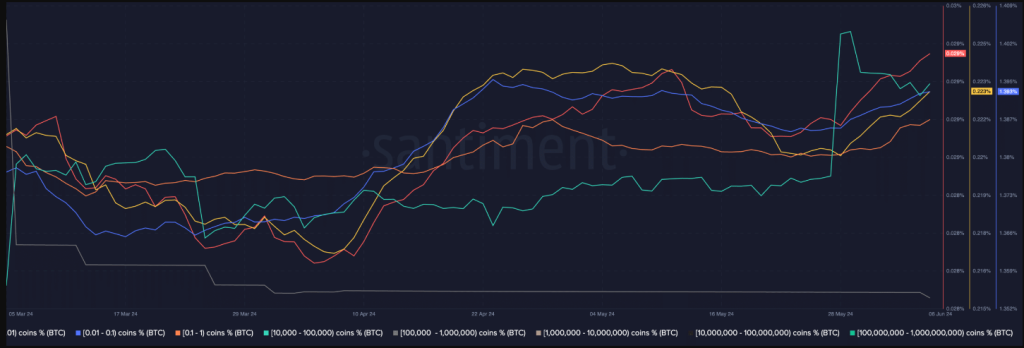
The sentiment isn’t isolated to the big leagues. Retail investors, the average person on the street, are also joining the party. The number of addresses holding between 0.01 and 1 BTC has increased, indicating a broadening of interest in the cryptocurrency. This confluence of whale and retail investor enthusiasm, representing millions of users, could propel Bitcoin to new heights.
Profit Taking And Short-Term Jitters
As the price climbs, a double-edged sword emerges – the MVRV ratio. This metric indicates how much profit holders are sitting on. With Bitcoin nearing its peak, the MVRV ratio has climbed significantly, suggesting many investors are now in profit territory. This profitability can be a blessing and a curse. The allure of locking in gains could entice some holders, potentially millions based on address growth, to sell, creating downward pressure on the price.
Related Reading: Cardano Bloodbath? Sell-Off Raises Fears Of Imminent ADA Price Drop
Bitcoin Miners Feeling The Squeeze
Adding another layer of uncertainty is the plight of Bitcoin miners. These digital miners dedicate significant computational power to verifying Bitcoin transactions and are rewarded with newly minted coins. However, recent times have seen a decline in miner revenue, with some reports suggesting a drop from .48 million to million in just a few days.
If this trend continues, miners may be forced to sell their Bitcoin holdings to stay afloat. This influx of additional coins on the market could further exacerbate selling pressure and hinder the current rally.
Bitcoin Price Prediction
Meanwhile, according to the latest Bitcoin price prediction, Bitcoin is expected to rise by 28%, reaching ,300 by July 10, 2024. The market sentiment is bullish, supported by a Fear & Greed Index reading of 72, indicating strong greed. Additionally, Bitcoin has recorded 16 green days out of the last 30, showing a consistent upward trend with a 4.16% price volatility over the same period.
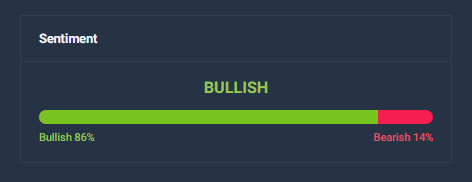
The high number of green days and manageable volatility levels suggest a stable market, reinforcing the bullish outlook. This environment appears conducive to further price increases, aligning with the prediction of a significant rise. The sentiment indicators and recent price performance both point to continued optimism among investors.
Featured image from Treehugger, chart from TradingView
Bullish Outlook: Target Price Of $90,000 For Bitcoin By Year’s End, According To Bernstein
Bitcoin (BTC), the largest cryptocurrency in the market, has experienced price volatility amid its struggle to consolidate above the crucial ,000 resistance line. Recent reports of the collapsed Mt.Gox exchange processing payouts to its creditors have added to the cautious sentiment.
However, wealth management firm Bernstein remains bullish, predicting significant growth in the Bitcoin ETF market and projecting higher price targets for BTC.
In addition, The Birb Nest’s technical analysis reinforces market optimism, highlighting key support levels and indicating positive sentiment.
Long-Term Bullish Outlook For Bitcoin
Despite its recent inability to breach the ,000 resistance level, Bitcoin remains well-positioned to surpass its all-time high of ,700 reached on March 14. Wealth management firm Bernstein predicts substantial growth in the Bitcoin ETF market, estimating it to reach a remarkable 0 billion.
The report also suggests that over 0 billion will flow into crypto ETFs within two years. Notably, these inflows into the ETF market are expected to be a significant price catalyst for BTC. The firm predicts a target price of ,000 for Bitcoin by the end of this year and a projected cycle high of 0,000 in 2025.
On the other hand, The Birb Nest, a trading firm, conducted a comprehensive technical analysis of the Bitcoin market and highlighted its share of bullish indicators for the Bitcoin price in the long run.
Bullish Indicators Reinforce Market Optimism
The analysis conducted by The Birb Nest shows that the 50-week and 200-week simple moving averages (SMAs) are at ,950 and ,358, respectively, reinforcing optimism in the market. In addition, the 7-week SPX correlation coefficient is currently at 0.36, which is a bullish sign for BTC.
The 200-day Bitcoin Production Cost (BPRO) trend support is ,580, while the 200-day SMA support is ,516. The Relative Strength Index (RSI) is at 59, indicating increased buying interest, although the 50-day Momentum is stalled at 49.
The Fear & Greed Index stands at 74, indicating “greed” and strong market optimism. However, according to the firm, caution is advised to avoid potential overextensions.
However, The Birb Nest notes that the Net Unrealized Profit and Loss (NUPL) indicator stands at 0.57, suggesting that a significant portion of the market is currently profitable, which could lead to increased selling pressure as investors capitalize on profits.
Currently, BTC is trading at ,900, down 3% from Monday’s price and over 3% in the past seven days, showing the cryptocurrency’s struggle to break above higher resistance levels, which are located at ,500 and ,000 on the BTC/USD daily chart.
Conversely, bulls must hold the next support levels for BTC at ,000, ,500, and ,800 to avoid a potential loss of the cryptocurrency’s key ,000 milestone.
Featured image from Shutterstock, chart from TradingView.com
XRP Bullish Outlook: Analyst Predicts Mega Run On The Horizon
In a strikingly optimistic forecast amidst favorable market conditions, cryptocurrency analyst and trader Edrag Crypto, has provided a bullish review for XRP, predicting that a massive run for the digital asset could be on the horizon.
The analysis explores a confluence of positive market indicators and trends that demonstrates the potential for XRP to attract significant price surges and gains, positioning the coin as a promising asset in the ever-evolving world of cryptocurrency.
Edrag Crypto’s bullish prediction for XRP is based on a Genuine Wake-Up line previously introduced by the expert, divided into two distinct sections, such as Break-out and Atlas Line.
XRP Poised For Substantial Growth
The analyst has expressed that while this wake-up line saw a successful breakout last year, it could not reach the heights anticipated by the analyst then. “Many moons back, I introduced the ‘Final Wake Up Line,’ which saw a breakout in July 2023. Yet, it didn’t quite soar to the heights we hoped for,” he stated.
However, Edrag Crypto spotted a new development on XRP’s chart two weeks ago, which he indicated as a white triangle. According to the analyst, highs from 2021 are being incorporated into the white triangle.
At that time, for XRP to witness a complete upward swing, it needed to break through the Genuine wake-up line with absolute conviction and then retest. Consequently, Edrag Crypto urged the community to remain firm, putting his wave 1 target at .5 and wave 3 at a 3-digit target, within the Macro wave 3.
Presently, addressing the break-out aspect, the analyst has noted that the white triangle break-out is in perfect alignment with the Fibonacci 0.702 – 0.786 levels and his previous charts. It is expected that the measured move will be between .2 and .5, while the crucial break-out point is closer to .70 or .75.
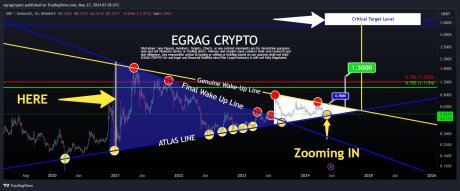
Due to this, Egrag Crypto affirms that XRP will see a breakout from the point in the upcoming weeks. Despite the possibility of a retest of the breakout, the expert believes that a mega run for the crypto asset is imminent.
The Atlas Line
Delving into the Atlas Line aspect, Egrag Crypto underscored XRP’s resilience in this area. According to the analyst, the asset is dominating the atlas line with a solid grip like a boss.
He further pointed out a quick timeframe analysis revealing resistance at .5777, support at .5000, and a break-out point at .6799. Edrag Crypto’s prognosis has captured investors’ and enthusiasts’ attention alike, as they closely monitor these developments.
At the time of writing, XRP was trading at .5284, indicating a 3% rise in the past week. While its market cap has reduced by about 1.28%, its trading volume has seen positive movement of more than 36% in the past day.
Chainlink’s (LINK) Outlook Grows Bleak: Signals of Bearish Continuation Surface
Chainlink’s LINK price is struggling to surpass the .80 resistance. The price could continue to move down if it breaks the .00 support.
- Chainlink price is showing bearish signs below the .00 resistance against the US dollar.
- The price is trading below the .60 level and the 100 simple moving average (4 hours).
- There is a key bearish trend line forming with resistance near .50 on the 4-hour chart of the LINK/USD pair (data source from Kraken).
- The price could start a decent increase if it clears the .80 resistance zone.
Chainlink (LINK) Price Turns Red
In the past few days, Chainlink saw a steady decline from well above the .80 level. LINK price declined below the .50 support level to enter a short-term bearish zone, like Bitcoin and Ethereum.
The price tested the .10 support zone. A low was formed at .07 and the price recently attempted a recovery wave. There was a move above the .50 level. It even jumped above the 23.6% Fib retracement level of the downward move from the .30 swing high to the .07 low.
However, the bears were active below the .80 resistance and the 50% Fib retracement level of the downward move from the .30 swing high to the .07 low. LINK price is still trading below the .80 level and the 100 simple moving average (4 hours).
Immediate resistance is near the .50 level. There is also a key bearish trend line forming with resistance near .50 on the 4-hour chart of the LINK/USD pair.
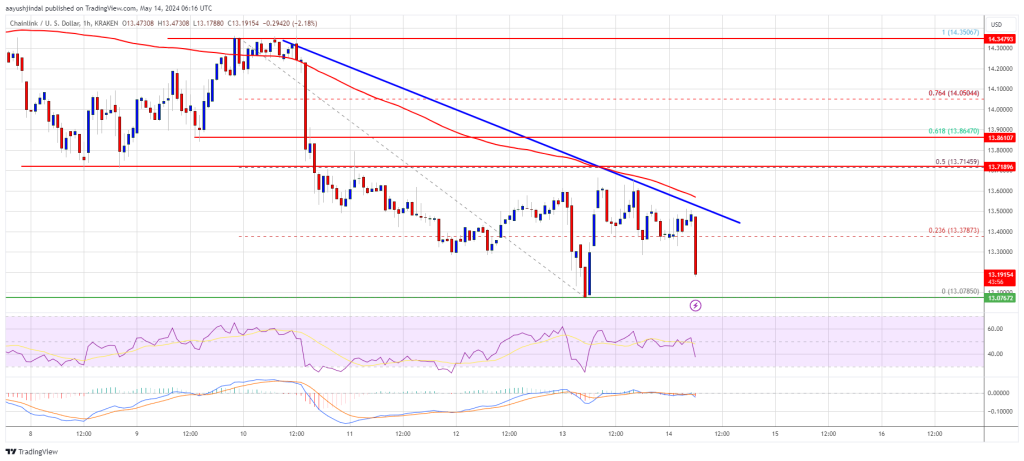
The next major resistance is near the .80 zone. A clear break above .80 may possibly start a steady increase toward the .00 level. The next major resistance is near the .35 level, above which the price could test .50.
More Losses?
If Chainlink’s price fails to climb above the .50 resistance level, there could be a fresh decline. Initial support on the downside is near the .10 level.
The next major support is near the .80 level, below which the price might test the .20 level. Any more losses could lead LINK toward the .50 level in the near term.
Technical Indicators
4 hours MACD – The MACD for LINK/USD is gaining momentum in the bearish zone.
4 hours RSI (Relative Strength Index) – The RSI for LINK/USD is now below the 50 level.
Major Support Levels – .10 and .80.
Major Resistance Levels – .50 and .80.
Is MATIC Poised For Takeoff? Key Area Breaks Records, Fueling Bullish Outlook
Polygon (MATIC), the Ethereum scaling solution, has been a hot topic for weeks. Its daily active addresses recently hit an all-time high, exceeding 1.4 million, a testament to the network’s growing user base. This surge in activity, however, presents a tale of two sides for MATIC.
Polygon’s Busy Streets: A Sign Of Growth Or Gridlock?
The high traffic on Polygon’s virtual streets is undeniable. The consistent daily active addresses above 1 million suggest a thriving ecosystem. However, a closer look reveals a potential bottleneck. While the number of users has skyrocketed, transaction fees have taken a nosedive. This decline in fees translates to a drop in revenue for the network, raising concerns about Polygon’s long-term sustainability.
JUST IN:
Polygon PoS has recorded a new all time high in daily active addresses with 1.4M pic.twitter.com/YnOdDYbyJD
— Today In Polygon (@TodayInPolygon) May 1, 2024
The story doesn’t end there. Despite the network’s bustling activity, the Total Value Locked (TVL) in Polygon’s Decentralized Finance (DeFi) protocols has dipped. This could indicate a cautious approach from DeFi whales, hesitant to fully commit their assets in the current market climate.

MATIC Bulls Charge In, Waving Green Flags
Despite the underlying concerns, MATIC bulls are charging forward. The token’s price experienced a surge exceeding 8% in the past 24 hours, currently hovering around .71. This bullish momentum could be attributed to a rise in buying pressure.
Data suggests a decrease in MATIC supply on exchanges, coupled with an increase in holdings by large investors (whales). This shift indicates investor confidence in Polygon’s future potential.
Technical Indicators Flash Bullish, But Caution Remains
Technical indicators also paint a bullish picture for MATIC. The Chaikin Money Flow (CMF), Money Flow Index (MFI), and the Moving Average Convergence Divergence (MACD) all point towards a potential upward trend.
These indicators suggest strong buying pressure and a bullish upper hand in the market. However, the Bollinger Bands, which measure price volatility, indicate that MATIC might be entering a period of lower price swings.
While this could be a sign of consolidation after the recent surge, it also introduces an element of uncertainty. The cryptocurrency market is notoriously unpredictable, and technical indicators can be misleading.
The Road Ahead: Can Polygon Navigate The Challenges?
Polygon finds itself at a crossroads. The network’s high activity is a positive sign, but the decline in fees and DeFi TVL raises concerns. The recent price surge and bullish technical indicators offer a glimmer of hope for MATIC investors. However, navigating the volatile cryptocurrency market requires a cautious approach.
For Polygon to maintain its current momentum, it needs to address the issue of declining fees. Exploring alternative revenue models or implementing fee structures that incentivize network usage are crucial steps. Additionally, fostering a robust DeFi ecosystem by attracting innovative protocols and users could reignite investor confidence and drive TVL growth.
Featured image from Pixabay, chart from TradingView
Federal Reserve Holds Rates Steady Amid Inflation Concerns; Outlook Remains ‘Uncertain’
 On Wednesday, May 1, 2024, the U.S. Federal Reserve chose to maintain the benchmark interest rates at their highest in 23 years. The Federal Open Market Committee (FOMC) members noted that although inflation has subsided, it still “remains elevated.” No Change in Federal Funds Rate; Fed Continues Watchful Eye on Inflation Risks On Wednesday, the […]
Bitcoin News
Bitcoin Long-Term Outlook: Analyst Foresees Peak In Late 2025
Following the fourth Bitcoin Halving, Rekt Capital, a popular cryptocurrency trader and expert, has offered a compelling narrative on the future trajectory of Bitcoin, predicting that the crypto asset could peak this bull cycle in the following year. Rekt Capital’s analysis emphasizes on the possibility that this current cycle could reiterate past Halving cycle trends, positioning BTC for significant gains in the coming months.
Bitcoin Could Mirror Past Halving Cycle
According to the analyst, Bitcoin reached its all-time high within 518 days following the Halving in the 2015–2017 cycle. Meanwhile, after the event in the 2019-2021 bull cycle, the digital asset topped out within 546 days. This suggests that the event has always catalyzed massive growth for the leading cryptocurrency asset.
Should the past trend hold, the next bull market top might happen between 518 and 546 days following the recently concluded fourth Halving, particularly around the middle of September or middle of October in 2025, according to Rekt Capital.
The analyst noted that in this cycle Bitcoin is accelerating by about 220 days currently. Thus, the longer time BTC consolidates after this Halving, it will be better for resynchronizing this current cycle with the previous events cycle.
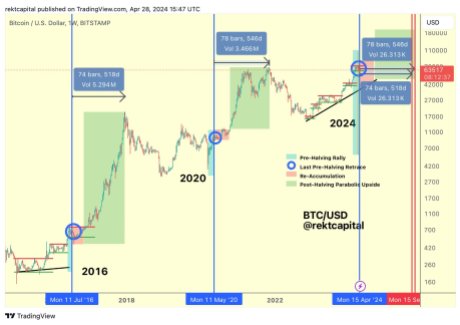
Rekt Capital also noted that Bitcoin has experienced further declines in the three weeks after the Halving, according to historical data from 2016. He has labeled the period as the Post-Halving “Danger Zone,” this is where there is a chance of downside volatility at the range low of the Re-accumulation Range.
In 2016, approximately 21 days after the occurrence, Bitcoin saw a lengthy -11% decline before gaining momentum toward the upside. However, data for 2016 indicates that if there will be downside volatility in this cycle around the Re-Accumulation Range Low, it may happen during the following 15 days.
Although the post-Halving danger zone ends in 15 days, the 2016 data indicates that there may be some negative volatility in the interim, possibly reaching the ,600 Range Low.
Parabolic Phase For BTC
It is worth noting that Rekt Capital anticipates a parabolic phase after the re-accumulation phase is concluded. During this stage, Bitcoin usually sees massive growth leading all the way up to a new all-time high.
In the previous Halvings, Bitcoin would historically consolidate in this Re-Accumulation Range for up to 150 days before ultimately entering a parabolic phase. Once BTC breaks out of this re-accumulation stage, Rekt Capital expects BTC to see a parabolic upside by September this year if it consolidates within the aforementioned timeframe.
At the time of writing, BTC was down by over 5% in the past 7 days and was trading at ,504. Presently, its market cap is down by 1.53%, while its trading volume has increased by over 22% in the last 24 hours.