 Mesh, a U.S. fintech company backed by Paypal Ventures, has partnered with Italian digital asset wallet Conio to enhance cryptocurrency exchange access for Conio’s 430,000 customers. This collaboration allows users to access 10 leading crypto exchanges, including Binance and Coinbase, through the Conio app, and seamlessly transfer bitcoin purchases directly into their Conio wallets. By […]
Bitcoin News
Ethereum Set For $5,000? ETH Open Interest Expanding On CME Ahead Of Spot ETFs Trading
Ethereum is tracking lower when writing, sinking roughly 18% from March 2024 highs. Even though bears appear to be in control at spot rates, keeping the second most valuable coin below ,700, confidence is high among analysts.
ETH Futures Open Interest Rising On CME
Taking to X, one of them noted that there are solid signs that institutions are positioning themselves to push prices higher. Citing rising open interest in Ethereum Futures at CME, a bourse, the analyst said it is highly likely that the “big money” is accumulating ETH, taking advantage of the recent correction.
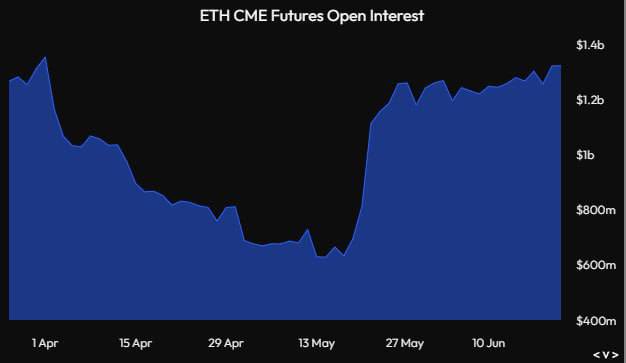
To reassert this outlook, the analyst said the trend observed from the Ethereum CME futures contracts’ open interest is a reliable telltale sign.
Notably, this trend mirrors what transpired with Bitcoin futures before the launch of spot Bitcoin exchange-traded funds (ETFs). For this reason, the analyst is convinced that a similar pattern is printing for Ethereum.
Currently, Ethereum is printing discouraging lower lows. Sellers have been resilient, deflating any momentum buildup and placing caps on bulls.
So far, it is emerging that ,700 is a resistance level for traders to monitor closely. Bulls did not launch a counter once it was broken on June 7, and the bear breakout was confirmed four days later on June 11.
Despite the current market conditions, the launch of Ethereum spot ETFs could still drive prices to new heights. The analyst predicts a potential expansion to ,000, confirming the Q1 2024 trend and the breakout above the current flag.
Still, whether bulls will be in control depends on how price action pans out. Technically, open interest shows the cumulative summation of both open or long-leveraged positions. If buyers push prices to rise, ETH should expand in the coming days, even breaking ,700 this week.
Spot Ethereum ETF Optimism: Will They Be A Success?
Beyond this, the recent flurry of activity surrounding spot Ethereum ETF applications bolsters this optimism. On June 21, seven applicants, whose 19b-4 forms were recently approved, submitted amended S-1 registration statements with the United States Securities and Exchange Commission (SEC). Analysts now think the regulator could approve the trading of these products by early July 2024.
While bullish for Ethereum, some analysts are not convinced they will enjoy similar success as those seen when spot Bitcoin ETFs began trading. Eric Balchunas, Senior ETF analyst at Bloomberg, predicted that spot Ethereum ETF would succeed if it grabs just 20% of all the capital inflow going to its Bitcoin counterpart.
SEC Drama Fuels XRP Rally: Open Interest Skyrockets
The cryptocurrency XRP is making waves as open interest (OI) for the token experiences a dramatic rise. This surge in investor positioning coincides with the ongoing legal battle between Ripple Labs, the company behind XRP, and the US Securities and Exchange Commission (SEC).
Bullish Bets On The Horizon
Cryptocurrency analysis platform CryptoQuant detected a significant increase in XRP’s open interest, indicating a growing number of investors entering positions. This trend suggests a bullish sentiment, with investors betting on a potential price appreciation for XRP in the near future. The logic is simple: more investors entering the market with buy orders typically drives the price upwards.
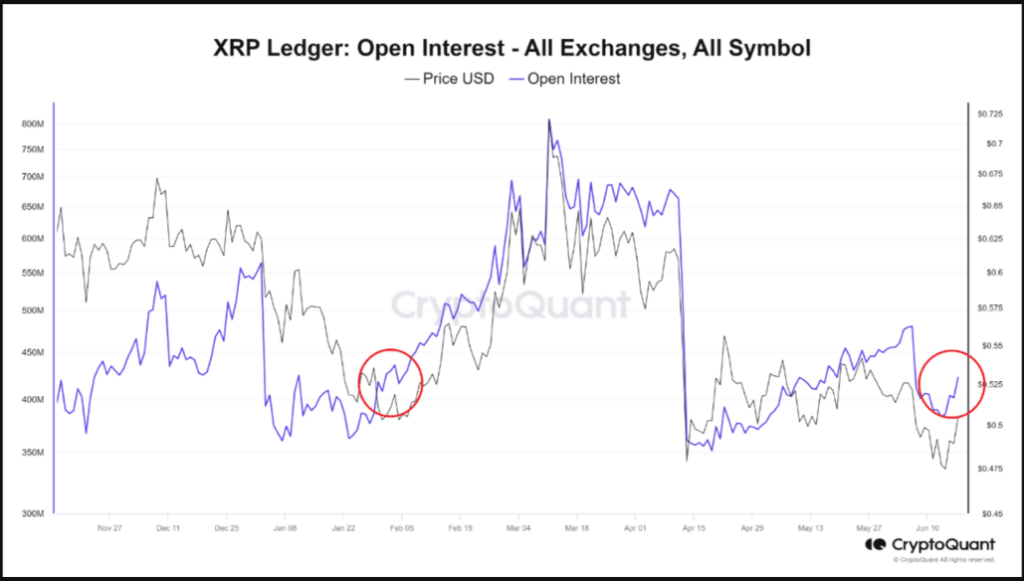
Recent developments in the SEC lawsuit, which accuses Ripple of selling unregistered securities in the form of XRP, seem to be buoying investor confidence. A recent court decision, for instance, may have provided some clarity on the legal classification of XRP, potentially paving the way for a more favorable outcome for Ripple.
Volatility Ahead: Potential Market Swirls
While the surge in open interest is a positive sign for XRP bulls, CryptoQuant warns of potential market volatility on the horizon. Rising open interest can be a double-edged sword. It indicates increased market activity, but it can also lead to higher volatility.
A market with high open interest can resemble a busy intersection. Increased activity can lead to more opportunities, but it also raises the risk of sudden changes. Just as drivers need to be extra cautious at a crowded intersection, investors in a market with high open interest need to be prepared for potential volatility as new information or shifting market sentiment prompts investors to adjust their positions quickly.
This potential volatility underscores the importance of caution for XRP investors. While the current trend suggests optimism, it’s crucial to remember that the outcome of the SEC lawsuit remains uncertain and the broader cryptocurrency market is inherently volatile.
XRP Price Prediction
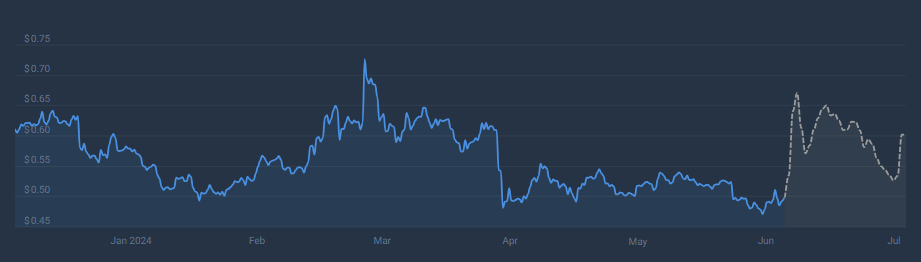
Meanwhile, XRP is predicted to rise by 21% to reach .602 by July 19, 2024. Despite this optimistic forecast, the current market sentiment remains bearish, indicating caution among traders. However, the Fear & Greed Index at 64 shows a state of greed, suggesting positive market activity and buying interest despite the prevailing caution.
In the past 30 days, XRP has seen 14 green days, or 47% of the period, indicating moderate positivity. The price volatility over this period has been 3.67%, which is relatively moderate for a cryptocurrency.
Featured image from Search Engine Land, chart from TradingView
Shiba Inu Open Interest Returns To February 2024 Levels, What Happened Last Time?
Shiba Inu has seen a notable uptick in its open interest that has sent renewed vigor through investors. While the meme coin’s open interest is yet to break its Match 2024 all-time high, it is on a bullish trend that could see an attempt soon.
Shiba Inu Open Interest At February Levels
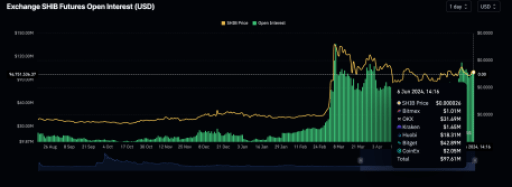
The total Shiba Inu open interest has climbed back above million across multiple exchanges, bringing it to one of the highest levels so far for the year. According to data from Coinglass, the SHIB open interest is now sitting at .08 million as of June 6, 2024.
This figure is notable because the open interest has been struggling over the last few months. After hitting an all-time high of almost 6 million in March 2024, the Shiba Inu open interest fell rapidly, losing more than half of its value by mid-April.
However, the SHIB open interest began to recover in May, and with June rolling around, the open interest has surged. From the March lows to the currently June figures, the Shiba Inu open interest is now up almost 100%, showing a notable spike in interest from investors.
Currently sitting above 97%, the SHIB open interest is now around 60% away from making a new all-time high. The possibility of this happening has significant implications for the SHIB price hitting a new all-time high as well.
Why A Rise In Open Interest Is Important
The Shiba Inu open interest is on the rise is significant not just to measure investor interest but in how it affects the SHIB price. Looking at the March figures when the SHIB open interest had hit a new all-time high, the price had rallied right alongside it. So the current increase could translate into a price rally as well.
If the open interest were to go back to its 6 million ATH, going by how much the price rose the last time, it could see the Shiba Inu price touch .00004 once more, and hit a new yearly high. This is because in March, the SHIB price more than doubled when the open interest surged.
However, in the last 24 hours, there has been a small slow down in the open interest, with an overall 0.42% decrease. The SHIB price is currently trending at .0000256 at the time of writing, representing a 4.41% decrease in the last week.
Shiba Inu Open Interest Explodes 85% Amid 15% Price Jump, Why This Is Important
Shiba Inu is currently the talk of the crypto market after mounting a 15% surprise rally. However, beyond the price rally, SHIB is shining in other places, and one of those is the open interest. This metric has seen a significant increase, with potential implications for the SHIB price going forward.
Shiba Inu Open Interest Sees 85% Surge
The Shiba Inu open interest in up over 85% in the past day as the price has gone on a recovery trend. Open interest tracks the futures or options contract for a particular asset, given a total of how much money is invested in that asset’s derivatives at a time. This means that the amount invested in Shiba Inu derivatives over the last day has seen a significant jump.
The 85% figure is taken from an average of two increases in the Shiba Inu open interest across the Binance and ByBit exchanges. According to data from Coinglass, the SHIB open interest in Binance rose more than 60% in the last day. In the same vein, the Shiba Inu open interest is up more than 111% on the Bybit exchange in the last day. So on average, the open interest for the meme coin is up a whopping 85% in 24 hours.
Dollar figures also show the significance of this jump and just how much crypto investors are moving into Shiba Inu. The current open interest on the Binance exchange is 6.79 million, which means whatever million flowed into SHIB derivatives product in one day.
On the Bybit exchange, the rise is similar, currently showing a total of .16 million in open interest. At a rate of 117.81%, it means that around million flowed into SHIB derivatives on the exchange. Combined, the Shiba Inu open interest if up around 5 million in one day.
SHIB Price Still Seeing Upside
The drastic rise in the Shiba Inu open interest is undoubtedly a positive development for the SHIB price. This rise has now sent the open interest toward its previous all-time high of March 5, 2024. If history is anything to go by, if the open interest hits a new all-time high, then the meme coin could be looking at a new yearly peak toward .00004.
Amid the surge in open interest, the SHIB price also rose around 16% at the same time. The price has since corrected back downward, but according to data from the token tracking website CoinMarketCap, the meme coin is maintaining 24-hour gains of 7.77%.
Interestingly, the surge saw Shiba Inu briefly overtake Cardano and claim the 10th spot on the list of largest cryptocurrencies by market cap. However, with the price correction, Shiba Inu has fallen back down once more to 11th place.
Ethereum Futures Open Interest Hits All-Time High Following ETF Approvals
 Ethereum has experienced a significant increase since the U.S. Securities and Exchange Commission (SEC) approved a group of spot ether exchange-traded funds (ETFs). This week, ether reached a high of ,980 per coin, which is approximately 18.4% below its all-time high. Amid fluctuating prices, ethereum futures markets have achieved a record high in open interest. […]
Bitcoin News
Floki Inu Frenzy: Memecoin Eyes New Highs As Open Interest Soars
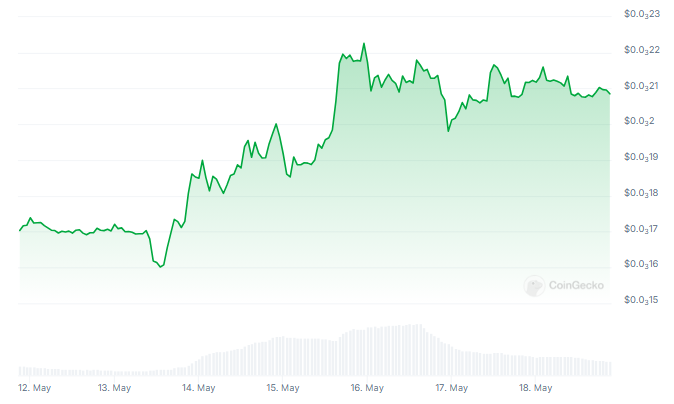
Floki Inu (FLOKI), the Shiba Inu-inspired memecoin, has rocketed into the spotlight with a surge in trading activity and a nearly 20% price increase in the past week. However, experts caution that this “pup-ularity” might be short-lived, fueled more by hype than by strong foundations.
Open Interest Takes Off: Newcomers Flock To FLOKI
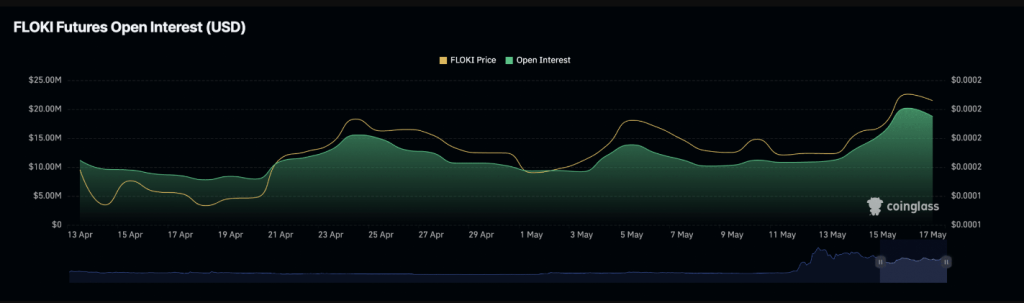
The key indicator driving excitement is the skyrocketing Futures Open Interest for FLOKI. According to Coinglass, this figure, which reflects the number of outstanding futures contracts, has climbed a staggering 110% since May 1st, reaching a 30-day high of nearly million. This suggests a surge of new market participants entering FLOKI positions, potentially anticipating further price increases.
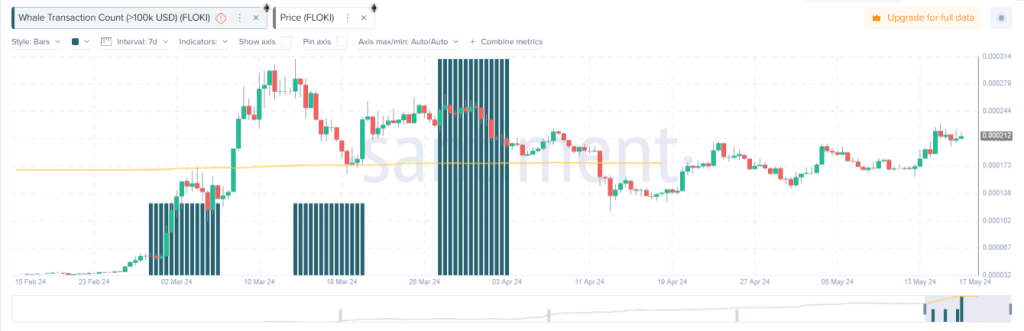
Adding fuel to the fire is the significant rise in FLOKI’s daily trading volume. On May 15th, Santiment reported a daily volume exceeding billion, marking the highest level for FLOKI since late March. This intense buying activity indicates a surge in investor interest, pushing the price upwards.
Momentum Indicators Point To A Bullish Charge
Further bolstering the case for a bullish FLOKI is the behavior of its key momentum indicators. Both the Relative Strength Index (RSI) and the Money Flow Index (MFI) currently sit comfortably above their neutral lines, at 62.68 and 65.37 respectively. In simpler terms, these metrics suggest that the price momentum leans towards further gains in the short term.
Also, the broader market sentiment surrounding FLOKI is notably positive. Increased trading volumes and a surge in social media mentions have amplified investor interest, suggesting that the cryptocurrency is gaining traction not just among retail traders but also institutional investors.
Recent partnerships and strategic developments within the FLOKI ecosystem are likely to fuel further growth. These factors, combined with the strong technical indicators, paint a promising picture for FLOKI’s near-term performance, potentially paving the way for substantial price appreciation.
However, beneath the shiny exterior lies a potential cause for concern. The Chaikin Money Flow (CMF), an indicator that measures the buying and selling pressure of an asset, paints a rather bearish picture.
Still In Negative Zone
Despite the price appreciation, FLOKI’s CMF remains firmly in negative territory, currently hovering around -0.11. This suggests that even though the price is rising, the buying pressure might be weakening.
This divergence between price and buying pressure is often seen as a sign of a potential reversal, indicating a rally driven by short-term speculation rather than long-term investor confidence.
While FLOKI’s recent performance is undeniably impressive, the underlying factors suggest a potentially volatile future. The surge in open interest and trading volume hints at a market frenzy, but the negative CMF raises concerns about the rally’s sustainability.
Featured image from Floki, chart from TradingView
Dogecoin Derivatives Volume Jumps 111% As Open Interest Spikes, But What About Price?
A number of Dogecoin metrics have turned bullish in the last few days, showing increased interest from investors. This ranges from the meme coin’s daily derivatives trading volumes to its open interest seeing a significant increase. However, in the midst of this, the Dogecoin price has remained limp, sparking worries among investors.
Dogecoin Derivatives Volume And Open Interest See Increase
One of the major Dogecoin metrics that has seen a significant increase recently is its derivatives trading volume. The trend began on Monday when the derivatives trading volume saw a 60% uptick. However, it seems DOGE traders are far from done as the volume has almost doubled since that time.
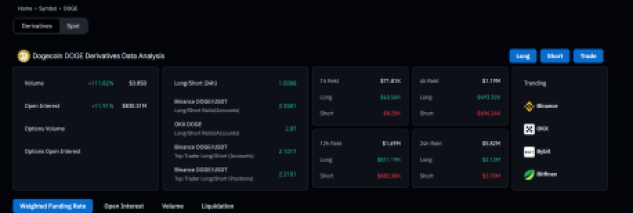
According to data from Coinglass, the Dogecoin derivatives trading volume is up 111% in the last day alone. This has pushed the derivatives trading volume to .85 billion, a significant increase from the .99 billion that was recorded on Monday.
The launch of Dogecoin futures contracts by Coinbase, the leading crypto exchange in the United States, may have something to do with this. Following the launch on April 1, 2024, the meme coin has seen increased interest in its derivatives products, which explains the increase in the volume.
However, the derivatives trading volume is not the only thing that has seen an uptick during this time. As Coinglass data shows, the Dogecoin open interest has also risen significantly during this time. It has seen an approximately 12% increase in the last day to touch above 0 million.
Despite this increase in the Dogecoin open interest, it is still a long way from its all-time high of .91 billion that was recorded on March 29. So, the current open interest of 0 million represents an over 50% decline from its all-time high. At the same time, the DOGE price is still struggling, showing a disconnect between the rise in metrics and the price of the meme coin.
DOGE Price Doesn’t Respond To Bullish Metrics
The Dogecoin price has remained muted during this time, even with the increased momentum. The total daily trading volume of the meme coin is up 128% in the last day. However, its price has barely moved 4%, even amid the meme coin craze sparked by the GameStop (GME) 100% rally.
DOGEs price has barely moved during this time and the resistance at .15 is waxing stronger. This suggests that the focus is no longer on Dogecoin during meme coin craze and rather on newer counterparts such as Solana-based GME and AMC, which have seen incredible rallies in the last day.
At the time of writing, the DOGE price is trending at .49, with a 3.48% increase in the last day. However, in the longer time frame, the meme coin is struggling with 5.79% and 4% losses on the weekly and monthly charts, respectively.
Bitcoin Relative Open Interest Lowest Since Feb, Analyst Says “Hard To Be Bearish”
Data shows the Bitcoin Open Interest as a percentage of its market cap has been at lows recently, a sign the derivatives side has been healthy.
Bitcoin Open Interest Is Now Less Than 2% Of The Market Cap
As explained by analyst James Van Straten in a new post on X, the derivatives side of the market has looked “extremely healthy” while BTC’s latest recovery has occurred.
The metric of interest here is the “Open Interest,” which keeps track of the total amount of derivatives-based Bitcoin positions that are currently open on all centralized exchanges.
When the value of this indicator goes up, it means that the investors are opening up more positions on the market right now. Generally, the total leverage in the market rises when such a trend takes place, so the price of the asset could end up turning more volatile following it.
On the other hand, a decline in the metric suggests users are either closing up their positions of their own volition or getting forcibly liquidated by their platform. The cryptocurrency may behave in a more stable manner following such a decrease.
Now, here here is a chart that shows the trend in the Bitcoin Open Interest over the past few years:
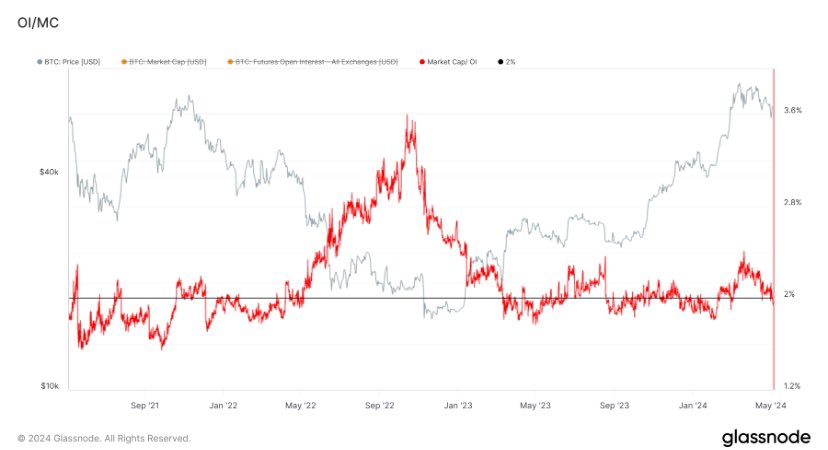
In the graph, the Open Interest is displayed as a percentage of the asset’s market cap (that is, the total valuation of the entire BTC circulating supply at the current spot price).
It would appear that the indicator has registered a drawdown recently and has slipped under the 2% mark. This would suggest that the positions on the derivatives market now make up for less than 2% of the market cap.
From the chart, it’s visible that the metric had earlier spiked to a high as the coin’s rally towards a new all-time high had taken place. Interestingly, the market cap was rapidly going up in this rally, but this ratio was still trending up, implying that speculation had been growing at a rate faster than the price.
This may have been a sign that the derivatives side was starting to become overheated. In the drawdown that had followed the price top, the investors had started getting liquidated, leading to the ratio registering a decline.
The most recent price drop had helped reset the market further, bringing the ratio down to levels not seen since February. Bitcoin has been mounting a recovery effort in the past few days, but so far, the derivatives market has remained cool. “Hard to be bearish here,” says the analyst.
It now remains to be seen if the health of the market would continue to look optimistic in the coming days, thus potentially allowing for the recovery to go a step further.
BTC Price
Bitcoin had returned back above ,500 earlier, but the asset has since seen a small pullback as it’s now down to ,100.
Ethereum On-Chain Health Holds Strong Amidst Open Interest Plunge – Impact On Price
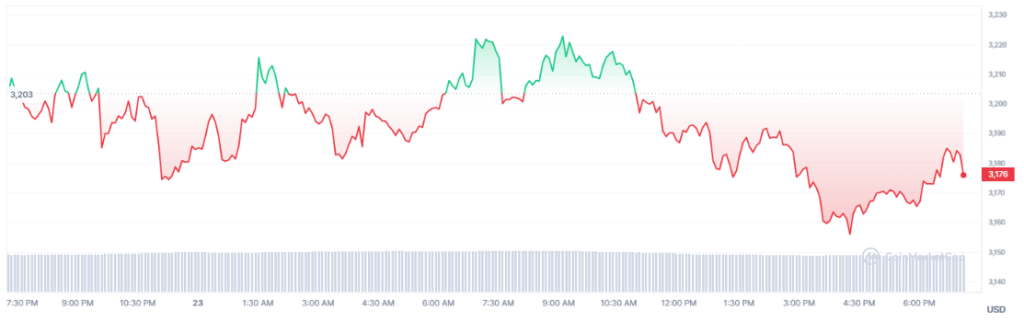
Ethereum (ETH) stands as a bellwether for the industry’s ebbs and flows. As of press time, Ethereum was trading at ,174, its price trying to reach the crucial ,000 mark. However, beneath the surface of these seemingly stable waters lies a complex interplay of market forces and investor sentiment.
Ether’s Challenging Trajectory
Since last week, the lower timeframes have seen repeated breaches of the ,000 psychological threshold, and the enthusiasm surrounding the altcoin king has significantly waned.
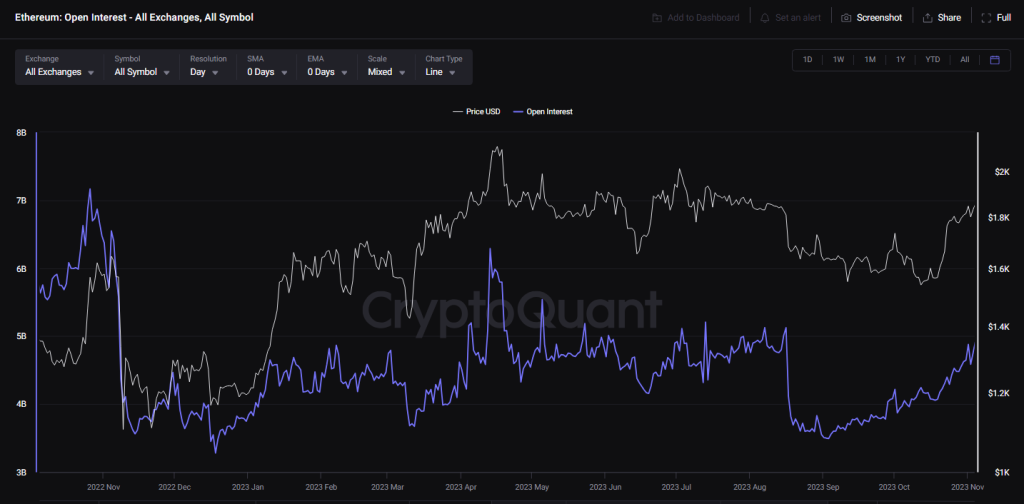
This downward pressure is further underscored by the notable drop in Open Interest (OI) behind ETH futures contracts, which plummeted from billion to billion in April alone.
Such a decline suggests a recalibration in the futures market, potentially signaling a cooling-off period for speculative trading activity.
Navigating Choppy Waters
However, amidst the uncertainty, there exists a glimmer of hope for ETH bulls. Historical precedents, such as the mid-February 2021 correction, offer insight into the resilience of Ethereum’s price.
Following a similar dip from an all-time high of ,900 to ,400, Ethereum experienced a V-shaped reversal, demonstrating the market’s propensity for swift recoveries. This historical context serves as a guiding light for investors navigating the choppy waters of cryptocurrency volatility.
On the social sentiment front, Ethereum’s trajectory has been a tale of two halves. While sentiment was strongly positive in February and briefly in mid-March, a negative sentiment has dominated as prices entered a correction phase. Factors such as high gas fees on the Ethereum network have likely contributed to this shift, highlighting the impact of practical considerations on market sentiment.
Ethereum: Fundamental Metrics
Examining Ethereum’s fundamental metrics provides further insights into its current state. Network growth has slowed in recent months, signaling a potential decline in demand. However, a closer look reveals a silver lining: the 90-day mean coin age has trended steadily higher since late March, indicating a network-wide accumulation of ETH.
As Ethereum continues to navigate these turbulent waters, all eyes are on key resistance levels. Breaking above the ,300 barrier could instill confidence among traders and investors, potentially heralding a new wave of bullish momentum. However, uncertainties loom large, particularly in light of the broader market dynamics and the selling pressure on Bitcoin, Ethereum’s perennial counterpart.
While challenges abound and uncertainties persist, Ethereum’s historical performance and fundamental strengths offer hope for a brighter future. As investors brace for potential headwinds and opportunities alike, Ethereum stands poised to weather the storm and emerge stronger on the other side.
Featured image from Pexels, chart from TradingView