 Brian Kelly, founder and CEO of BKCM, a digital currency investment firm, stated that while he is still unsure about the imminent approval of a spot ether EFT, he trusts that it will be approved “at some point in time.” In an interview on CNBC, Kelly specified that solana (SOL) might be the next asset […]
Bitcoin News
Is $77,600 The Next Step For Bitcoin? On-Chain Pricing Model Hints So
Data from a Bitcoin pricing model based on an on-chain indicator suggests that ,600 may be the level where the asset will see its next peak.
Bitcoin MVRV Pricing Bands Could Provide Hints About What’s Next
In a new post on X, analyst Ali discussed what the Market Value to Realized Value (MVRV) Pricing Bands model could suggest about the cryptocurrency’s future.
The MVRV ratio is a popular on-chain indicator that compares the Bitcoin market cap and realized cap. The former is just the total valuation of the asset at the current spot price, while the latter is a model that calculates the asset’s cap by assuming the “true” value of any coin in circulation is the price at which it was last transferred on the blockchain.
The previous transfer of any coin on the network was likely the last time it changed hands, and thus, the price at that time would be its current cost basis. As such, the realized cap keeps track of the sum of the cost basis of every investor in the market.
Therefore, the MVRV ratio tells us how the value the investors hold (the market cap) compares against the value they put in (the realized cap).
Based on this indicator, the on-chain analytics firm Glassnode has developed a pricing bands model. Below is a chart showing what these pricing bands look like.
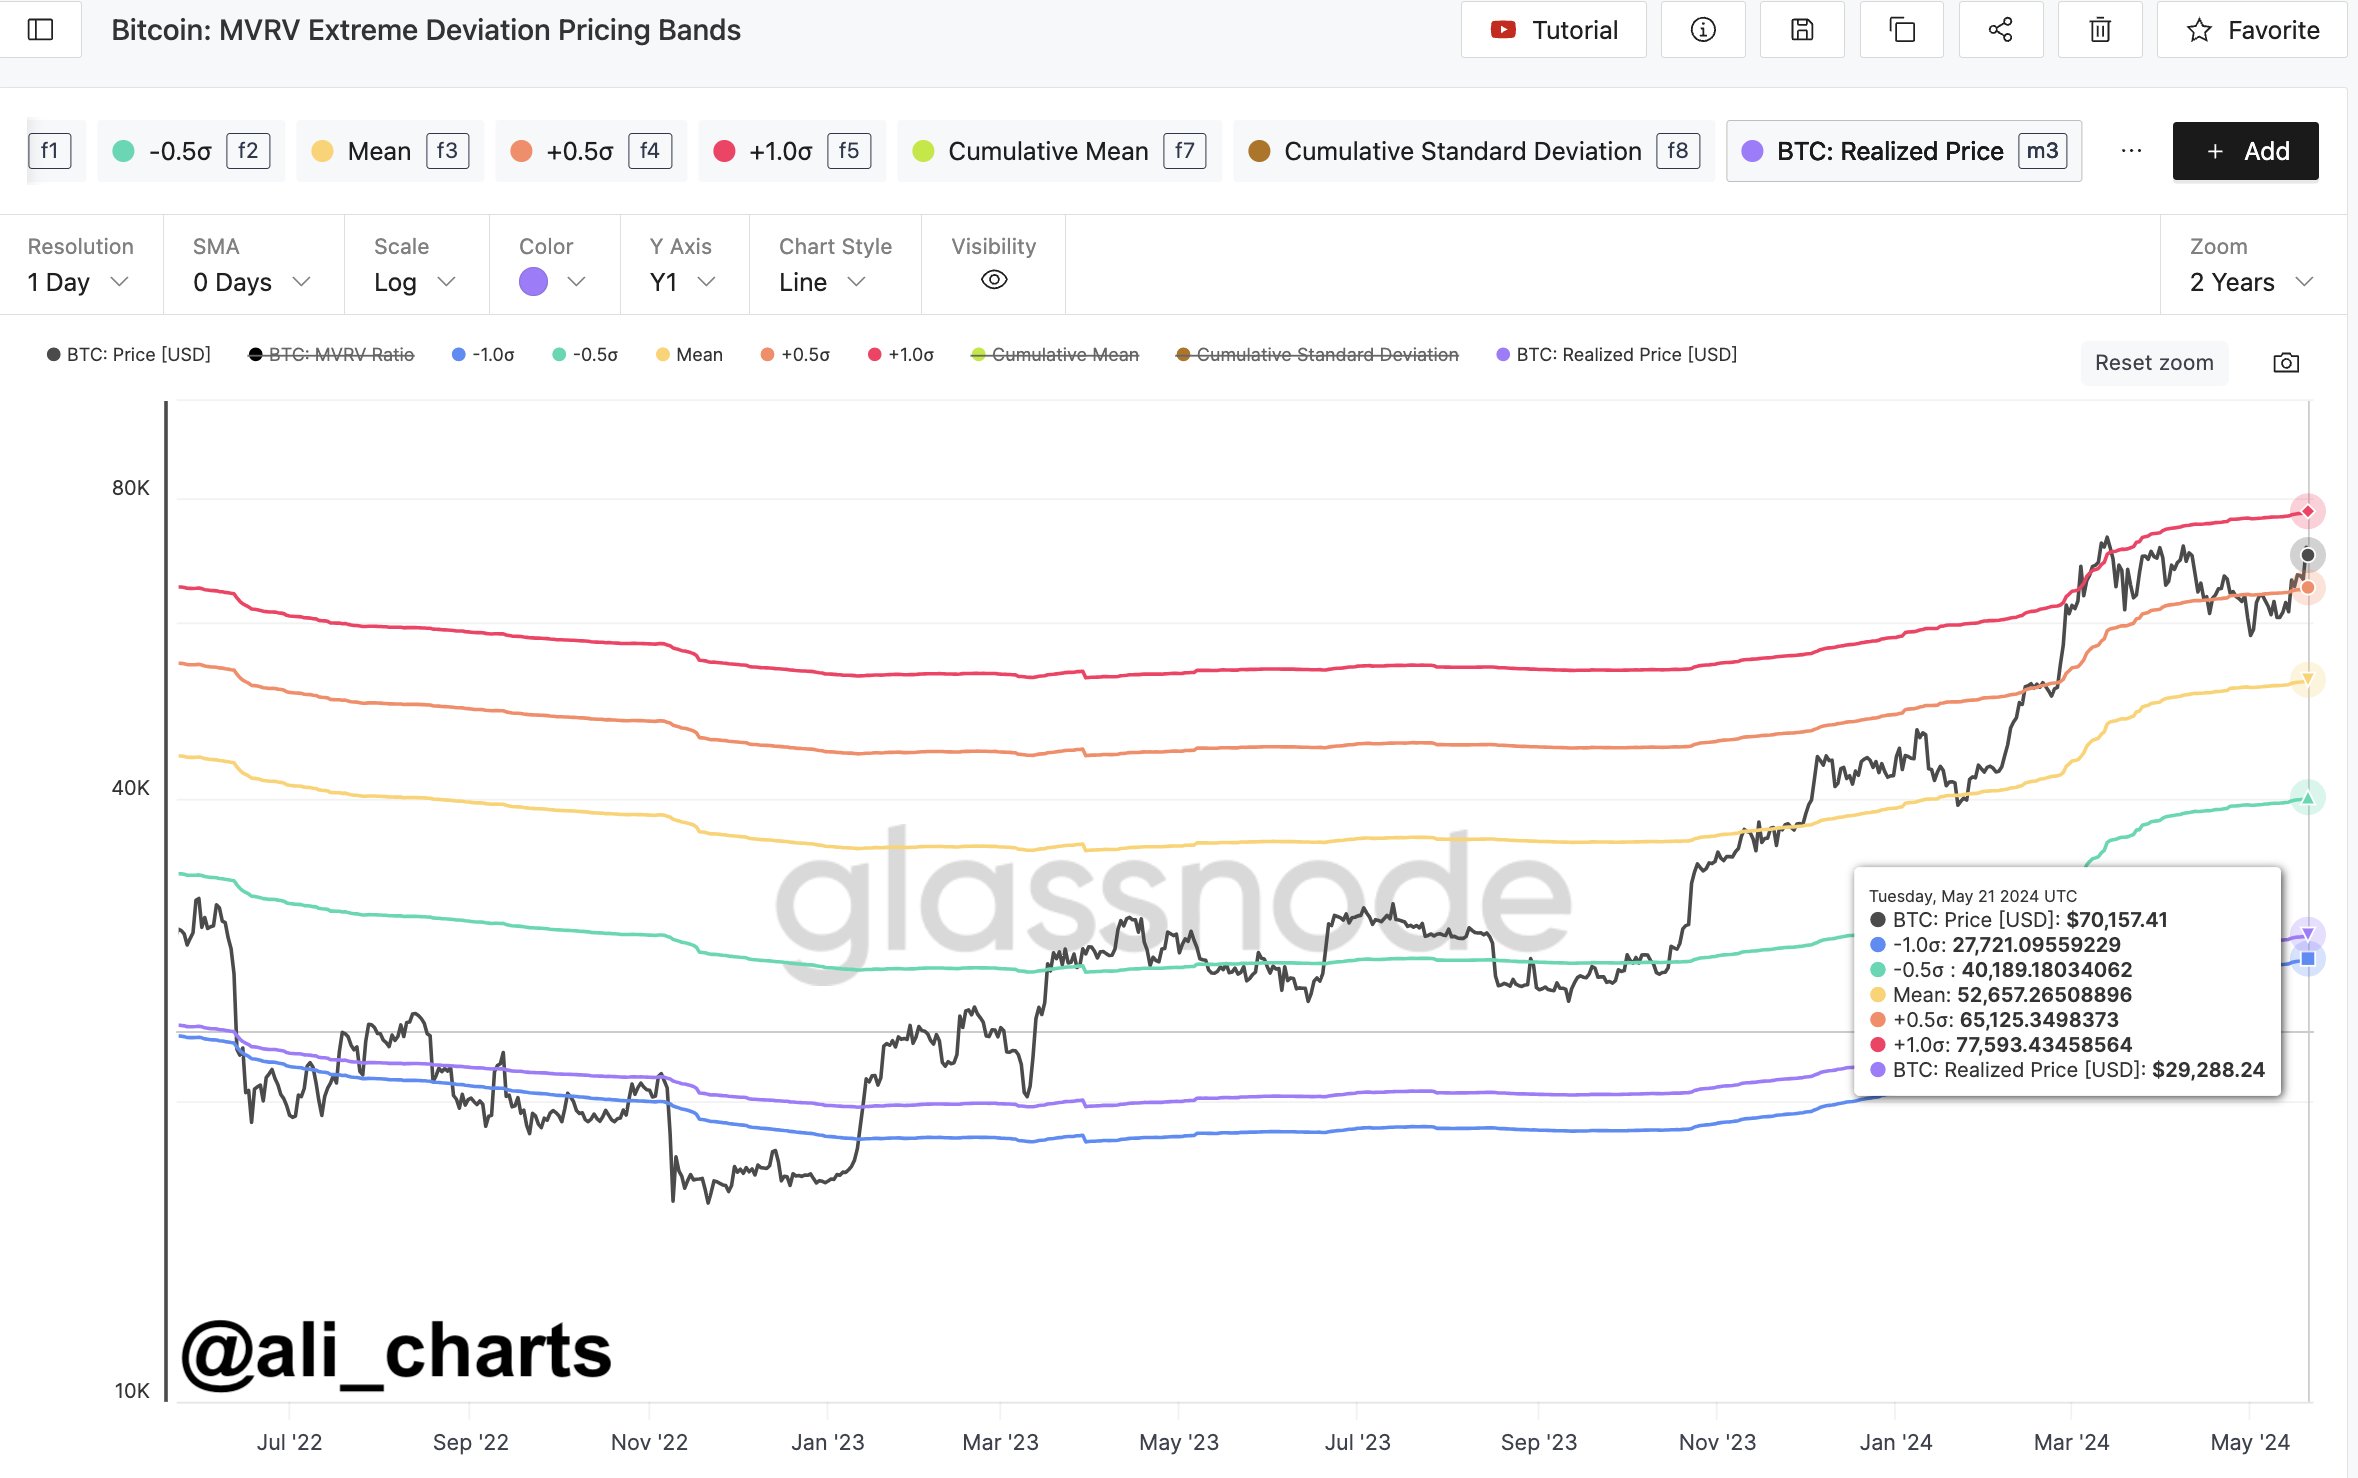
The pricing bands in this model represent levels corresponding to a specific deviation from the mean for the MVRV ratio. From the chart, it’s visible that the cryptocurrency is currently above the price level, corresponding to a +0.5 standard deviation (SD) from the mean for the indicator.
More specifically, the price level around ,100 would be where the MVRV ratio would be +0.5 SD above its mean. The next major pricing band in this model is +1 SD, which currently corresponds to around ,600.
In the past, this level has been where at least local tops have been probable to form for BTC. As is visible in the graph, the rally top back in March also occurred when BTC broke this level.
“Based on the MVRV Pricing Bands, if Bitcoin continues to trade above ,125, the next local BTC top before a brief correction could be around ,593!” notes the analyst.
From the current spot price of the cryptocurrency, a potential rally to a new all-time high of ,593 would mean an increase of more than 11% for the asset. It now remains to be seen how the asset’s price will develop from here and whether it will be able to maintain above the +0.5 SD MVRV level.
BTC Price
Since its sharp surge earlier, Bitcoin’s bullish momentum appears to have cooled off as the asset has fallen to sideways movement around the ,700 mark.
Is $77,600 The Next Step For Bitcoin? On-Chain Pricing Model Hints So
Data from a Bitcoin pricing model based on an on-chain indicator suggests that ,600 may be the level where the asset will see its next peak.
Bitcoin MVRV Pricing Bands Could Provide Hints About What’s Next
In a new post on X, analyst Ali discussed what the Market Value to Realized Value (MVRV) Pricing Bands model could suggest about the cryptocurrency’s future.
The MVRV ratio is a popular on-chain indicator that compares the Bitcoin market cap and realized cap. The former is just the total valuation of the asset at the current spot price, while the latter is a model that calculates the asset’s cap by assuming the “true” value of any coin in circulation is the price at which it was last transferred on the blockchain.
The previous transfer of any coin on the network was likely the last time it changed hands, and thus, the price at that time would be its current cost basis. As such, the realized cap keeps track of the sum of the cost basis of every investor in the market.
Therefore, the MVRV ratio tells us how the value the investors hold (the market cap) compares against the value they put in (the realized cap).
Based on this indicator, the on-chain analytics firm Glassnode has developed a pricing bands model. Below is a chart showing what these pricing bands look like.
The pricing bands in this model represent levels corresponding to a specific deviation from the mean for the MVRV ratio. From the chart, it’s visible that the cryptocurrency is currently above the price level, corresponding to a +0.5 standard deviation (SD) from the mean for the indicator.
More specifically, the price level around ,100 would be where the MVRV ratio would be +0.5 SD above its mean. The next major pricing band in this model is +1 SD, which currently corresponds to around ,600.
In the past, this level has been where at least local tops have been probable to form for BTC. As is visible in the graph, the rally top back in March also occurred when BTC broke this level.
“Based on the MVRV Pricing Bands, if Bitcoin continues to trade above ,125, the next local BTC top before a brief correction could be around ,593!” notes the analyst.
From the current spot price of the cryptocurrency, a potential rally to a new all-time high of ,593 would mean an increase of more than 11% for the asset. It now remains to be seen how the asset’s price will develop from here and whether it will be able to maintain above the +0.5 SD MVRV level.
BTC Price
Since its sharp surge earlier, Bitcoin’s bullish momentum appears to have cooled off as the asset has fallen to sideways movement around the ,700 mark.
Crypto Whales Pile into New Solana Project Thotiana – Next 100x Meme Coin?
 PRESS RELEASE. May 23rd, 2024. In an exciting development within the cryptocurrency market, Solana’s newest meme coin, $Thot, is rapidly gaining attention from investors worldwide. In just under a week, this meme coin has attracted over 0,000, marking its place in the competitive landscape of meme-based cryptocurrencies. $Thot, affectionately known as Thotiana, is leading a […]
Bitcoin News
Next Big Move For Bitcoin: Analysts Predict A Potential Breakout At $71,500
Bitcoin, the world’s most popular cryptocurrency, appears poised for a major move, but the direction remains shrouded in mystery. Analysts are divided on whether a bullish breakout or an extended consolidation period lies ahead.
Reaching New Highs: Euphoric Bulls On The Horizon?
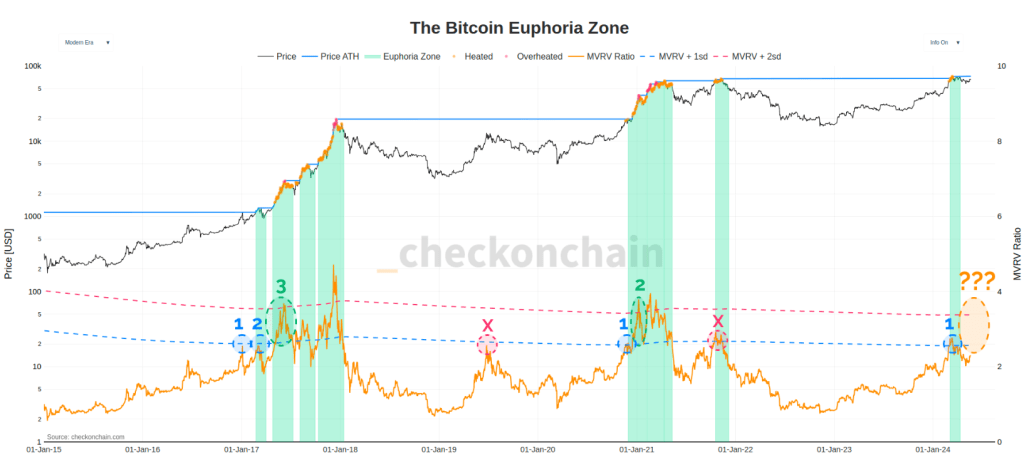
Renowned crypto analyst Checkmate has ignited a spark of optimism with his “Euphoric Bull” theory. According to Checkmate, a surge to a new all-time high could signal a critical shift in market sentiment. This type of bull phase would represent a significant acceleration in bullish momentum, potentially leading to a steeper price increase.
Checkmate’s theory hinges on the Market Value to Realized Value (MVRV) ratio, a metric that compares the current market value of Bitcoin to the total value paid to acquire all Bitcoins in circulation. Historically, when the MVRV ratio climbs above one standard deviation of its average, it has often preceded a shift to a “Euphoric Bull” phase.
#Bitcoin breaking to a new ATH has historically represented a transition point from the Enthusiastic Bull, into the Euphoric Bull.
It also coincides with the MVRV ratio getting above 1 standard deviation, but we rarely clear it on the first attempt.
Bull…Crab…Bull…
A… pic.twitter.com/4YyD179LRS— _Checkmate
(@_Checkmatey_) May 21, 2024


However, Checkmate warns that Bitcoin doesn’t always follow the script on the first try. The market often exhibits cautious behavior, with Bitcoin potentially attempting to breach this key MVRV level multiple times before a decisive breakout.
Bitcoin’s recent consolidation period comes after a surge that saw the alpha crypto reach a six-week high of ,950. While a slight pullback has occurred, Bitcoin is still trading comfortably near the ,000 level, with a healthy daily trading volume. This price movement suggests a potential pause before the next significant move, making the current moment a tense waiting game for both traders and investors.
Breakout Or Consolidation? A Bullish Dilemma
Crypto analyst Rekt Capital has emerged as a key voice in the ongoing debate. Rekt Capital believes a weekly candle closing above ,500 could be the catalyst for a significant breakout. This milestone, if achieved, could trigger a surge in bullish momentum, propelling Bitcoin towards a notable uptrend.
However, Rekt Capital also acknowledges the possibility of an extended consolidation phase. Historically, Bitcoin has exhibited a tendency to consolidate within its re-accumulation range for several weeks before experiencing a breakout. This extended consolidation, Rekt Capital argues, would bring Bitcoin closer to aligning with historical halving cycles, events that have historically preceded major bull runs.
Bitcoin Price Prediction
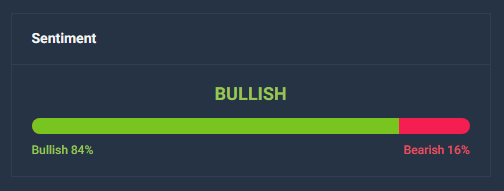
Meanwhile, other analysts are predicting a potential banner year for the world’s leading cryptocurrency in 2025. The high-end prediction of 8,459 represents a staggering potential increase, fueled by factors like historical price trends and the upcoming Bitcoin halving cycle. Buoying this optimism are technical indicators pointing towards a “Bullish” market sentiment with a hefty dose of “Extreme Greed.”
However, a dose of reality is necessary. The wide range between the predicted high and low (,971) underscores the inherent uncertainty in these forecasts. Bitcoin’s notorious volatility, evident in the recent 4.47% price swings within just 30 days, further complicates things. While this level of greed suggests investor confidence, it can also be a warning sign of a potential market correction on the horizon.
Featured image from Vecteezy, chart from TradingView
XRP Price Turns Red Again: What’s Next for the Crypto?
XRP price started a fresh decline after it failed near .5570. The price is now correcting gains and might decline heavily if it breaks the 100-hourly SMA.
- XRP struggled near the .5570 zone and trimmed gains.
- The price is now trading below .5350 and the 100-hourly Simple Moving Average.
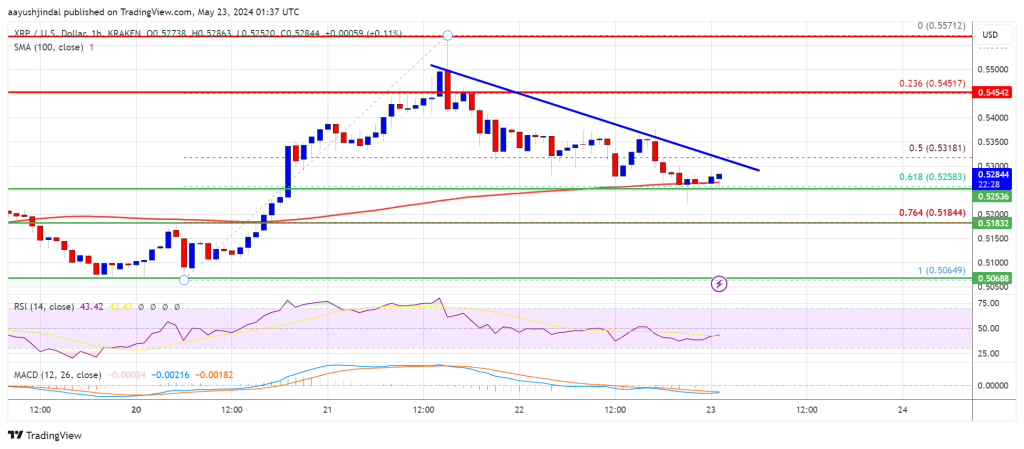
- There is a connecting bearish trend line forming with resistance at .5320 on the hourly chart of the XRP/USD pair (data source from Kraken).
- The pair must stay above the 100-hourly SMA to avoid a sharp decline.
XRP Price Dips Again
After a steady increase, XRP price faced resistance near .5570. The price formed a short-term top and started a fresh decline from .5571, like Bitcoin and Ethereum.
There was a move below the .5420 level. The price dipped below the 50% Fib retracement level of the upward move from the .5065 swing low to the .5571 high. The price even spiked below the .5250 support and the 100-hourly Simple Moving Average.
However, the bulls are protecting the 61.8% Fib retracement level of the upward move from the .5065 swing low to the .5571 high. It is now trading above .5250 and the 100-hourly Simple Moving Average.
Immediate resistance is near the .5310 level. There is also a connecting bearish trend line forming with resistance at .5320 on the hourly chart of the XRP/USD pair. The first key resistance is near .5350. A close above the .5350 resistance zone could send the price higher.
The next key resistance is near .5450. If the bulls push the price above the .5450 resistance level, there could be a steady increase toward the .5570 resistance. Any more gains might send the price toward the .5650 resistance.
More Downsides?
If XRP fails to clear the .5350 resistance zone, it could continue to move down. Initial support on the downside is near the .5250 level and the 100 hourly SMA.
The next major support is at .5185. If there is a downside break and a close below the .5185 level, the price might gain bearish momentum. In the stated case, the price could decline and test the .5065 support in the near term.
Technical Indicators
Hourly MACD – The MACD for XRP/USD is now gaining pace in the bearish zone.
Hourly RSI (Relative Strength Index) – The RSI for XRP/USD is now below the 50 level.
Major Support Levels – .5250 and .5185.
Major Resistance Levels – .5350 and .5450.
Ethereum Price Consolidates: Steadying Before the Next Move?
Ethereum price started a consolidation phase above the ,650 support. ETH seems to be preparing for the next move up toward ,000 in the near term.
- Ethereum started a consolidation after it tested the ,840 resistance zone.
- The price is trading above ,700 and the 100-hourly Simple Moving Average.
- There is a short-term contracting triangle forming with support at ,690 on the hourly chart of ETH/USD (data feed via Kraken).
- The pair could continue to move up unless there is a break below the ,450 support.
Ethereum Price Holds Support
Ethereum price extended its increase above the ,500 and ,650 resistance levels. ETH outperformed Bitcoin and even climbed above the ,800 level. A new weekly high was formed at ,838 and the price is now consolidating gains.
It is holding gains above the 23.6% Fib retracement level of the upward move from the ,065 swing low to the ,838 high. Ethereum is now trading above ,700 and the 100-hourly Simple Moving Average. There is also a short-term contracting triangle forming with support at ,690 on the hourly chart of ETH/USD.
Immediate resistance is near the ,780 level. The first major resistance is near the ,840 level. An upside break above the ,840 resistance might send the price higher. The next key resistance sits at ,920, above which the price might gain traction and rise toward the ,000 level.
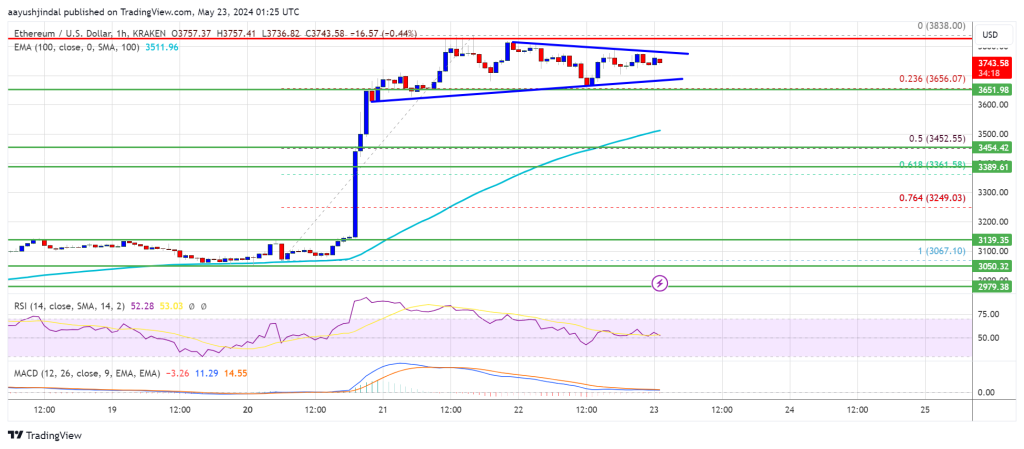
If there is a clear move above the ,000 level, the price might rise and test the ,080 resistance. Any more gains could send Ether toward the ,200 resistance zone.
Downside Break In ETH?
If Ethereum fails to clear the ,780 resistance, it could start a downside correction. Initial support on the downside is near the ,690 level and the trend line.
The next major support is near the ,650 zone. A clear move below the ,650 support might push the price toward ,450 or the 50% Fib retracement level of the upward move from the ,065 swing low to the ,838 high. Any more losses might send the price toward the ,360 level in the near term.
Technical Indicators
Hourly MACD – The MACD for ETH/USD is losing momentum in the bullish zone.
Hourly RSI – The RSI for ETH/USD is still above the 75 zone.
Major Support Level – ,650
Major Resistance Level – ,840
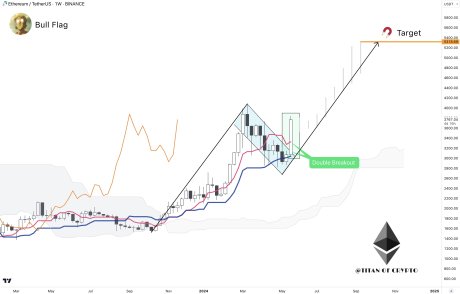
Ethereum Rally Looms: Analyst Predicts ETH’s Next Stop Is $5,300
Titan of Crypto, a well-known cryptocurrency trader and expert, in a daring prediction that has drawn the attention of the crypto community, forecasting an impending significant rally for Ethereum (ETH) to unprecedented heights while putting his next price target for the crypto asset at the pivotal ,300 level.
The analyst’s prognosis indicates that Ethereum, fueled by favorable market circumstances and rising investors’ confidence, is poised for massive gains. This forecast comes at the heel of ETH’s recent robust price performance and increasing market optimism.
Ethereum Path To Massive Rally
In February, Titan of Crypto hinted at the formation of a Bullish Cypher Pattern on Ethereum‘s weekly chart. “Just like for Bitcoin, a bullish cypher pattern is currently playing out on ETH weekly chart as well,” he stated.
Due to this, the expert pointed out several targets for the asset to reach in the near term, such as ,410, ,881, ,353, and ,024, indicating a 38.20%, 50.00%, 61.80%, 78.60% upswingm respectively, from the current price then.
Earlier this month, Titan of Crypto noted that the bullish cypher pattern has successfully developed, and the aforementioned price targets have all been achieved, suggesting a substantial rally is on the horizon.
At that time, the crypto expert underscored that ETH was at the 38.2% Fibonacci retracement level, which he also dubbed the 1st stop (,880). Should the coin manage to sustain this level, Titan of Crypto anticipates a move on the upside from the level.
However, today, as predicted by the expert, Ethereum performed a flawless recovery from the 1st stop (,880) point. As a result, the crypto asset is currently forming a bull flag pattern on the weekly timeframe, citing ,300 as the next price target for ETH to reach.
However, this is not the final destination, suggesting the potential for Ethereum to surge even higher in the upcoming months. With ETH displaying strong price performance, it could mean that the Altcoin season could be coming into play in the near future.
Indicator That Suggests A Price Correction On The Downside
Although Titan of Crypto anticipates a massive rally for ETH, Ali Martinez has underlined the potential for the asset to decline soon. According to Ali Martinez, the TD Sequential indicator on Ethereum’s 4-hour timeframe on May 15, previously displayed a promising buy signal. This development practically led to a 32% rise in the price of Ethereum.
However, now that the ETH Spot Exchange-Traded Funds (ETFs) are generating so much buzz, the indicator has transitioned to a sell signal. Consequently, Ali Martinez predicts a downward correction of one to four candlesticks.
At the time of writing, ETH had increased by over 28% in the past week, trading at around ,728. Despite the recent price momentum, the asset’s market cap and trading volume are down by 1.56% and 28%, respectively.
Dfinity Senior Scientist: Bitcoin’s Next Significant Wave of Innovation Will Revolve Around DAOs
 After the introduction of ordinals, BRC-20 tokens, and more recently, Runes, the next significant wave of innovation on Bitcoin will revolve around Decentralized Autonomous Organizations (DAOs). Aisling Connolly, the Senior Research Scientist at the Dfinity Foundation, has asserted this. He stated that the technology, which is now well-suited to support DAOs and the more mature […]
Bitcoin News
Altcoins ‘Maniac Phase’ Preparing, Analysts Call For Next Leg Up
The crypto industry has seen a positive shift with the recent market recovery. After a Q1 full of bullish sentiment, Q2 saw many sectors of the crypto space brewing a pessimistic feeling toward altcoins.
Experts and market watchers have reassured investors that the price corrections were part of the cycle, predicting that the bullish rally would resume after the cool-off. Now, analysts consider that altcoins are about to embark on a “massive leg higher” for the alt season.
Ethereum’s Surge Refuels Sentiment
The crypto market is up by 8.3%, with a market capitalization of .55 trillion. This market surge has seen Bitcoin, the flagship cryptocurrency, soar past ,000 in the last day.
Similarly, the “king of altcoins” remarkably performed these past 24 hours. Ethereum (ETH)’s price has risen 22% since yesterday, surpassing levels not seen since mid-March.
However, ETH is yet to test its all-time high (ATH) of ,878, set nearly two years ago. As a result, the second-largest cryptocurrency has been criticized this cycle for being “a major disappointment.”
In a turn of events, rumors of an approval of ETH spot Exchange-Traded Funds (ETFs) have refueled investors’ bullish tank, “erasing 65 days of down only” with a single daily candle.
As ETH rallies, analysts believe it’s only a matter of time before the whole altcoins sector surges to kick off the altcoin season. Crypto analyst Rekt Capital highlighted the ‘Crypto Money Flow Cycle’, stating that, now that BTC and ETH have rallied, “it’s time for Altcoins to rally.”
Is The Altcoins Season Here?
During the slowdowns, market watchers have analyzed altcoins’ run this cycle. Altcoin Sherpa has stated that many tokens didn’t “run that hard” during round 1 of the bull run, resulting in his forecast of a 1-4 months “cool-off” period before resuming the uptrend.
Despite the similarities with previous bull runs, the singularities of this cycle, like the approval of Spot Bitcoin ETFs and the Memecoin pre-sale frenzy, have made investors question whether they would see the alt season this time.
Nonetheless, several analysts, who urged investors not to panic before, suggest the community prepares for the “maniac phase” ahead. Crypto Yoddha shared his chart for the 2024 altcoin cycle, stating that the dip was “just a higher low in an uptrend.”

Per the chart, the altcoins market is now looking to retest the .27 trillion resistance level seen in March before testing last cycle’s .7 trillion ATH. To crypto Yoddha, “we’re looking at the bullish continuation” that will lead to a new market ATH during round 2.
Similarly, Top analyst Michaël van de Poppe, who recently sold all his BTC for Altcoins, stated that the Altcoin market capitalization has finished its correction:
The next step: reaching all-time high, which is ~60-70% from here.
I think #Ethereum is likely reaching that in the next 2-4 months.
Lastly, Crypto Jelle considers that “Altcoins are about to embark on a massive leg higher” after an 18-month accumulation period. The analyst compared the market’s recent breakout to a ball being held underwater, claiming that “it’s time for history to repeat.”
