 David Marcus, CEO of Lightspark, a company that offers lightning network (LN) related services, has stated that LN will become the “interoperability neutral settlement layer” for the world. Marcus declared that only Bitcoin is “neutral enough” to be implemented as the enabler between national payment systems, granting companies and institutions adopting it an edge for […]
Bitcoin News
Bitcoin Greed No More: Sentiment Back At Neutral After $57,000 Plunge
Data shows that Bitcoin sentiment has cooled off to neutral from greed following the asset’s latest plunge to the ,000 level.
Bitcoin Fear & Greed Index Has Returned To Neutral Levels
The “Fear & Greed Index” is an indicator created by Alternative that shows the average sentiment among investors in the Bitcoin and wider cryptocurrency market.
This index estimates sentiment by considering five factors: volatility, trading volume, social media data, market cap dominance, and Google Trends.
The metric uses a scale that runs from zero to 100 to represent this average sentiment. All values under 46 suggest that investors are fearful, while those above 54 imply a greedy market. The zone between these two cutoffs naturally corresponds to the territory of neutral mentality.
Now, here is what the Bitcoin sentiment looks like right now, according to the Fear & Greed Index:
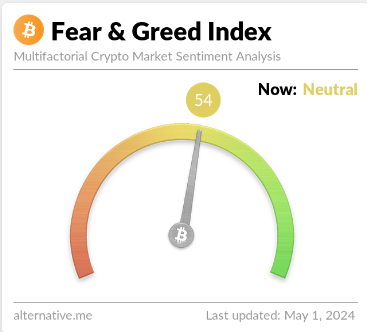
As displayed above, the Bitcoin Fear & Greed Index is at a value of 54, implying that investors share a neutral sentiment currently. However, the neutrality is only just, as the metric is right at the boundary of the greed region.
This is a significant departure from yesterday’s sentiment: 67. The chart below shows how the indicator’s value has changed recently.
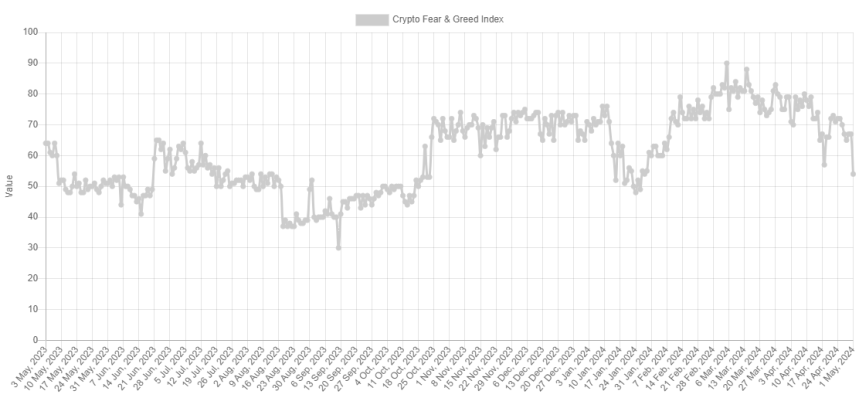
As the graph shows, the Bitcoin Fear & Greed Index has been declining recently. For most of February and March, as well as the first half of April, the indicator was in or near a special zone called extreme greed.
The market assumes this sentiment at values above 75. As the asset price struggled recently, the mentality cooled off from this extreme zone and entered the normal greed region. With the latest crash in BTC, the index has seen a sharp plunge, now exiting out of greed altogether.
Historically, cryptocurrency has tended to move against the majority’s expectations. The stronger this expectation, the higher the probability of such a contrary move.
This expectation is considered the strongest in extreme sentiment zones, as well as extreme fear and greed. As such, major bottoms and tops have often occurred in these territories.
The all-time high (ATH) price last month, which continues to be the top of the rally so far, also occurred alongside extreme values of the Bitcoin Fear & Greed Index.
With the sentiment now cooled to neutral, some investors may be watching for a fall into fear. This is natural because a rebound would become more probable the worse the sentiment gets now.
BTC Price
During Bitcoin’s latest plunge, its price briefly slipped below ,000 before surging back to ,300.
Fidelity Digital Assets ‘Signals’ Report Revises Bitcoin Outlook to ‘Neutral’
 The latest quarterly report from Fidelity Digital Assets (FDA) Research reveals key insights into the bitcoin and ethereum markets as of Q1 2024. With a detailed analysis of market conditions and future outlooks, FDA’s research report provides several predictions for short and long-term trends. Fidelity Digital Assets Spotlights Bitcoin and Ethereum Market Shifts in New […]
Bitcoin News
Bitcoin Coinbase Premium Returns To Neutral: Buying Push Already Over?
The positive Bitcoin Coinbase Premium that drove the latest rally above ,000 has dissipated, suggesting buying has already slowed down.
Bitcoin Coinbase Premium Gap Has Returned To Neutral Levels
CryptoQuant Netherlands community manager Maartunn explained in a post on X that the Bitcoin Coinbase Premium Gap has declined back toward the neutral line.
The “Coinbase Premium Gap” here refers to a metric that keeps track of the difference between the BTC prices listed on cryptocurrency exchanges Coinbase (USD pair) and Binance (USDT pair).
When the value of this metric is positive, it means that the price listed on Coinbase is greater than that on Binance right now. Such a trend implies that the buying pressure on the former is higher than that on the latter platform (or alternatively, the selling pressure on there is just lower).
On the other hand, a negative value can imply the selling pressure on Coinbase is higher than on Binance as the price of the cryptocurrency listed there is lower.
Now, here is a chart that shows the trend in the Bitcoin Coinbase Premium Gap over the past few days:
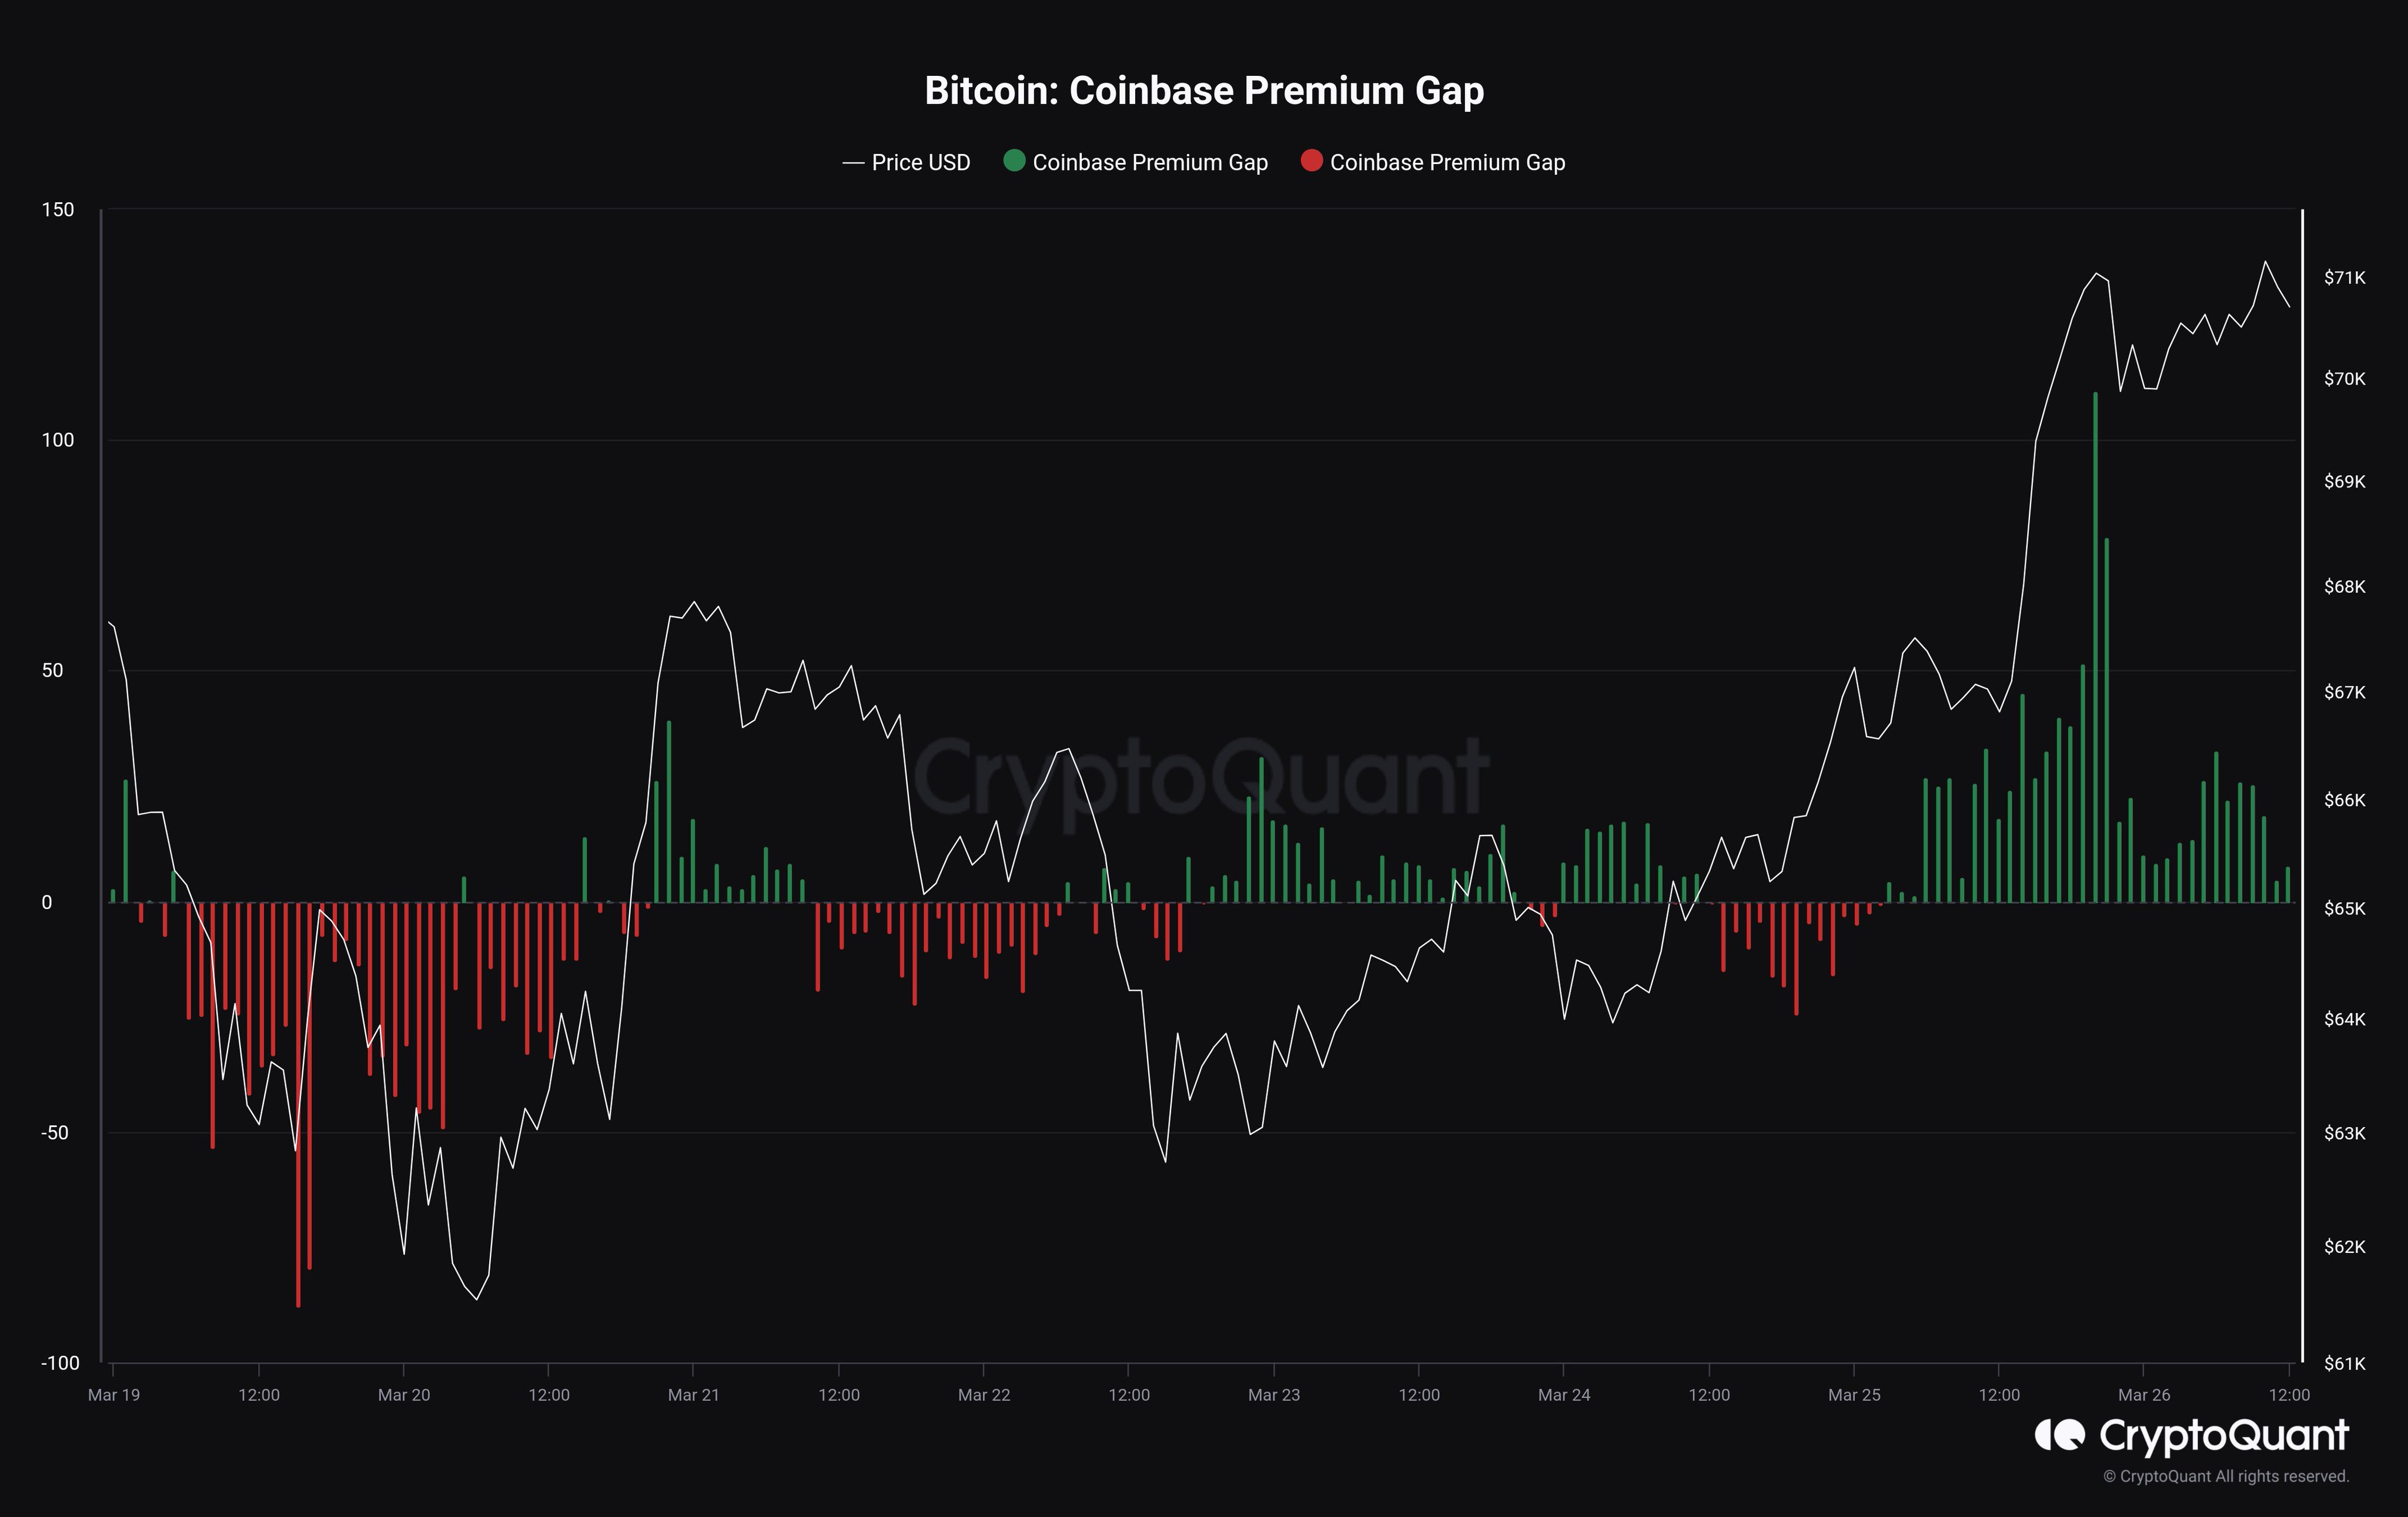
The chart shows that the Bitcoin Coinbase Premium Gap had taken to notably positive values as the latest upward push in the asset’s price had occurred. Since then, though, the metric has fallen, with its value approaching zero.
It would seem that the buying pressure on the platform contributed to the surge. The fact that the rally has slowed since the metric returned to neutral levels may add further evidence.
This isn’t unnatural for this year, however, as the Bitcoin price and Coinbase Premium Gap have shown a pretty tight relationship since the start of 2024.
Coinbase is popularly known as the preferred platform of American institutional investors, while Binance hosts more global traffic. As such, the premium’s value provides insight into how the behavior of the US-based large holders differs from that of world users.
Since the Coinbase Premium Gap has been the driver of the recent price surges, buying from these institutional entities could potentially have provided the fuel.
As the indicator’s value has now neared the neutral mark, it would imply that these whales have lifted their foot off the gas. Given the close relationship the metric and BTC price have held recently, it may be worth keeping an eye on how things develop in the coming days.
BTC may register some decline if the premium flips into the red from here. Naturally, a continuation of positive values would be a bullish sign instead.
BTC Price
At the time of writing, Bitcoin is trading around the ,100 level, up more than 11% over the past week.
Bitcoin Technical Analysis: Oscillators Neutral, Moving Averages Split on Future Direction
 Bitcoin’s price on March 22, 2024, exhibits a fascinating landscape of market dynamics, oscillating between gains and losses across various time frames. Amidst a backdrop of neutral oscillators and a mixed sentiment in moving averages, bitcoin traders are navigating through a volatile environment. Bitcoin Oscillators, quintessential for identifying market momentum and potential reversal points, present […]
Bitcoin News
Goldman Sachs Reevaluates Coinbase, Eyes Neutral Stance Amid Crypto Surge
 In a significant shift, Goldman Sachs has upgraded its rating on Coinbase shares from selling to neutral, citing a surge in crypto prices and record-breaking daily volumes. The adjustment to a 2 price target reflects the bank’s reassessment of the San Francisco-based crypto exchange’s revenue potential and operational strides toward profitability. Goldman Sachs Shifts Gears: […]
Bitcoin News
Ethereum Technical Analysis: ETH Remains Range Bound With Neutral to Bullish Momentum

Ethereum’s price held above ,300 over the past 24 hours, ranging between ,266 and ,333. The cryptocurrency faces technical resistance at its recent highs according to an analysis of key oscillators and moving averages. These indicate continued neutral to bullish momentum over the past month across the daily, 4-hour, and 1-hour timeframes.
Ethereum
Key oscillators for ethereum (ETH) like the moving average convergence/divergence (MACD), awesome oscillator, and momentum indicators show positive momentum, trending upwards from earlier lows. However, the relative strength index (RSI) of 49.3 suggests potential overbought conditions. The Stochastic oscillator also indicates potentially overbought conditions at a neutral 50.9.
Moving averages (MAs) paint a definitively bullish picture, with ethereum’s price continuing to remain above its 10, 20, 50, and 200-day exponential MAs. The 10 and 20-day simple moving averages (SMAs) provide support. The data currently points to strong upward trending over the short, medium, and long term.
The short-term hourly chart shows volatility in price action despite the uptrend, as indicated by the drops after hitting ,333 per unit. ETH traders may look for pullbacks to swing lows or support levels to enter fresh long positions, using tight stop losses below recent lows to minimize risk.
The 4-hour chart smooths out the hourly volatility and noise, revealing sustained higher highs and higher lows. Traders could look for bullish continuation patterns for new long entries. However, ether’s failure to make new highs or break below recent higher lows would indicate weakness and bull exhaustion.
Overall, ether’s oscillators and MAs show a balanced and bullish momentum over the past month across timeframes. But the large drawdown on the daily chart suggests the potential for continued consolidation or a corrective period after the latest uptrend. Traders should watch key support levels if volatility increases.
Bull Verdict:
Overall, the oscillators and MAs indicate a bullish technical posture for ethereum over the past month across the daily, 4-hour, and hourly timeframes. While the leading crypto asset faces resistance at recent highs, the sustained uptrend suggests advantages for bullish traders on pullbacks to key support levels and continuation signals.
Bear Verdict:
Despite the bullish momentum over the past month, the large slide on the daily chart points to potential exhaustion or the top of the ethereum (ETH) uptrend. With oscillators nearing overbought territory, the technicals favor bearish traders looking to capitalize on a corrective period, particularly if the price breaks below key support levels that could signal a trend reversal.
Register your email here to get weekly price analysis updates sent to your inbox:
What do you think about ether’s market action on Monday morning? Share your thoughts and opinions about this subject in the comments section below.
Bitcoin Stabilizes Over $42,000 as Crypto Fear and Greed Index Shifts to Neutral

Recently fluctuating within the realms of “greed” and “extreme greed,” the Crypto Fear and Greed Index transitioned into a “neutral” phase on Sunday, Jan. 28, 2024. This shift coincides with bitcoin’s value jumping slightly over ,000. In the preceding week, bitcoin experienced a subtle rise, approximately 1.5%, in comparison to the U.S. dollar.
From Greed to Neutrality — Market Sentiment Cools
Bitcoin’s value currently stands at ,478 per coin, exhibiting an intraday fluctuation from ,396 to ,824 per unit. As of Sunday, the foremost cryptocurrency’s market capitalization slightly exceeds 3 billion, coupled with a global trade volume of .33 billion. In the broader .715 trillion crypto economy, BTC’s dominance is marked at 48.6%.
Over the course of this weekend, the Crypto Fear and Greed Index (CFGI) hosted on alternative.me observed a shift from “greed” to “neutral” between Saturday and Sunday. In the past month, the index has consistently been in the realms of “greed” and “extreme greed.” Specifically, on Jan. 9, 2024, a surge in BTC’s price resulted in the highest reading of “extreme greed” on the Crypto Fear and Greed Index (CFGI) since 2021.
As recently as last week, the CFGI remained in the “greed” territory, registering a score of 56 out of 100. This sentiment persisted into yesterday with a slightly lower score of 55 out of 100, still within the “greed” category. However, the index for Sunday, Jan. 28, 2024, recorded a score of 54 out of 100, categorizing the day as “neutral.” The CFGI evaluates market sentiment by analyzing factors like volume, market momentum, volatility, dominance, social media, and other trends.
On Bitstamp’s BTC/USD chart for Sunday, there was a significant peak at ,824. Post this spike, the price began a consolidation phase, characterized by smaller fluctuations and reduced volume, indicating a state of equilibrium in the market following the recent increase in the crypto asset’s value. Mirroring the CFGI, BTC’s oscillators and moving averages (MAs) also reflect a period of neutrality and balance, with traders poised for the next significant movement.
What do you think about the latest CFGI metric for bitcoin? Share your thoughts and opinions about this subject in the comments section below.
Bitcoin Lingers in a ‘Neutral’ Phase as the Fear and Greed Index Signals Market Consolidation
On Sunday, October 8, 2023, bitcoin’s price teeters just below the K threshold, marking a 2.6% rise from the previous week. Presently, the Crypto Fear and Greed Index (CFGI) hovers at a “neutral” 50 out of 100, a stance it’s held over the past week. Technical data reinforces this balanced outlook, indicating bitcoin’s price movement has nestled into a tighter band.
Bitcoin’s Tightrope Walk Continues While the Fear and Greed Index Reflects Undecided Sentiments
A week prior, bitcoin (BTC) was priced at ,189 per unit. Over the past day, its value danced between ,103 and ,770. This week witnessed a 2.6% climb in bitcoin’s value, and it surged by 7.9% on a 30-day scale.
Throughout these fluctuations, the Crypto Fear and Greed Index (CFGI) has unswervingly projected its “neutral” position — not just today, but yesterday and the entire past week. In essence, the CFGI serves as a barometer, gauging the prevailing mood of the bitcoin marketplace. Its goal? To arm traders with insights into the collective psyche of market players.

The rationale being that overwhelming fear can depress prices too much, while rampant greed can inflate them excessively. By tapping into current sentiments, traders could pinpoint potential buy or sell moments. Interpreting the CFGI, one encounters phases like extreme fear, fear, neutral, greed, and extreme greed.
On October 8, 2023, alternative.me pegs the CFGI at 50, a slight rise from last week’s 48. Coinmarketcap.com’s “Fear and Greed” index echoes this sentiment, marking a neutral score of 46 on Sunday. With the market exhibiting such neutrality and bitcoin gravitating towards a more streamlined range, it’s evident the market remains indecisive.
Being neutral or ambivalent suggests the absence of a prevailing sentiment. It’s akin to a balance where neither pessimistic bears nor optimistic bulls command the market. However, neutrality doesn’t imply market stagnation. Prices may ebb and flow, but the index conveys a harmony between bullish and bearish forces.
Technical metrics for bitcoin, such as oscillators like the relative strength index (RSI) and stochastic (14, 3, 3), also exhibit this weekend’s neutral sentiment. When oscillators like the RSI and the stochastic (14, 3, 3) display neutrality, it signals that the asset is neither in an overbought nor oversold state.
With the current RSI around 61 and a stochastic reading near 75, there’s a balance between buy and sell pressures. Given these readings from both the oscillators and CFGI, it seems the market is poised in a consolidation phase, awaiting future cues or triggers.
What do you think about the Crypto Fear and Greed signals? Do you expect more consolidation? Share your thoughts and opinions about this subject in the comments section below.
Bitcoin Sentiment Returns To Neutral, Will Traders Embrace Greed Next?
Data shows that Bitcoin investors may be close to embracing greed as market sentiment has surged into neutral territory.
Bitcoin Fear & Greed Index Points At Neutral Trader Sentiment
The “Fear & Greed Index” is an indicator that tells us about the general sentiment among the investors in the Bitcoin and wider cryptocurrency sector. According to the index’s creator, Alternative, the metric takes into account multiple factors for calculating this sentiment.
The five factors it currently uses in the indicator’s value are namely: volatility, trading volume, social media sentiment, market cap dominance, and Google Trends data. Earlier, the index also made use of surveys, but for now, they are on pause.
To represent the market sentiment, the fear and greed index uses a numeric scale that runs from 0-100. All values above the 54 mark suggest greed among the traders, while values below 46 imply fear. The in-between region means the presence of a neutral mentality.
Besides these three basic sentiments, there are also two extreme sentiments, called “extreme fear” (taking place below 25) and “extreme greed” (occurring above 75). Historically, these two regions have been quite significant for Bitcoin, as cyclical bottoms and tops have usually formed in the respective zones.
Now, here is what the Fear & Greed Index looks like for the market right now:
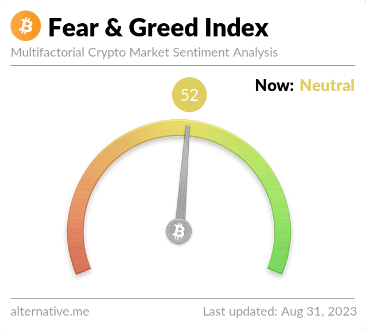
According to the index, the investors as a whole are sharing a neutral sentiment, meaning that they aren’t leaning one way or the other. Although, at the current 52 value, the metric is certainly closer to the greed territory than the fear one.
Earlier in the month, when BTC witnessed a crash from the ,000 level to below the ,000 mark, the sentiment in the market naturally plummeted. Investors had become fearful and had remained so for the duration that the asset consolidated around these lows.
After the rally spurred by Grayscale’s lawsuit victory, though, the sentiment rapidly registered an improvement and surged toward the current neutral values.
The below chart represents how the Fear & Greed Index’s value has changed recently:
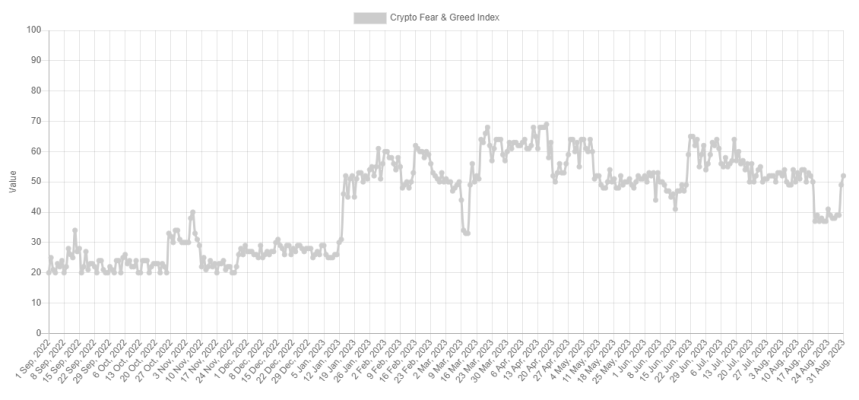
While the sentiment in the market has seen a rapid improvement with the latest rally, the investors haven’t quite yet made up their minds if they want to give in to greed or not.
It’s possible that more positive price action would need to happen before the investors are able to fully embrace the bullish momentum.
Nevertheless, a break into the greed territory would naturally be a green signal for any surge’s sustainability, as it would mean that the majority of the investors are ready to support the move.
BTC Price
After observing a pullback since the rally high, Bitcoin is currently trading around the ,200 level, with investors still enjoying profits of about 3% over the past week.