 While the BRC20 token economy’s market valuation surpasses .8 billion, according to one leading market cap aggregation website, tokens derived from the Runes protocol are beginning to experience price discovery following the launch of the new token standard. The following is a look at several popular runes tokens, detailing their supplies and present market values. […]
Bitcoin News
Navigating the Bitcoin Halving: Glassnode Report Discusses a New Trading Landscape
 As Bitcoin’s network halving event draws near, Glassnode’s latest report sheds light on the evolving trading strategies in the face of significant demand from ETFs, signaling a pivotal shift in the cryptocurrency market. Glassnode Report Unveils Shift in Bitcoin Trading Strategies Ahead of Halving In the countdown to Bitcoin’s much-anticipated halving, the crypto community is […]
Bitcoin News
Navigating the Wormhole Airdrop: Defi’s Next Big Token Drop Explained
 Wormhole, a platform fostering blockchain interoperability within decentralized finance (defi), has unveiled plans for an airdrop of its proprietary token, W. The initiative is part of the protocol’s broader aim toward progressive decentralization, rewarding dedicated users and developers within the Wormhole ecosystem. Wormhole to Airdrop W Token to Advance Defi Interoperability Wormhole, a facilitator of […]
Bitcoin News
Bitcoin Technical Analysis: Navigating BTC’s Ups and Downs as Price Teeters Above $41K

On Thursday, bitcoin experienced a decline, reaching a low of ,600, and has since been hovering slightly above the ,000 mark. The cryptocurrency world is abuzz with speculation about the duration of this downturn, especially as the excitement surrounding the spot bitcoin exchange-traded fund (ETF) begins to wane.
Bitcoin
The bitcoin daily chart as of Jan. 19, 2024, depicts a predominantly downward trajectory. This shift from a peak near ,048 to a more recent low close to ,727 marks notable market volatility. The chart reflects a series of rises and falls, pointing to a market fraught with uncertainty. Although there has been a recent uptick, suggesting a slight recovery, it’s too early to determine if this is just a brief respite or the start of a significant market shift.
Delving into the 4-hour chart, the bearish momentum is markedly evident, highlighted by a repetitive sequence of lower peaks and troughs. This pattern signals persistent BTC selling pressure, a fact corroborated by increased trading volumes during price declines. Such a view amplifies the prevailing negative market sentiment, signaling to investors the likelihood of this trend’s persistence.
The 1-hour chart presents a more detailed snapshot of bitcoin’s pricing trends, showing some stabilization following a steep decline. This phase is characterized by a sequence of progressively higher lows and highs, though this is a short-term phenomenon. This could indicate the initial phase of a potential trend reversal, or it might be a bear flag continuation pattern, hinting at the downward trend’s possible prolongation.
Oscillators offer key insights into market dynamics and potential pivot points. The relative strength index (RSI) is currently at 43, suggesting a neutral position. Other indicators like the Stochastic, commodity channel index (CCI), average directional index (ADX), and awesome oscillator reinforce this neutral view. However, the momentum indicator at -4690 points to a bullish signal, while the moving average convergence/divergence (MACD) at -222 tilts towards bearish sentiment, presenting conflicting signals.
On Jan. 19, bitcoin’s exponential moving averages (EMAs) and simple moving averages (SMAs) for the 10, 20, 30, and 50-day periods signal bearish undertones. However, the 100 and 200-day EMAs and SMAs indicate bullish sentiment, reflecting a potential longer-term upward trend amidst the shorter-term bearish sentiment.
Bull Verdict:
Despite the immediate bearish signals, the long-term indicators point toward an optimistic future for bitcoin. The 100 and 200-day moving averages suggest a strong underlying bullish trend, potentially overriding the current bearish momentum. The mixed signals from oscillators, along with the recent formation of higher lows on the 1-hour chart, hint at a possible reversal.
Bear Verdict:
The prevailing bearish patterns observed in bitcoin’s price movements on Jan. 19, 2023, indicate a continuation of the downward trend. The consistent lower highs and lower lows on the 4-hour chart, coupled with sell signals from short-term moving averages, underscore a strong bearish sentiment. The oscillators, predominantly signaling neutrality, fail to provide a compelling counter-narrative. Unless there is a significant shift in market dynamics, it seems likely that the bearish trend will persist, posing challenges for bullish investors in the near term.
Register your email here to get weekly price analysis updates sent to your inbox:
What do you think about bitcoin’s market action on Friday? Share your thoughts and opinions about this subject in the comments section below.
Circle Report Shows USDC Navigating Challenging Waters in 2023

Despite a challenging 2023 with a substantial decline in circulating supply, a Circle report claims USDC emerges resilient, experiencing a surge in real-world applications and a decrease in speculative trading.
A Resilient Year for USDC Amidst Market Shifts
Circle, the issuer of the USD Coin (USDC), released its “State of the USDC Economy,” covering current key trends and shifting dynamics in USDC and the “new internet financial system.”
2023 was a challenging year for USDC. The stablecoin, which is pegged to the U.S. dollar and backed by liquid cash and cash-equivalent assets, witnessed a decrease in its circulating supply from billion to billion – a 44% decline. This reduction was largely attributed to a shift of assets from the crypto ecosystem to traditional markets, spurred by opportunities brought on by rising interest rates, regulatory pressures, industry bankruptcies, and fraud incidents.
However, in a counterbalancing act, the number of wallets holding at least of USDC soared by 59%, totaling over 2.7 million. This growth occurred amidst a broader contraction in the crypto sector, a move the report considers a signal of confidence in USDC. The stablecoin was an important bridge between the crypto asset economy and traditional finance, with over 7 billion of USDC issued or burned throughout the year.
The Asia-Pacific region, in particular, has witnessed a surge in USDC usage for remittances, with 0 billion flowing into the region in 2022. Circle’s efforts in this region included a partnership with Coins.ph, a Philippines-based exchange, targeting the billion remittance market. The report also states that USDC is playing an important role in addressing the 0 billion trade finance gap in emerging markets.
The report highlights a significant increase in the use of USDC for practical purposes, like remittances and trade finance. Concurrently, it notes a substantial decrease in USDC’s role in speculative trading, which has declined by 90% over the past five years.
What is your stablecoin of preference? Share your thoughts and opinions about this subject in the comments section below.
South Korea’s Crypto Surge — Navigating the ‘Kimchi Premium’ and Massive Trade Volumes
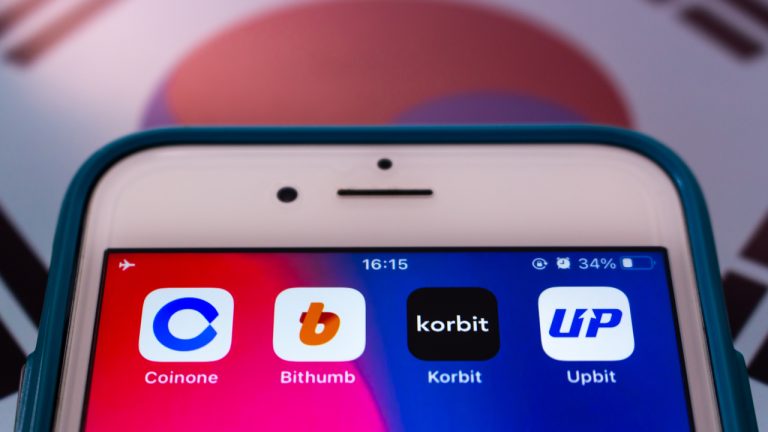
Recent data reveals that South Korea’s crypto trading volume has surged in recent months, with two exchanges, Upbit and Bithumb, contributing over 10% to the global trading volume as of Jan. 4, 2024. Additionally, while the global price for bitcoin hovers around ,356 per unit, in South Korea, it commands a premium, trading at approximately ,317 per coin.
Tracing the Strong Won-to-Crypto Volumes and Premiums in South Korea
As of 8:00 a.m. Eastern Time on Jan. 4, 2024, the global crypto economy has seen a trade volume of approximately .98 billion, with bitcoin (BTC) maintaining a position above the K mark. A significant portion of this trading activity is rooted in South Korea; at this moment, Upbit has conducted billion and Bithumb .7 billion in 24-hour trades.
Together, these two exchanges represent 10.1% of the global crypto trade volume on Thursday. Likewise, South Korean exchanges Coinone and Korbit are experiencing increased crypto trade volumes.
Currently, South Korean platforms are trading bitcoin (BTC) at a premium; at the time of this writing, Upbit’s BTC is valued at 0 above the global average. With BTC priced globally at ,356 per unit, it is trading at ,317 per coin on Upbit, and similar premium rates are observed on Bithumb, Coinone, and Korbit.
Additionally, premiums are noted on SOL, ETH, and various other leading crypto assets. South Korea is historically known for its cryptocurrency premiums, commonly termed the “Kimchi Premium.”
This premium isn’t merely coincidental; it stems from a myriad of factors, primarily the high demand for BTC and other crypto assets within South Korea relative to its supply and international liquidity. Additional factors include rigorous capital controls, the regulatory landscape, and a somewhat insular market resulting from unique foreign exchange regulations.
While the South Korean government has expressed disapproval towards these elevated prices over the years, the premium trend persists. On Jan. 4, 2024, the Korean won accounts for 3.51% of the total bitcoin (BTC) trading volume and 8.06% of global SOL transactions.
The Korean won is particularly significant in the trading of crypto assets such as SEI, POWR, and BLUR, with 34.93% of SEI trades, 72.87% of POWR swaps, and 55.56% of BLUR transactions being conducted in won.
Other cryptocurrencies that are popular among South Korean traders include LSK and ETH. Normally, crypto traders would try to exploit the price difference between two markets for profit, and sometimes people are quite successful.
However, the strict capital controls and regulatory frameworks in South Korea can make such arbitrage opportunities challenging and less efficient, thereby sustaining the premium in the localized region. While the future of these premiums and the broader crypto market remains uncertain, the current trends reflect a robust engagement with digital assets in South Korea.
What do you think about the significant trade volume settled in won and the premiums on specific crypto assets on Upbit, Bithumb, Coinone, and Korbit? Share your thoughts and opinions about this subject in the comments section below.
The Quest to Stabilize GHO — Navigating Challenges to Reach $1 Peg Amidst Aave’s Corporate Rebrand

The blockchain technology enterprise Aave Companies, recently rebranded as Avara, is still navigating challenges in stabilizing its stablecoin GHO, which is currently struggling to sustain its desired peg. The project’s Liquidity Committee is actively working on strategies to strengthen the stablecoin, aiming to elevate its value above .985 by November 30, 2023.
GHO’s Liquidity Committee Targets .98 Value by Month’s End in Stability Push
This week, the overseeing entity for Aave, Sonar, GHO, and Lens disclosed Aave Companies’ transformation into Avara. Concurrently, the company announced its acquisition of Los Feliz Engineering, a firm specializing in Web3 crypto software development. Amidst these developments, the company’s stablecoin continues to trade below its targeted value. Since its inception, GHO has remained below the benchmark, averaging around .96 per unit over the past week.

As of November 17, 2023, the 24-hour trading data shows GHO’s value fluctuating between .957 and .964 per token. Bitcoin.com News highlighted GHO’s struggle to maintain its dollar peg on November 4. At that time, the GHO Liquidity Committee, led by “Token Brice” (TB), was initiating measures to enhance GHO’s value. Six days later, on November 10, TB revealed a series of potential solutions being explored.
TB reported that GHO’s price hovered between 0.96 and 0.97 in the recent week. A social media post underlined that the total supply of 35 million GHO is approaching its cap. On the Maverick Protocol, two pool pairs (GHO/USDC and GHO/LUSD) are being incentivized, alongside new Uniswap Merkl campaigns for GHO/USDC and GHO/USDT pools. Additionally, a new Bunni Pool for GHO/USDC with a broad price range (0.8499 to 1.0496 USDC per GHO) has been established.
TB also mentioned considering strategies to boost GHO’s utility, such as using wrapped GHO (wGHO) as collateral on Aave, while excluding GHO borrowing. The committee’s goal is to elevate GHO’s price to at least .985 per unit by the end of November. “All these initiatives are synergetic with one another, helping to create positive momentum for GHO,” TB stated in conclusion in the social media update.
What do you think about GHO’s issues? Do you think the stablecoin can get up to the parity or .98 by the month’s end? Share your thoughts and opinions about this subject in the comments section below.
Shiba Inu’s Shibarium Returns to Full Operation After Navigating Bridge Issues

The Shiba Inu development team has announced that Shibarium is now fully functional after recent challenges where funds became inaccessible in the bridge. Shiba Inu’s Shytoshi Kusama thanked Sandeep Nailwal, the co-founder of Polygon Labs, who stepped in with crucial resources to address the issue.
Shibarium Back Online After Resolving Bridge Glitch, Team Thanks Polygon Co-Founder
Two weeks prior, Shibarium had faced difficulties with over million in cryptocurrency deposits trapped in its bridge. However, on August 28, an update was shared via a blog post confirming that Shibarium’s layer two (L2) was back in action.
It highlighted that Sandeep Nailwal and the Polygon team were instrumental in resolving the situation. “Quickly after the incident began, I called Sandeep from Polygon directly and without a second thought, he helped provide additional resources to ensure a perfect outcome to the situation,” remarked Shiba Inu’s Shytoshi Kusama.
The blog further specified that transfers involving SHIB, LEASH, and WETH would span 45 minutes to 3 hours, while a BONE withdrawal would take up to seven days. In recent weeks, SHIB dipped 14.9% against the U.S. dollar.
However, a glance at the last seven days reveals a rise of over 6% following the wider crypto market uptick after key updates from the Grayscale lawsuit against the U.S. Securities and Exchange Commission.
As of August 29, SHIB claims the title of the second-largest meme coin by market cap and ranks 16th in the global crypto market. The meme token’s market valuation stands at approximately .94 billion with 8.55 million in global trade volume.
Data from the Shibarium explorer as of 5:00 p.m. Eastern Time (ET) shows the existence of 157,685 wallets. With a block time set at every five seconds, 358,738 blocks have been mined to date. Moreover, the platform has logged more than 490,000 transactions, with over 132,000 taking place just on August 25, 2023.
What do you think about Shibarium coming back online after the initial bridge issues? Share your thoughts and opinions about this subject in the comments section below.
Navigating the Storm: Defi’s Precarious Position Amid a String of Exploits and Market Declines

In the wake of July’s unprecedented wave of decentralized finance (defi) breaches, including Curve Finance’s staggering million exploit, the defi economy has plummeted into a gloomy state. Hovering perilously close to dipping beneath the billion threshold, the total value locked (TVL) in defi hangs on by a thread. Concurrently, the market of defi tokens has endured a sharp 12.55% decline in value in just the span of a single day.
Decentralized Finance’s Dark Summer: Hacks, Scams, and Lower Token Values
Decentralized finance (defi) endured a chaotic summer, culminating in July 2023 as a nightmarish month filled with exploits, hacks, and scams, according to an X post published by Certik. Adding to the turmoil, the defi community watched in dismay as Curve Finance fell victim to a million hack, owing to a security vulnerability in Curve’s liquidity pools that manifested on July 30th, 2023.
At this juncture, the defi token economy’s valuation stands at a precarious .12 billion, having hemorrhaged 12.55% against the U.S. dollar in just one day. For example, in the turbulent span of the past seven days, avalanche (AVAX) witnessed a decline of 4.92%, chainlink (LINK) suffered a loss of 9.17%, aave (AAVE) dipped by 10.21%, and Curve’s native token CRV tumbled down by 15.58%.
In this volatile market, wrapped bitcoin’s (WBTC) market valuation commands a significant slice — amounting to .73 billion — of the defi token economy, even though WBTC’s supply has been exhibiting a contracting trend lately. Amidst the upheaval, three defi tokens that have navigated the storm this past week are telos (TLOS), maker (MKR), and sushiswap (SUSHI).
The broader crypto economy has been mired in a downturn, but the situation grew particularly dire with the July hacking spree, including the substantial Curve Finance breach, instigating profound uncertainty within the defi ecosystem. Throughout 2023, the total value locked (TVL) in defi has managed to hold above the billion mark. However, as the decentralized finance ecosystem faces intensifying strains, this threshold might soon be in jeopardy.
What do you think about the current state of defi? Share your thoughts and opinions about this subject in the comments section below.
Navigating the Wrapped Bitcoin Landscape: 86,000 WBTC Exit Circulation in One Year
Data reveals that since the start of the year, the count of circulating wrapped bitcoins (WBTC) has diminished, plunging by more than 22,000 WBTC. Notably, a year-long assessment reflects an even more significant contraction, with over 86,000 WBTC evaporating from circulation since last July.
A 12-Month Decline of 86,000 WBTC in Circulation
The Wrapped Bitcoin project has been around for over four years, originating as WBTC on the Ethereum blockchain at the dawn of 2019. As of now, WBTC stands as the 16th most valuable asset among a sea of alternative cryptocurrencies, boasting a market value of approximately .73 billion. Despite its ranking as the most prominent wrapped bitcoin (BTC) derivative token, a notable contraction in circulating coins has been observed since the previous year.
To illustrate, rewind to July 13, 2022, when the circulating supply of WBTC stood at an estimated 247,832 WBTC. Today, that number has tapered off to 161,460 WBTC. This translates into a reduction of over 86,000 WBTC, or a significant 34% pullback in circulating supply over the past year. Additionally, a comparison of WBTC’s market valuation reveals substantial growth – ascending from a tad above billion on January 2, 2023, to a markedly more impressive figure of .73 billion today.
However, this augmentation in value primarily stems from the appreciating price of BTC, which was exchanging hands at ,662 per unit on January 2. Now, each BTC coin commands a price of ,328, marking a surge of over 65% since the year’s commencement. Given that WBTC’s prices are tethered to BTC on a 1:1 basis, WBTC’s market capitalization followed suit, even though its circulating supply contracted by 22,088 WBTC in the same period. Thus, of the total 34% reduction since last year, 12.03% of the cutback unfolded in 2023.
Specifically within the Ethereum network, WBTC boasts a total of 74,191 holders. However, the lion’s share of the supply—51.5% to be exact—resides under the control of the top ten addresses. These ERC20-based WBTC tokens are spread across a multitude of decentralized finance (defi) platforms such as Aave, Compound, and Arbitrum. In fact, the top 100 Ethereum-based addresses command 75.16% of the total WBTC supply. Beyond Ethereum, WBTC also finds utility on other blockchains including Arbitrum, Cronos, Fantom, Polygon, Solana, and Avalanche.
What do you think about the number of WBTC removed from circulation over the past 12 months and in 2023? Share your thoughts and opinions about this subject in the comments section below.