 Bitcoin’s valuation presently resides at ,402, boasting a market capitalization of .34 trillion and a 24-hour trading volume of .93 billion. Throughout the previous day, BTC’s price has maintained a tightly consolidated triangular pattern. Bitcoin Bitcoin’s (BTC) daily chart reveals a market that has transitioned from a significant rally to a consolidation phase. After an […]
Bitcoin News
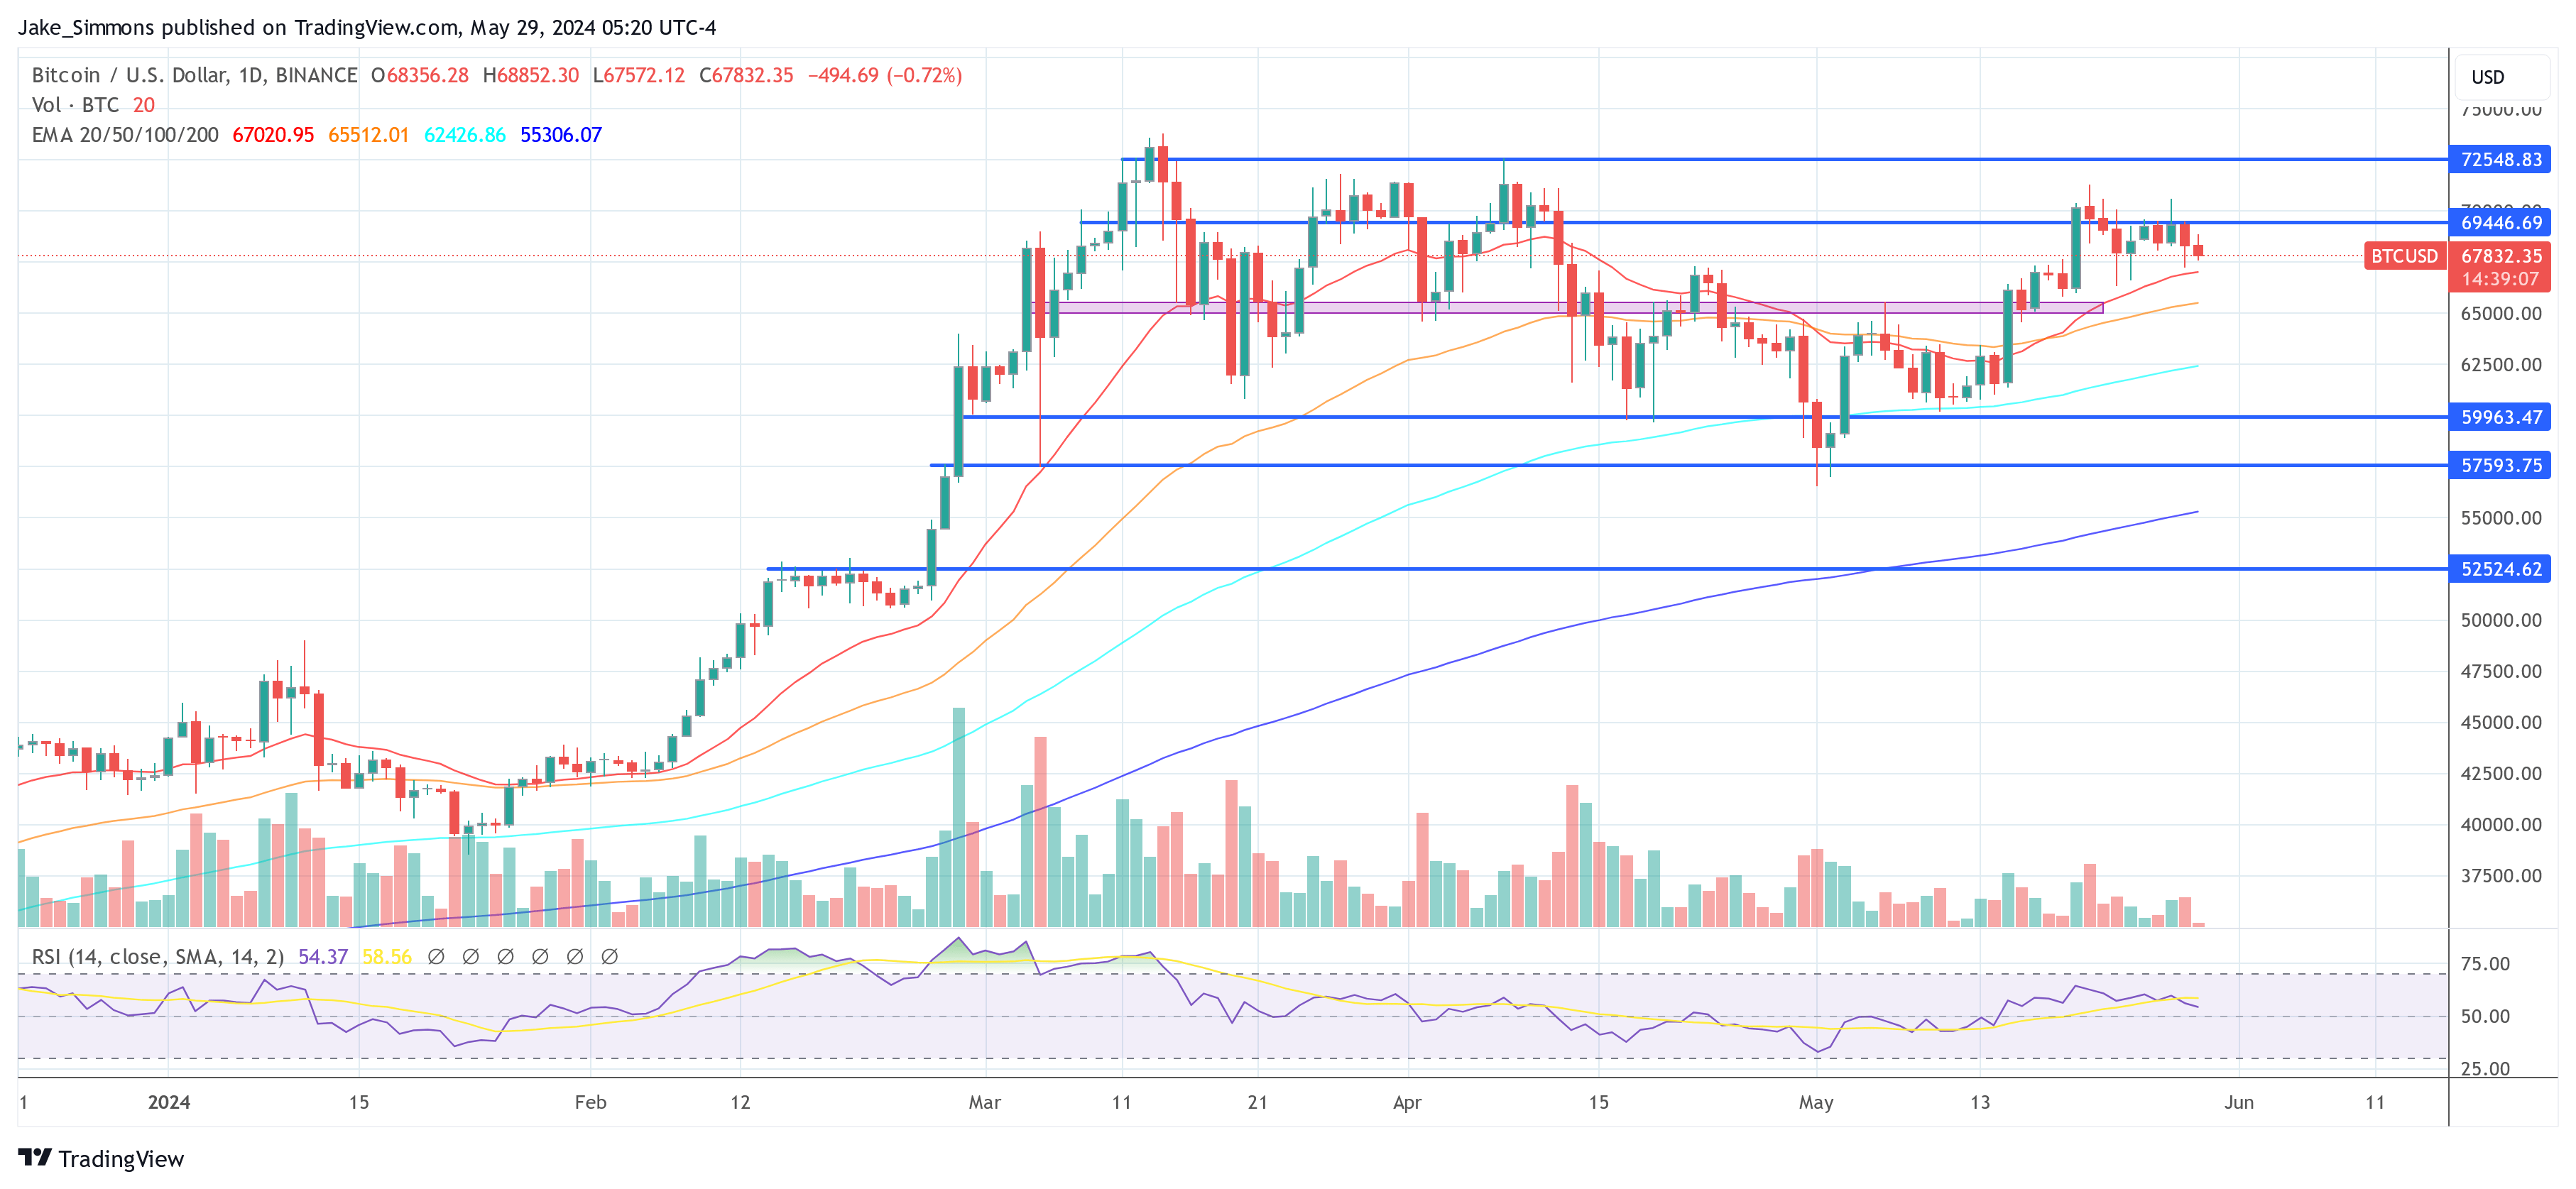
Whales Push Bitcoin Into Narrow Consolidation Range: What To Expect Next
Recent analytical insights from FireCharts 2.0 are indicating significant maneuvers by major stakeholders of Bitcoin—often referred to as “whales”—which are impacting the cryptocurrency’s price movements. These stakeholders are altering liquidity patterns in a manner that suggests a strategic push towards a more tightly controlled trading range.
What Bitcoin Whales Are Up To
According to Material Indicators, an advanced trading analytics, there has been a noticeable adjustment in the distribution of liquidity within Bitcoin’s order book. Specifically, there is a decrease in ask liquidity at higher price points, coupled with an increase in bid liquidity starting from ,000 to ,000. This dynamic is set to compress Bitcoin’s price into a narrower range, a scenario anticipated by the platform since the digital asset escalated above ,000.
The discussions about Bitcoin’s price trajectory have been rife with speculation about a potential pump to ,000, especially following its bounce from a low of ,000. Despite a recent high near ,600, which ended in a sharp rejection, the sentiment remains cautiously optimistic. “There has been a lot of chatter since late last week calling for a pump to k, and there are legitimate reasons why that is a near term target, and why it is still possible despite the rejection from .6k we saw on Monday,” noted Material Indicators.
From a macroeconomic perspective, Bitcoin’s prospects appear exceedingly bullish. “The outlook for Bitcoin is literally as bullish as it’s ever been,” said a representative from Material Indicators during a recent livestream. They refrained from reiterating the specifics, urging viewers to revisit the previous week’s analysis for a deeper understanding.
In contrast, the technical analysis paints a more nuanced picture. Despite the favorable macro outlook, Bitcoin has continuously failed to confirm a resistance/support (R/S) flip at ,000—a crucial level for confirming bullish momentum. This ongoing failure is emblematic of the bulls’ struggle to maintain upward pressure and secure a new all-time high (ATH). By integrating order book data with technical indicators, analysts have observed a progressive downward movement in blocks of ask liquidity, from initial placements around ,000-,000 to recent figures near ,000-,500.
Looking forward, the pivotal question is: how low can Bitcoin realistically go before finding substantial support? To address this, analysts at Material Indicators turn to a combination of technical analysis and real-time order book data. The convergence of Bitcoin’s 21-Day, 50-Day, and 100-Day Moving Averages around ,000-,000 offers a compelling case for potential support. The 21-Day MA, in particular, is favored for its historical reliability as both resistance and support.
Order book data corroborates this analysis, showing a strengthening of ask liquidity resistance above ,000, while bid liquidity is strategically placed down to as low as ,000. The largest concentrations of bid liquidity indicate the strongest support at ,000 and ,000, with somewhat lesser support around ,000 and ,000.
Despite the complex interplay of factors in the near term, the long-term perspective remains overwhelmingly bullish. The essential query for the market is when, not if, a legitimate breakout will take place. Observations from the order book show more than 0 million in asks stacked from ,000 to ,000, juxtaposed with around million in bids between ,000 and ,000. If ask liquidity does not thin out, bid liquidity will need to strengthen significantly to trigger a sustainable break into the s.
According to Material Indicators, the most favorable scenario would see Bitcoin establish a firm consolidation range above ,000, validate an R/S Flip at ,000, and stabilize above this level before aiming for a new ATH. Such a development would not only confirm the bullish trend but also pave the way for sustained upward momentum based on the current order book trends and technical analyses. This trajectory, they suggest, would provide the healthiest market progression in light of the existing conditions.
At press time, BTC traded at ,832.
Mining Rig Producer Canaan’s Q1 Unrealized Gains Narrow Net Loss to $39.4 Million
 In the first quarter of 2024, Canaan Inc. generated .1 in revenues versus the .4 million in costs incurred in the same period which resulted in the company recording a gross loss of .3 million. Nangeng Zhang claimed that Canaan’s revenues in the last quarter exceeded expectations due to the company’s persistent sales efforts and […]
Bitcoin News
Mining Rig Producer Canaan’s Q1 Unrealized Gains Narrow Net Loss to $39.4 Million
In the first quarter of 2024, Canaan Inc. generated .1 in revenues versus the .4 million in costs incurred in the same period which resulted in the company recording a gross loss of .3 million. Nangeng Zhang claimed that Canaan’s revenues in the last quarter exceeded expectations due to the company’s persistent sales efforts and […]
Bitcoin News
Ethereum Technical Analysis: ETH Stabilizes in a Narrow Range

Today’s trading session commenced with ethereum oscillating between ,480 and ,532 in the past hour, enclosed within a daily range of ,472 to ,544. This restricted range hints at a brief stabilization period after a spell of recent market swings. Ethereum maintains a strong market capitalization of 5 billion and a noteworthy trade volume of .11 billion, reflecting its considerable market influence, especially after the recent endorsement of 11 spot bitcoin exchange-traded funds.
Ethereum
Monday’s technical indicators offer a multifaceted perspective. The relative strength index (RSI) at 60.6 leans toward a neutral to bullish outlook. In a similar vein, the Stochastic at 69.8, the commodity channel index (CCI) at 92.0, and the average directional index (ADI) at 19.1 all mirror a neutral market view. Yet, the awesome oscillator at 241.3 and the moving average convergence/divergence (MACD) at 78.8 suggest a positive market trend, indicating a potential underlying bullish drive.
The trend suggested by moving averages (MAs) also leans toward bullish sentiments in the ether market. The exponential moving average (EMA) and simple moving average (SMA) across various time frames (10, 20, 30, 50, 100, 200) uniformly indicate an upward market trend, showcasing a strong, recent bullish trajectory. Notably, the EMAs in shorter durations surpass their SMA counterparts, signaling a rapid adaptation to recent price shifts, thus reinforcing the bullish trend.
Ethereum’s daily chart illustrates an unmistakable ascending pattern with progressive price increases and higher lows, signifying a consistent positive trend in ETH markets. The significant drop on Jan. 11, followed by a rebound on Jan. 12, however, signals a possible recalibration or stabilization after a pronounced upward movement. This pattern advises traders to exercise caution and consider reassessing the bullish trajectory.
Zooming in on the hourly chart, a detailed view of ethereum’s (ETH) price dynamics is observed. This chart displays a recent upward trend marked by successive higher highs and lows, though it has been subject to notable fluctuations since Jan. 11, 2024. These hourly changes underscore the importance of precise timing for entering and exiting trades in short-term trading, especially given the clear volatility.
In the 4-hour chart, which smooths out the hourly variations, a more coherent view of ethereum’s medium-term trend emerges. It showcases the current resilience of ethereum, as evidenced by its recovery from recent dips. This recovery suggests a potentially opportune moment for market entry, particularly if the price shows signs of a bullish continuation pattern or rebounds off key moving averages or trendline support. However, traders should remain alert to any indicators of a weakening trend.
Bull Verdict:
The prevailing data from the 1-hour, 4-hour, and daily charts for ethereum (ETH) on Jan. 15, 2024, conveys a robust bullish sentiment. The combination of sustained buying pressure, as indicated by moving averages and oscillators, alongside a stable market capitalization, points towards an upward trajectory for ethereum.
Bear Verdict:
Conversely, a bearish perspective might interpret the same data with caution. Despite the bullish indicators, the narrow trading range and the neutral stance of some oscillators could suggest a potential market saturation or a forthcoming correction. ETH traders with a bearish outlook may see this as a signal for potential profit-taking or reallocation of assets, anticipating a possible downturn or stagnation in ethereum’s price in the near future.
Register your email here to get weekly price analysis updates sent to your inbox:
What do you think about ether’s market action on Monday morning? Share your thoughts and opinions about this subject in the comments section below.
A Look at the Fed’s Recent Custodia Bank Denial and the Central Bank’s Push Back Against Narrow Banking

Over the past century, the number of American banks has significantly decreased, dropping from 30,000 banks in 1921 to 4,997 U.S. banks in 2021, according to data from the Federal Reserve. Recently, the U.S. central bank denied Custodia Bank of Wyoming, a financial institution that holds .08 for every dollar deposited by customers. Although there appears to be a need for such a bank after the collapse of three major U.S. banks, the Federal Reserve stated that board members have “heightened concerns” about institutions with plans to focus solely on a narrow sector.
The Fed’s Explanation on Why it Denied Custodia Bank Highlights Adversity to Crypto-Asset Sector
Shortly before the collapse of Silvergate Bank, Silicon Valley Bank, and Signature Bank, the Cheyenne, Wyoming-based financial institution, Custodia Bank, was denied membership in the Federal Reserve System. The Federal Reserve Board specified that the application submitted by Custodia was “inconsistent with the factors required by law.” This week, the Fed published its explanation as to why it rejected the Wyoming bank. Custodia would be distinct from the numerous banks currently in operation, as it holds a complete reserve and more to cover deposits.
A statement from Custodia published on March 24 highlighted the need for a bank that operates in this manner, following the collapse of several banks. “Historic bank runs in the last two weeks underscore the dire need for fully solvent banks that are equipped to serve fast-changing industries in an era of rapidly improving technology,” the company stated. “That is the exact model proposed by Custodia Bank – to hold .08 in cash to back every dollar deposited by customers. Regrettably, the Federal Reserve did not pay enough attention and allowed bank run risks to accumulate at conventional banks.”
The Fed stated in its decision that it had “fundamental concerns” about Custodia’s application, including its “novel and unprecedented features.” One problem the Fed has with Custodia’s business model is its concentration on narrow banking and the provision of services to crypto clients. “In general, the board has heightened concerns about banks with business plans focused on a narrow sector of the economy,” the U.S. central bank’s board stated. “Those concerns are further heightened concerning Custodia because it is an uninsured depository institution intending to concentrate nearly solely on offering products and services connected to the crypto-asset sector, which raises greater concerns of illicit finance and safety and soundness risks.”
Could Narrow Banking Pose a Threat to the Current Fractional Reserve Model?
Narrow banking is a system that restricts lending activities to only safe, low-risk investments and maintains a 100% reserve requirement against these investments. It is sometimes called “100% reserve banking.” However, as Bitcoin.com News reported in another article on fractional reserve banking, narrow banking is not a widespread practice these days, especially among the 4,997 banks in the United States. The U.S. has not witnessed many narrow banking practices since the Suffolk System, a method developed by a group of New England-based banks in the early 19th century.
During the Suffolk System, member banks had to maintain 100% of their deposits in reserve with the Suffolk member banks, which issued a common currency that could be used by customers of any participating bank. Despite its success in stabilizing the New England banking system, the Suffolk System was eventually replaced by fractional reserve banking. The system is also believed to have functioned similarly to modern-day central banks, as one study indicates that the “private commercial bank also provided some services that today are provided by central banks.”
The International Monetary Fund (IMF) has published a paper on narrow banking, but the author of the report says that the “economic costs of narrow banking could be particularly significant in developing countries.” The IMF report also suggests that a core banking model would be a better alternative. The U.S. Federal Reserve has been pushing back against narrow banking for quite some time, even before the Custodia denial. An editorial published by klgates.com in 2019 detailed how “the Board of Governors of the Federal Reserve System recently took action aimed at maintaining the status quo.”
The article noted that on March 12, 2019, the U.S. central bank issued an advance notice of proposed rulemaking (ANPR) to Regulation D. The authors, Stanley Ragalevsky and Robert Tammero Jr., detailed that the Fed ANPR came around the same time the Federal Reserve Bank of New York won a lawsuit against the financial institution TNB USA. The “nonbank” TNB sued the Federal Reserve in 2012 over its application to become a narrow bank in 2010.
At the time, TNB claimed that the Federal Reserve’s delay was motivated by pressure from traditional banks that saw TNB’s narrow banking model as a competitive threat. TNB’s argument may just be the crux of the situation as the current modern banking model is entirely based on the fractional reserve model. At a time when banks are failing, a narrow bank or 100% reserve-based financial institution’s model could be very popular.
It could also encourage other banks to follow the trend, as outlier banks that copied member banks within the Suffolk System in the early 19th century benefited from the idea of full reserve banking. Counter-arguments against the Suffolk System suggest the bank was attempting to establish a monopoly. However, with the number of banks decreasing by 83.34% over the last 100 years from 30,000 to 4,997, one could argue that there’s a monopoly over free banking practices.
Meanwhile, Custodia says it is taking its issues with the U.S. central bank to court. “The recently released Fed order is the result of numerous procedural abnormalities, factual inaccuracies that the Fed refused to correct, and general bias against digital assets,” Custodia explained in a statement on Friday. “The recently released Fed order is the result of numerous procedural abnormalities, factual inaccuracies that the Fed refused to correct, and general bias against digital assets,” Custodia said. “Rather than choosing to work with a bank utilizing a low-risk, fully-reserved business model, the Fed instead demonstrated its shortsightedness and inability to adapt to changing markets.”
Custodia added:
Perhaps more attention to areas of real risk would have prevented the bank closures that Custodia was created to avoid. It is a shame that Custodia must turn to the courts to vindicate its rights and compel the Fed to comply with the law.
What are your thoughts on the Federal Reserve’s stance towards the crypto-asset sector and narrow banking methods? Share your opinions in the comments section below.
Bitcoin Price Remains Within A Narrow Range, What’s Next For The Bears?
Bitcoin price has been moving within a restricted range for over a week now. The coin had attempted to move north over the past few days. However, it has not managed to trade near the ,000 mark.
The movement of the Bitcoin price has mainly remained sandwiched between ,000 and ,000, respectively.
Over the last 24 hours, BTC slipped by 0.4%, confirming that there has not been significant price movement.
In the past week, BTC depreciated by 1.1%. Overall market strength has been choppy, which is why market movers have remained dull on their respective price charts.
The technical outlook of Bitcoin continued to side with the bears. Buying strength has remained low as a result of a slowdown in demand for Bitcoin.
According to its one-day chart, over the next trading sessions, Bitcoin is set to retrace further and trade close to the ,900 price mark.
This support level marks a crucial price level for the coin as it will determine the next move of Bitcoin depending on the demand for the coin.
Bitcoin Price Analysis: One-Day Chart
Bitcoin was priced at ,100 on the one-day chart | Source: BTCUSD on TradingView
BTC was trading at ,100 at the time of writing. The cryptocurrency has moved up and down within the range of ,400 and ,000.
Continual movement in a similar pattern will strengthen the bears even further. Overhead resistance for the coin was at ,600, moving past which BTC will again have a tough time crossing past ,000.
The bulls will only take over from the ,000 price mark. On the other hand, the nearest support would be ,900. This is a crucial support line for the coin.
A fall from there will cause BTC to move to ,300 and then to ,400. The amount of Bitcoin traded in the last session turned green, which could indicate a small rise in buyers.
Technical Analysis
Bitcoin registered a small uptick in buying strength on the one-day chart | Source: BTCUSD on TradingView
Demand for the coin has seen a slight increase over the last 24 hours. For most of this month, Bitcoin’s demand has remained low, and sellers have taken over the market.
The Relative Strength Index was below the half-line, and that meant a lower number of buyers as compared to sellers on the one-day chart.
Bitcoin price was below the 20-SMA line, which also was in accordance with fewer buyers as sellers were driving the price momentum in the market.
Bitcoin depicted buy signal on the one-day chart | Source: BTCUSD on TradingView
However, BTC still continued to display buy signal on the chart. However, those were declining and would soon be replaced by sell signal.
The Moving Average Convergence Divergence shows the price momentum and direction of the asset. MACD still displayed green signal bars, which were buy signal for the coin.
The Parabolic SAR also indicates the price direction of the asset. The Parabolic SAR was above the candlesticks, which meant that the price was bearish for the asset.
The indicator indicated that the price of Bitcoin was in a downward trend, which could be reversed if demand returned to the chart.
Featured image from UnSplash, Chart: TradingView.com
NewsBTC
Value of all Bitcoins Surpasses Poland’s Stock of Narrow Money
The year 2017 has resulted in massive financial growth for all cryptocurrencies in existence today. Bitcoin is the one currency […]
The post Value of all Bitcoins Surpasses Poland’s Stock of Narrow Money appeared first on Bitcoin Network, News, Charts, Guides & Analysis.