 Jan Nieuwenhuijs, a gold market analyst, has predicted a new multi-year bull market for gold. According to different factors, including the low percentage of gold as part of the global international reserves, and the size of the equity market, gold prices might be preparing to rise, putting prices of ,000 per ounce in the realm […]
Bitcoin News
DOGE Breaks Free From Multi-year Descending Order, What’s Next?
Dogecoin has also benefited from the general crypto market rally, gaining over 7% in the past week. DOGE has settled at the .069 price range today, with its market cap above billion, showing its massive adoption. Also, on the weekly chart, DOGE shows signs of a breakout pattern as more buyers continue to accumulate the tokens.
According to crypto analyst Ali Chart, Dogecoin has broken out of a multi-year descending triangle pattern on the weekly chart. The analyst believes this confirms a buy signal for the asset on the weekly timeframe, making its future outlook bullish.
DOGE Breaks Out Of Descending Triangle Pattern
DOGE entered a descending triangle pattern from July 2023 as bearish conditions in the market forced a decline. However, the buyers forced a breakout from this pattern in October as the general market moved into an uptrend.
Remarkably, DOGE flipped the .067 resistance level into support, rallying to the .071 resistance level. Furthermore, DOGE has formed two consecutive green candles on the weekly chart, confirming its break out of the descending triangle.
Related Reading: Ethereum Resilient Above ,800 Pre-FOMC Meeting – Details
Additionally, the Relative Strength Index (RSI) displays a value of 51.8 in the neutral zone and moving sideways. It implies that while the buyers are dominant, some traders are beginning to make a profit, leading to a slight decline. However, if the RSI moves to 55, the buyers will likely resume the accumulation phase.
Also, the Moving Average Convergence/Divergence (MACD) is above its signal line, displaying a buy signal on the weekly chart. Moreover, the green Histogram bars confirm that the buyers are not yet done with the accumulation of DOGE. If DOGE breaks above the .071 resistance level, it will likely continue on its rally in the coming weeks.
Whale Movement Aiding Dogecoin’s Price Gains
According to the crypto tracking platform Whale Alert, a dormant address holding over 5.39 million DOGE tokens valued at 2,461 has been reactivated. Notably, this address remained inactive for almost 10 years, with its last activity in 2013 when DOGE launched in the public market.
Whale Alert confirmed that this whale transferred 392,000 DOGE to a new blockchain address. Also, a massive 350 million DOGE tokens were transferred to the crypto exchange Robinhood on October 27 from a whale address.
These transfers are likely aiding Dogecoin’s rally in the past week due to increased on-chain activity. Also, the general price uptick in the crypto market led to a rally for meme coins.
Furthermore, Dogecoin’s profile as one of the largest cryptocurrencies by market cap is aiding its price rally. Therefore, DOGE’s uptrend may continue in the coming weeks if the general market sentiment remains positive.
NFT Fantasy Game Sorare Partners With Premier League for Multi-Year Licensing Deal

Sorare, a Paris-based NFT (non-fungible token) fantasy game startup, has closed a deal with the Premier League, the first soccer division in the U.K., to make teams and players of the league part of its roster. According to reports, the multi-year agreement involves payments of tens of millions of pounds per year to the league.
Sorare Includes Premier League in Its Platform
Sorare, a Paris-based fantasy NFT game startup, has closed a deal with the soccer Premier League of the U.K. to use its likenesses as part of its gaming platform. Users of the app will be able to build their own teams featuring players and teams of the aforementioned league. With this agreement, Sorare boasts five of the most important European leagues on its platform, including the first division of soccer in Spain, the Spanish Laliga.
While the NFT model has faced several difficulties due to the downturn of the cryptocurrency market, Sorare allows anyone to list players as part of their fantasy teams without having to purchase their collectibles in a free-to-play game mode. Sorare CEO Nicolas Julia explained that many players have migrated to this game mode, as 87% of the players don’t spend money on the platform.
Julia explained that the platform relies on the transactions of high-power NFT users to be profitable, as unique collectibles are still available on the platform.
Deal Details
The deal reportedly had to be maintained in secret because the Premier League was also negotiating with other platforms with similar agreements. According to Sky News, the deal will be replacing another partnership, with Consensys, an Ethereum software company that had been dropped last year.
While there have been no official announcements on numbers, Financial Times reported that the deal involves the payment of “tens of millions of pounds per year,” with each payment being dependent on the performance of the app. The deal also allows the Premier League to take a stake in the fantasy startup.
Sorare experienced significant growth in 2021, raising 0 million in September as part of its Series B funding round that was led by Softbank. At that time, the company reached a valuation of more than billion.
In September last year, the company announced a partnership with the National Basketball Association (NBA) to launch an NFT-based game featuring players and teams from the league. Also, in November, Argentine soccer superstar Lionel Messi became an investor and ambassador of the Sorare brand.
What do you think about the deal Sorare closed with the Premier League? Tell us in the comments section below.
Bitcoin Surges To 23,000 As Miners Sales Sees Multi-Year Low
Bitcoin has continued with its bullishness as it surged its price above the USD,000 level, a positive signal amid miners reduced the sales of their mined coins. On-chain flows flagged by Bitifinex analysts indicate that the amount of Bitcoin moved from Bitcoin mining addresses to wallets owned by cryptocurrency exchanges has declined to multi-year lows.
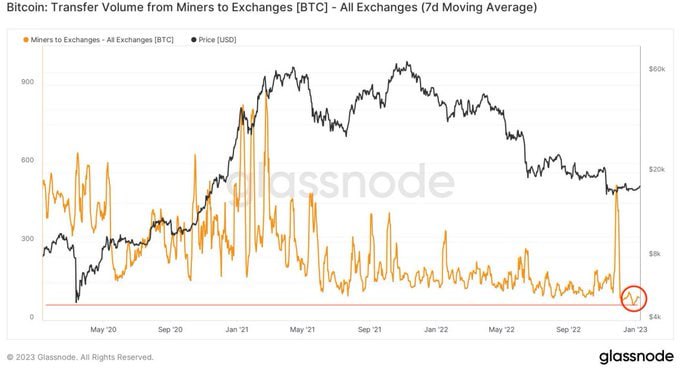
Selling Power Low, Favorable For A BTC Rally
As per a Bitfinex analyst, Bitcoin miner sales are at a three-year low. The report claims that the selling could be a sign that Bitcoin miners are in the mood to accumulate coins as they expect the surge of prices of the flagship cryptocurrency.
The declined Bitcoin sales from mining companies mean low selling pressure from these market actors. Therefore, it signals bullishness for the broader market.
The analysts, however, stated that the recent uptick in Bitcoin price might witness a correction as investors try to recoup their profits amid the current price surges.
The analysts identified large wallet sizes (>M) as the majorly responsible for accumulating Bitcoin. They further said such wallets, as well as major market actors, are the ones creating the buying pressure that comes after the FTX saga and a series of bearish events generally witnessed last year.
The analysts mentioned that since the second week of January, the numbers of wallets with ,000 and ,000 worth of Bitcoin have increased. The analyst further acknowledged that the trading activities of retail investors had accompanied the uptrend.
According to the figure above, the current low Bitcoin selling pressure coincided with the lowest sales in November last year. The current low level signals a green (bullish) indicator for the cryptocurrency.
When miners sell more BTC, it implies a bearish for the coin value. Conversely, when mining firms don’t have the selling urge, this suggests a bullish trend for the crypto market.
Today’s Bitcoin Price
Bitcoin has surged its value by almost 40% this month, trading at ,909, up 1.48% on Tuesday. The crypto is trading at levels not witnessed since the downfall of the FTX exchange. BTC volume stands at about .82 billion, an increase of 12.78% in the past 24 hours, as per Coinmarketcap.
As highlighted above, the rise in Bitcoin value could be attributed to whales committed to accumulating coins amid surging prices. The bullish trend is also seen in the global crypto market capitalization, which is trading at a higher level, around .06 trillion, up 1.27% in the last 24 hours, according to Tradingview.
Bitcoin Supply On Exchanges Hits New Multi-Year Low Of 13.27%
On-chain data shows that the Bitcoin supply on exchanges has continued to go down despite the crash, and has now hit a multi-year low of 13.27%.
Percentage of Bitcoin Supply On Exchanges Sinks To Multi-Year Low
As per the latest weekly report from Glassnode, the percentage of the BTC supply on exchanges has now declined to a multi-year low of around 13.27%.
The “percentage of supply on exchanges” is an indicator that measures the percent of the total circulating Bitcoin supply that’s currently stored in exchange wallets.
When the value of this indictor goes up, it means the amount of coins held by exchanges is going up. This trend can be bearish for the price of the crypto as investors usually deposit their BTC to exchanges for selling purposes.
On the other hand, when the metric moves down, it implies holders are withdrawing their coins from exchanges, thus reducing their reserve.
Such a trend may be bullish for Bitcoin as the supply on exchanges is usually considered the selling supply, and it going down would mean there is lesser sell pressure in the market.
Related Reading | Why Bitcoin Could Hit K By The End Of 2022, According To This Prediction
Now, here is a chart that shows the trend in the percentage of BTC supply on exchanges over the past year:
Looks like the value of the indicator has been on a downtrend for a while now | Source: The Glassnode Week Onchain – Week 5, 2022
As you can see in the above graph, the percentage of the Bitcoin supply on exchanges has now hit a multi-year low of 13.27%.
It seems like the indicator has continued on a downtrend despite the struggling price of the crypto recently. Since the all-time high in November, the metric has decreased by about 0.28% as 42.9k BTC has exited exchanges during the period.
Related Reading | This Bitcoin Volatility Index Pattern Suggests A Short Squeeze May Be Near
This trend has been different from what happened following the crash in May of last year. There, the exchange supply rose up and sustained at high values for a while until the price started moving back up again.
The current reducing exchange supply shows investors may be in a state of accumulation, which could be bullish for the price of Bitcoin in the long term.
BTC Price
At the time of writing, Bitcoin’s price floats around .5k, up 6% in the last seven days. Over the past month, the crypto has lost 17% in value.
The below chart shows the trend in the price of BTC over the last five days.
BTC’s price seems to have held steady above the k price mark in the last few days | Source: BTCUSD on TradingView
Featured image from Unspash.com, charts from TradingView.com, Glassnode.com
NewsBTC
The National Women’s Soccer League Secures Multi-Year Deal With Voyager
The National Women’s Soccer League (NWSL) has signed a multi-year deal with crypto platform Voyager Digital to become the latest league to step into the space.
What This Deal Means For All Those Involved
One of the fastest growing crypto platforms, Voyager, has now entered the soccer world for the first time at this level, and this is big news for those who are keeping an eye on the Voyager platform and token. CEO Steve Ehrlich had an interview with CNBC this past week, and he spoke on his excitement to enter a new world and connect people in crypto through sport.
Related Reading \ Next Bitcoin ‘Buy The News’ Event Upcoming?
“We see this as an opportunity to really engage with the NWSL player, fan and that community in a way that nobody has before,” Voyager CEO Steve Ehrlich said. “What’s really intriguing to me is engaging with women’s sports, and that’s a very important aspect for us because it’s a market that we believe is ripe for education and an opportunity to give these women a stronger foothold on their financial future through crypto.”
Ehrlich added, “we are extremely proud to partner with the NWSL, specifically to help the league grow and provide its players with crypto education and direct financial support, paid in crypto,” . “We believe strongly in the future of these players and this league, and we can’t wait to get started.NWSL interim CEO Marla Messing said in a statement.”Voyager’s investment in the league is especially innovative because we’ve collectively designed the partnership to include direct financial resources for every one of our players, as well as education on the revolutionary changes underway in digital assets,”
Voyager’s token, VGX, has not responded dramatically to the news around the NWSL partnership, but looks to be finding a new support level. | VGX-USD on TradingView.com
Scoring A Goal Through Soccer
Many other sports franchises and teams have partnered up with specific wallets, exchanges, and blockchain-focused companies lately. What makes this special is the fact women’s soccer will be a focal point for Voyager’s push in sports, especially given the NWSL’s recent growth. In a heavily male-dominated crypto landscape, the partnership will help further the development of having more women involved in crypto.
Women’s sports gets put in shade, but women’s soccer happens to be something that is too big to not see lately. Steve Ehrlich concluded his conversation with CNBC with more statements talking about the importance of this deal.
A “significant portion” of the investment that Voyager is making in the NWSL as part of the deal will create a fund that will be split across each player and put into their own individual Voyager crypto account, Ehrlich said, declining to provide specific financial details. Players will also receive financial education on crypto from Voyager.
Related Reading | GreedSwap: Super Producers Cool And Dre Help Launch New Coin & Crypto Label
XRP Breaking This Key Multi-Year Level Could Spark a Massive Rally
XRP has been moving in close tandem with Bitcoin and Ethereum in recent times, struggling to garner any independent momentum.
This correlation exposed it to downside last week, before throwing it into a bout of prolonged consolidation.
The cryptocurrency’s price is now hovering around .29, which is around where it has been trading throughout the past several weeks.
This does mark a slight climb from recent lows of .27 that were set earlier this week, but the crypto is still struggling to garner any clear momentum in the near-term.
That being said, one analyst is now noting that XRP is on the cusp of confirming key historical resistance level as support.
If successfully flipped into support, he believes the crypto could soon see a parabolic surge that sends its price rocketing up towards .475 in the near-term.
XRP Remains Stuck Beneath .30 as Selling Pressure Ramps Up
At the time of writing, XRP is trading up just over 1% at its current price of .28. This is around where it has been trading throughout the past week, as both its buyers and sellers have reached an impasse.
This lack of momentum is primarily rooted in the lackluster price action seen by both Bitcoin and Ethereum, which have been consolidating throughout the past few weeks.
It is important to note that XRP remains highly correlated to these assets, so whether or not it can push higher may depend on where they trend in the near-term.
This may bode well for the cryptocurrency, as both BTC and ETH are showing some signs of strength today.
While Bitcoin sees a slow ascent towards its key ,000 resistance, Ethereum was able to garner a massive influx of buying pressure that sent it surging past 0. If it stabilizes above this level, it may create a tailwind that lifts Bitcoin – and XRP – higher in the days ahead.
This Key Level Could Spark a Rally Towards .475
One analyst explained that he is watching for XRP to see a parabolic rally up towards .475 in the near-term.
He believes that this movement will come about as a result of a strong flip of .28 into support – as this level was previously strong resistance for the crypto.
If established as strong support over an extended period, it could act as a springboard to send XRP flying higher.
“XRP: Still consolidating around this ever so important S/R that dates back 3 years. Ultimately expecting this to move up over the next few months at it’s own pace. Eyes on .475 in the coming weeks.”

Image Courtesy of Pentoshi. Chart via TradingView.
For this possibility to come to fruition, XRP must be guided higher in the near-term by both Bitcoin and Ethereum.
Featured image from Unsplash.
Chart via TradingView.
These 4 Trends Show Bitcoin Is on the Verge of a “Multi-Year Bull Run”
Bitcoin is pressing higher after consolidating under ,000 for two weeks. The asset trades at ,400 as of this article’s writing, having broken above important resistance levels.
BTC remains below critical long-term resistances at ,000, but analysts are expecting the start of a macro bull run. They cite a confluence of fundamental, on-chain, and technical trends suggesting that Bitcoin is gaining momentum.
Related Reading: Crypto Tidbits: MicroStrategy’s 0m BTC Purchase, Ethereum DeFi Boom, BitMEX KYC
Bitcoin Is on the Verge of a Big Run
Prominent Bitcoin proponent “Vortex” recently noted that there are four clear signs that BTC is “beginning a multi-year bull run” reminiscent of the last one:
- The adoption of Segregated Witness (SegWit), a Bitcoin scaling technology, has just reached a new all-time high as exchanges continue to implement the technology. SegWit allows for the blockchain to process more transactions, allowing for more users to transact on Bitcoin at a lower cost.
- The hash rate of the Bitcoin network has reached a new all-time high as the price of BTC increases and companies roll out more efficient mining machines. Two separate analyses by digital asset manager Charles Edwards found that the price of Bitcoin on a macro scale is strongly influenced by mining trends.
- 63% of all BTC has not been moved in a year or more. The last time this metric was this high was at the start of the 2015-2017 bull run that brought Bitcoin to ,000.
- Google Trends indicates that an increasing number of individuals are searching for Bitcoin and related subjects.
All these charts resembling early 2017 patterns indicating #Bitcoin is beginning a multi-year bull run:
-Segwit adoption reaches new ATH
-HRreaches new ATH
-BTC not moved in 1+ yrs still at ATHs at over 63%
-Google trends buildingh/t @alistairmilne @CoinCornerDanny @Xentagz pic.twitter.com/5KRiZUmnKk
— Vortex (@theonevortex) August 17, 2020
Related Reading: Is BTC Really In a Bull Market? Here’s Why Analysts Think BTC Isn’t
Other Fundamentals Corroborate Expectations of Upside
Other fundamentals not mentioned by Vortex also suggest that Bitcoin is on the verge of moving higher.
Charles Edwards, the aforementioned digital asset manager and BTC analyst, recently compiled the list seen below of reasons why it’s hard to be bearish on Bitcoin right now.
These include, but is not limited to Dave Portnoy entering the BTC market, the Federal Reserve investigating a digital dollar, the price of gold establishing a support/resistance flip, Tether’s market cap increasing by 26%, an accumulation price structure, and an increase in investors “HODLing” their BTC.
How can you be bearish Bitcoin here?
– Portnoy in Bitcoin
– Fed investigating crypto dollar w MIT
– Gold S/R flip
– +26% Tether
– 45% supply hasn't moved in >2yrs
– Energy Value increasing > price
– Mining profitable & price near Production Cost
– Accumulation price structure— Charles Edwards (@caprioleio) August 13, 2020
Related Reading: Crypto Tidbits: Goldman Stablecoin, Dave Portnoy Wants BTC, DeFi Boom
Photo by Hari Nandakumar on Unsplash
Price tags: xbtusd, btcusd, btcusdt
Charts from TradingView.com
These 4 Trends Show Bitcoin Is on the Verge of a "Multi-Year Bull Run"
Ethereum Just Broke a Multi-Year Accumulation Range; $350 May Be Imminent
Ethereum incurred a strong impulse higher yesterday that allowed it to shatter through the upper boundary of its macro trading range between 0 and 0.
This allowed the cryptocurrency to completely alter its technical trajectory, as analysts are now noting that it could be poised to push significantly higher in the days and weeks ahead.
It is also important to note that the strength of this movement even created a tailwind that lifted Bitcoin higher, as the benchmark cryptocurrency closely followed ETH.
Analysts are now noting that this latest move also marked a break above a multi-year accumulation range that it has been trapped within.
This could be enough to catalyze a far-reaching uptrend in the weeks and months ahead, which could be fueled by further sell-side liquidations.
As for how high Ethereum might go, one fund manager is setting his sights on a movement up towards 0. He also notes that it may reach this level incredibly quickly.
Ethereum Rallies Towards 0 as Bulls Take Control
At the time of writing, Ethereum is trading up marginally at its current price of 4. The cryptocurrency ran as high as 0 yesterday afternoon before it met some significant resistance.
It once again retested this level just a few hours ago, but it did face a swift rejection here.
This indicates that 0 is the key resistance that buyers must surmount if they want to catalyze any further momentum in the days and weeks ahead.
Because ETH is closely correlated to Bitcoin, whether or not the benchmark cryptocurrency can surmount its resistance above ,500 could prove to be highly influential for Ethereum’s next movement.
While speaking about the significance of this latest upswing, one analyst explained that ETH has now broken above multiple key levels and just formed its first higher-high since the March decline.
“1 Year downtrend has been broken. A HH since the March Black swan confirmed. Leaving a 1 year accumulation range on ETH/BTC pair dating 378 days.”

Image Courtesy of Pentoshi. Chart via TradingView.
Fund Manager: ETH is Poised to See a Swift Rally to 0
As for how high these technical breakouts could lead the cryptocurrency, one fund manager is setting his sights on 0.
In a tweet, he points to the crypto’s break above its prolonged trading range, referencing a chart showing that previous trading range breakouts have led ETH to see some notable upside.
“Two months of sellers reeeeeevaluating their life choices now. 360 ETH will be fast,” he said in jest while offering the below chart.

Image Courtesy of Mohit Sorout. Chart via TradingView.
How Ethereum trends in the days ahead should provide insight into its mid-term outlook.
Featured image from Unplash.
Charts and pricing data via TradingView.
Ethereum Fees Just Hit a Multi-Year High, But There Are Solutions
The past few weeks have seen Ether stall in terms of price action, with the cryptocurrency trading between 0-240. Not the same can be said about Ethereum’s underlying blockchain activity.
Due to a perfect storm of events, the number of users of the network has skyrocketed.
Blockchain analytics firm Santiment reported last week that the number of new ETH addresses created a day surpassed 100,000:
“Ethereum’s network growth metric has rapidly been on the rise since the beginning of 2020, creating 237% more addresses yesterday than it did on Jan 1, 2020 (and ~+200% accounting for rolling averages now vs. then).”
A similar trend of growth has been seen in the daily count of transactions.
Below is a chart from Etherscan showing that the number of transactions on Ethereum is starting to near 2018’s all-time high. Late last week, there were over 1.1 million transactions in a single day; the all-time high is around 1.37 million transactions in a day.

Graph from Etherscan of the number of daily transactions
This spike in usage hasn’t come without a cost, unfortunately.
Ethereum Fees Recently Hit Multi-Year Highs
According to data shared by Tradeblock, the cost of transacting on Ethereum has hit highs not seen in over two years:
“With the rise in DeFi apps, majority of which are built on Ethereum, ether gas fees hit recent highs, meaning transaction costs across the network have risen in order for timely transactions to occur.”

Tradeblock’s data indicates that the cost of “gas” reached 120 Gwei, almost double the 70 Gwei highs of 2017/2018’s bull market. Cross-referencing TradeBlock’s data to that of Etherscan, it can be said that at 120 Gwei, fees were the highest since February 2016.
Anecdotal evidence has corroborated this trend.
As reported by NewsBTC, the Head of Business Development at Kraken’s futures division, Kevin Beardsley, wrote last week:
“I have spent on ETH gas fees to transfer/lock my into @CurveFinance and I’m earning a princely .079 in weekly $SNX rewards. I’ll break even in just 177 short weeks! (not including gas to close contracts.”
Beardsley is but one of many saying that it cost them in excess of to send a single transaction.
Solutions Coming to the Fore
It should come as no surprise that there are moves being made to mitigate Ethereum’s high transaction fees
There are currently attempts to raise Ethereum’s gas limit, thus allowing for more transactions. This, in turn, should decrease the fees one pays to transact on the network.
Another solution is Ethereum Improvement Proposal 1559, proposed by blockchain founder Vitalik Buterin and others. The proposal suggests that the current fee model is “inefficient and needlessly costly to users.”
The solution: “a mechanism that adjusts a base network fee based on network demand, creating better fee price efficiency and reducing the complexity of client software needed to avoid paying unnecessarily high fees.”
In the long run, there’s also Ethereum 2.0 — a sweeping upgrade intended to change how the blockchain works from a fundamental level. That upgrade is expected to dramatically increase the number of transactions possible.
Featured Image from Shutterstock
Price tags: ethusd, ethbtc
Ethereum Fees Just Hit a Multi-Year High — and Users Aren't Happy