 Fidelity Investments’ Director of Global Macro sees bitcoin as “exponential gold” and “an aspiring player on the store of value team.” According to his analysis, bitcoin’s price is “driven primarily by the growth in its network, which is in turn driven by bitcoin’s unique scarcity feature, as well as the monetary and fiscal policy cycle, […]
Bitcoin News
Crypto Expert Says Market Has Begun A Macro Bullish Expansion – What This Means For Bitcoin And Altcoin Prices
Crypto analyst TechDev has offered a bullish narrative for the crypto market. He recently hinted that a parabolic move is imminent for Bitcoin and altcoins, following his statement that the market has entered an important phase in this bull cycle.
Crypto Market Has Began “Macro Bullish Expansion”
TechDev mentioned in an X (formerly Twitter) post that “the entire crypto market has just begun its first macro bullish expansion in three and a half years.” The analyst shared a bi-monthly chart of the total crypto market cap, which showed that the market was currently at a similar stage to 2020, just before the 2021 bull market came into full force and crypto tokens began to enjoy a significant upward trend.
From the chart he shared, one could also deduce that Tech Dev was hinting that the crypto tokens had completely undergone a healthy consolidation phase and were well primed for this parabolic move to the upside. That is why the crypto analyst made reference to the ‘macro bullish expansion,’ with these coins ready to break out from the range at which they have been trading for some time now.
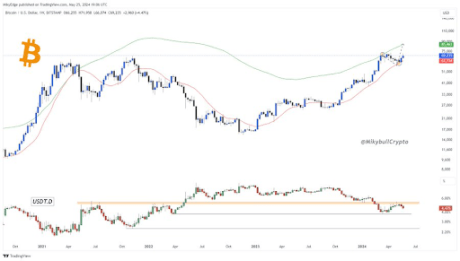
Crypto analyst Mikybull Crypto also seemed to agree with TechDev’s analysis. He shared a Bitcoin chart that showed that the flagship crypto was ready for its next leg up, which would send it to almost ,000.
Meanwhile, in an earlier X post, TechDev mentioned that Bitcoin and altcoins were “poised” to rip through the charts. He highlighted on the chart he shared that Bitcoin is about to have a God candle that would send it past its current all-time high (ATH) of ,000. Altcoins were also at a stage where they would significantly move to the upside.
TechDev had also previously suggested that Bitcoin was currently mirroring its price action from 2021, when the flagship crypto experienced a 1,200% price surge as it rose to ,000. This raised the possibility of Bitcoin enjoying such a parabolic move again, which could send its price to almost million.
Bitcoin Is Still Consolidating For Now
While TechDev suggested that a parabolic move for Bitcoin and altcoins is imminent, crypto analyst Rekt Capital has provided a different insight. He claimed that Bitcoin is showing signs that its recent rebound “has fed into the formation of another local top,” suggesting that this recent move wasn’t a continuation of the bull run just yet.
The crypto analyst added that history suggests that Bitcoin will likely continue to consolidate between ,000 and ,000 in the meantime. Crypto analyst Michaël van de Poppe also shared a similar sentiment as he noted that no breakout is happening yet for Bitcoin since the ,000 resistance level was rejected. He added that he will like to see Bitcoin hold above ,000 as that will confirm that “everything is fine.”
Macro Investor Dan Tapiero Predicts ‘Scary Bullish’ BTC Prospects; Foresees Crypto Asset Surpassing $90K
 Macro investor Dan Tapiero has described bitcoin’s prospects as extremely bullish. He predicts that if bitcoin breaks the ,000 mark, it could likely rise to ,000 and beyond. Although he acknowledges that the specific catalyst for bitcoin’s imminent breakout is unclear yet, Tapiero asserts that this detail is irrelevant at this stage. Tapiero Says Sideways […]
Bitcoin News
Goldman Sachs Raises Gold Price Forecast to $2,700, Acknowledges Rise Not Caused by Usual Macro Factors
 Goldman Sachs, a leading investment banking institution, has updated its gold price forecast due to the unforeseen strong performance of the metal in 2024. In a note directed to investors, the bank expects gold to reach ,700 per ounce by year’s end, pushed by non-traditional factors. Goldman Sachs Updates Gold Price Outlook to ,700 per […]
Bitcoin News
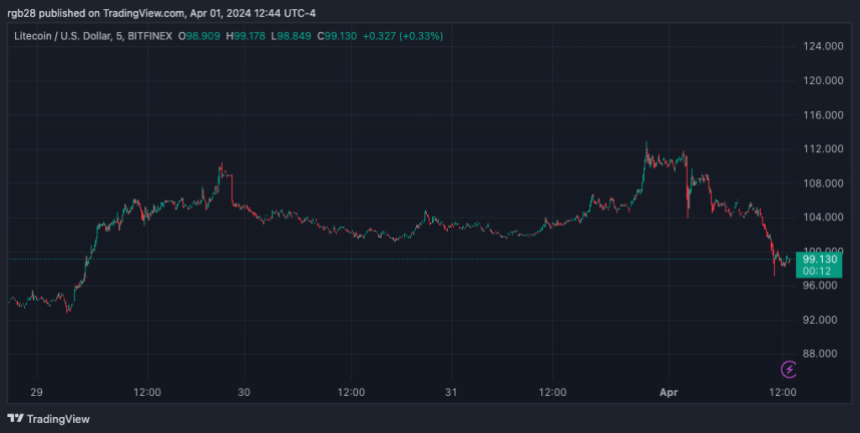
Litecoin Soars Above $110 As LTC Breaks Out Of Macro Downtrend: Analysts
Litecoin (LTC) has shown a notable performance in the first quarter of the year, reaching over 30 million transactions by March 30. Last year, this feat was achieved around July when LTC traded at around 3.
The US Commodity Futures Trading Commission (CFTC) recently classified Litecoin as a commodity alongside Bitcoin and Ethereum. The designation and rumors of a Litecoin exchange-traded fund (ETF) sparked bullish sentiment. Analysts and investors have forecasted a strong performance for the token.
Is Litecoin Out Of The Woods?
Litecoin surged 10% last week, seemingly fueled by the positive sentiment from its community. As a result, the token rose above 0 and tested its resistance above the 5 level.
Crypto analyst Rekt Capital confirmed that, as April 1st started, LTC officially broke the macro downtrend for the first time since April 2021.
Litecoin has Monthly Closed above the Downtrend
It is confirmed
The Macro Downtrend has been broken for the first time since April 2021
The Macro Downtrend is now officially over#LTC #Crypto #Litecoin https://t.co/yU7Gz7X1ck pic.twitter.com/ktgOYKTarz
— Rekt Capital (@rektcapital) April 1, 2024
According to the analyst, after successfully retesting its multi-year macro downtrend and turning it into a new support level, the token had to stay above the price range to confirm the end of the trend.
LTC closed the month above these levels. The token’s price soared past 0 for the second time this year. Nonetheless, the price didn’t hold for long, as it immediately faced a correction and dropped back to the 5-106 range.
After the correction, analyst The Cryptonomist suggested in an X post that if LTC’s price gets a “clean break” above this level, investors could “comfortably see” the price surge to 0.
Moreover, crypto investor Crypto Surf pointed out that Litecoin “managed to close at or slightly above the 200-week,” considering it a “not bad” performance. In the charts, Crypto Surf highlights key points from the token’s performance from 2017-2021 and 2021-2024.
$LTC did actually manage to close at or slightly above the 200 week MA
Let's see what these new quarter, month and week bring us
For now, we're above the meme lines, so not bad. https://t.co/xqTDWet7tv pic.twitter.com/GT3asJBQF2
— Surf (@_CryptoSurf) April 1, 2024


The 6 pre-halving top of Litecoin’s second halving event was surpassed approximately three months after breaking out of its 200-week moving average (MA). This breakout was followed by LTC’s all-time high (ATH) of 0 in 2021.
After Litecoin’s third halving event, LTC’s pre-halving top reached the 5 price range. This top was tested and almost matched today when the token traded at 2.
The charts suggest that, if history repeats itself, LTC’s price could be testing higher resistance levels and a new ATH in the coming months. However, market dynamics and external events could hinder the token’s potential targets.
Was LTC’s Rise To 2 An April’s Fool Day Prank?
After briefly reaching its highest price of the year, LTC faced a correction that shredded the gains registered over the weekend.
The token closed its March monthly candle above important metrics and has resisted above 0 during the past three days. Despite this, the price dipped below that important support zone. LTC has hovered around the -99 price range for the past hour.
This drop represents a 3.8% decrease from LTC’s price 24 hours ago and a 76.4% dip from its ATH. However, Litecoin’s LTC continues to register green numbers over longer timeframes.
LTC has increased 8.8% and 8.9% in the weekly and monthly timeframes. More notably, the token had a 19.9% biweekly surge.
Similarly, its daily trading volume has significantly surged by 186.5%, reaching .61 billion in the past 24 hours. LTC ranks as the 19th largest cryptocurrency by market capitalization, according to CoinMarketCap data. At the time of writing, Litecoin is trading at .13.
Bitcoin Technical Analysis: A Collision of Signals and Macro Decisions Ahead of Fed Ruling

Over the past 60 minutes, bitcoin’s trading value has fluctuated between ,525 and ,715, demonstrating a dynamic price range. Its 24-hour price swing extends from a low of ,340 to a high of ,853. Currently, bitcoin boasts a market capitalization of 4 billion, coupled with a relatively modest 24-hour trading volume of .33 billion. In the last 24 hours, the leading digital currency has seen a 2.4% dip, somewhat mitigated by a 5.9% rise over the week, underscoring the unpredictable nature of current market sentiment.
Bitcoin
As of Wednesday, the market mood remains predominantly pessimistic, swayed significantly by actions from entities such as the Grayscale Bitcoin Trust (GBTC). Nevertheless, several analysts perceive these present price levels as opportune moments for investment, with expectations of an imminent market rebound. Historically, bitcoin’s ability to swiftly bounce back from 20-30% drops is often regarded as an opportune moment for savvy investment decisions.
Today’s Federal Open Market Committee (FOMC) meeting, where the Federal Reserve’s decision is highly anticipated, stands as a pivotal event that could markedly sway BTC’s market this week. Moreover, the expected rise in Bitcoin’s mining difficulty next week and the forthcoming block subsidy halving in April are poised to play influential roles in shaping the economic landscape of crypto this year.
A detailed examination of bitcoin’s oscillators on Wednesday shows a neutral to slightly bearish trend. The relative strength index presently sits at 52, Stochastic at 85, and the commodity channel index is at 60. Meanwhile, the momentum indicator points to negative sentiment at 992, contrasting with the moving average convergence/divergence (MACD) level, which highlights bullish signals at -181. These conflicting indicators suggest a market teetering on equilibrium, with potential shifts looming.
The current moving averages (MAs) offer a more optimistic perspective. The market is still radiating positive vibes as indicated by the short-term exponential moving averages (EMAs) and simple moving averages (SMAs) for 10 and 20 days. However, there’s a noticeable split in the 30 and 50-day SMAs, revealing bearish trends, while their EMA equivalents continue to reflect bullish sentiments. This discrepancy underscores the prevailing uncertainty in the market.
Upon analyzing the 1-hour, 4-hour, and daily charts, a recent upward trend is evident, originating from roughly ,879 on Jan. 22, and reaching a peak near ,853 on Jan. 30. Yet, this upward momentum appears to be reversing, as indicated by a rise in bearish volumes. The 1-hour chart offers a detailed snapshot of this volatility, whereas the 1-day chart reveals a more extended downtrend from the 2024 high of ,048, recorded on the day the spot bitcoin exchange-traded funds (ETFs) were approved.
Bull Verdict:
Given the current market dynamics and technical indicators, there’s still a bullish case for bitcoin. The bullish signals from short-term moving averages, combined with bitcoin’s historical resilience and potential for recovery, support a positive outlook. Anticipation of favorable outcomes from key events, like the Federal Reserve decision and the impact of mining adjustments, could further bolster bullish sentiments.
Bear Verdict:
Conversely, the bearish perspective is grounded in the market’s recent volatility, negative market sentiment, and mixed signals from oscillators. The divergence in longer-term moving averages and the presence of bearish candlestick patterns on the charts signal a potential downturn. Additionally, external market pressures and uncertainties surrounding upcoming events could exacerbate bearish trends.
Register your email here to get weekly price analysis updates sent to your inbox:
What do you think about bitcoin’s market action on Wednesday? Share your thoughts and opinions about this subject in the comments section below.
Expert Reveals Key Macro Indicators For Bitcoin: A Roadmap To Next Rally?
Bitcoin advocate and CEO of Jan3, Samson Mow, has pinpointed a range of macroeconomic indicators that could signal an impending rally for Bitcoin. Mow focuses on exchange-traded inflows (ETF), Bitcoin’s Hashrate, and whale activity on prominent exchanges like Bitfinex.
The Jan3 CEO also mentioned the 200-week moving average (WMA) in forecasting Bitcoin’s trajectory. The recent data shared by Cypherpunk on X highlighting significant whale accumulation on Bitfinex further supports Mow’s Bitfinex whale indicator, suggesting an increased interest from large-scale investors in the flagship crypto.
This is some great alpha from @Excellion. You can see for yourself that the whales on #Bitfinex are accumulating #Bitcoin. Decide what you want to do with that information.
https://t.co/IHjrqUvrDn pic.twitter.com/FS518AIYoz
— CYPHERPUNK (@cypherpunkstore) January 29, 2024
Broader Economic Indicators
Mow also looks beyond the crypto-specific data, considering global economic factors like Tether’s USDT Assets Under Management, government debt payments, and Debt-to-GDP ratios. The Bitcoin advocate believes these factors, along with nation-state adoption of Bitcoin, real inflation rates, and M3 money supply, could profoundly impact Bitcoin’s performance.
These are the #Bitcoin macro indicators I’m looking at:
ETF inflows
— Samson Mow (@Excellion) January 28, 2024
Notably, Samson Mow has remained steadfast in his ambitious prediction for BTC, maintaining a million price target for the crypto. Mow recently cautioned about the potential ‘max pain‘ accompanying a rapid ascent of Bitcoin to this monumental valuation.
Furthermore, Mow has recently suggested that this significant price milestone could materialize relatively quickly, possibly within days or weeks. However, according to the Jan3 CEO, the starting point for this potential surge is “TBD” (to be disclosed).
My main prediction is the run up to M happens in days to weeks. Starting point TBD.
— Samson Mow (@Excellion) January 14, 2024
Bitcoin Latest Trajectory And Prediction
Despite a recent dip below ,000 last week, BTC has shown a slight increase, with an uptick bringing its price above ,000. This recovery, though slight, aligns with the optimistic predictions of various analysts and experts, including Samson Mow.
SkyBridge Capital’s founder, Anthony Scaramucci, has also joined the chorus with an optimistic prediction for Bitcoin. Scaramucci’s analysis suggests a potential 300% increase in Bitcoin’s value post-halving, with a long-term price target of 0,000.
His estimates, based on historical data and market trends, indicate that the peak bullish period for BTC could be about 18 months after the halving event. These predictions are further supported by the recent developments in Bitcoin ETFs, including the filing of the first-ever Bitcoin spot ETF in Hong Kong, indicating a growing institutional interest in BTC.
Featured image from Unsplash, Chart from TradingView
Bitcoin Cycle Analysis And Macro Factors Reveal When Price Will Reach $125,000
Crypto financial services firm Matrixport has reaffirmed its bullish projection on the future trajectory of the Bitcoin price. While at it, the firm also mentioned when this is likely to happen based on past cycles and historical performance.
When Bitcoin Will Hit 5,000
In a report that dwelled on the sustainability of the bull market in 2024, Matrixport mentioned that Bitcoin will hit 5,000 by the end of 2024. Before then, they project that Bitcoin will hit ,140 by April 2024. April 2024 is scheduled to be when the Bitcoin Halving will take place and this event is expected by many to kickstart the bull market.
The basis for their 5,000 projection stems from the fact that the years in which Bitcoin Halving took place are generally bullish. Historically, Bitcoin saw a 186%, %126, and 297% gain in 2012, 2016, and 2020 respectively. As such, they expect that something similar will happen in 2024.
Another point that they used to back up their projection is the fact that miners tend to hoard their Bitcoin rewards before each halving. There is usually a significant price increase after the event (about 200%). Therefore, they expect that this time won’t be different, with Bitcoin able to hit the 5,000 price level if that happens.
Meanwhile, the macro factors seem to be aligning for this parabolic rally in 2024. Based on Matrixport’s inflation model, there could be a decline in inflation, which could lead to a cool-off in the hike of interest rates. If that happens, it would undoubtedly be bullish for Bitcoin, considering that the Fed’s hawkish stance has been known to affect Bitcoin’s price.
The Bull Market Already Began
Contrary to public opinion, Matrixport believes that the bull market already began this year. They noted that, just as in past cycles, the bull market has always lasted for three years after every bear market. Based on this “simple cycle analysis,” they project that this bull market will also last for three years. Going by this assumption, the bull market will run until 2025.
The financial services firm had previously shared a report on how the fifth bull market will unfold. This cycle, which they assert began on June 22, 2023, has been said to be likely driven by expectations of institutional adoption. This is likely a reference to the Spot Bitcoin ETFs that could potentially launch soon.
Their projections so far seem to be on track. As part of how this bull market will unfold, they had affirmed that Bitcoin will hit ,000 between November this year and April 2024. That could happen sooner than later, as the flagship cryptocurrency recently broke above ,000.
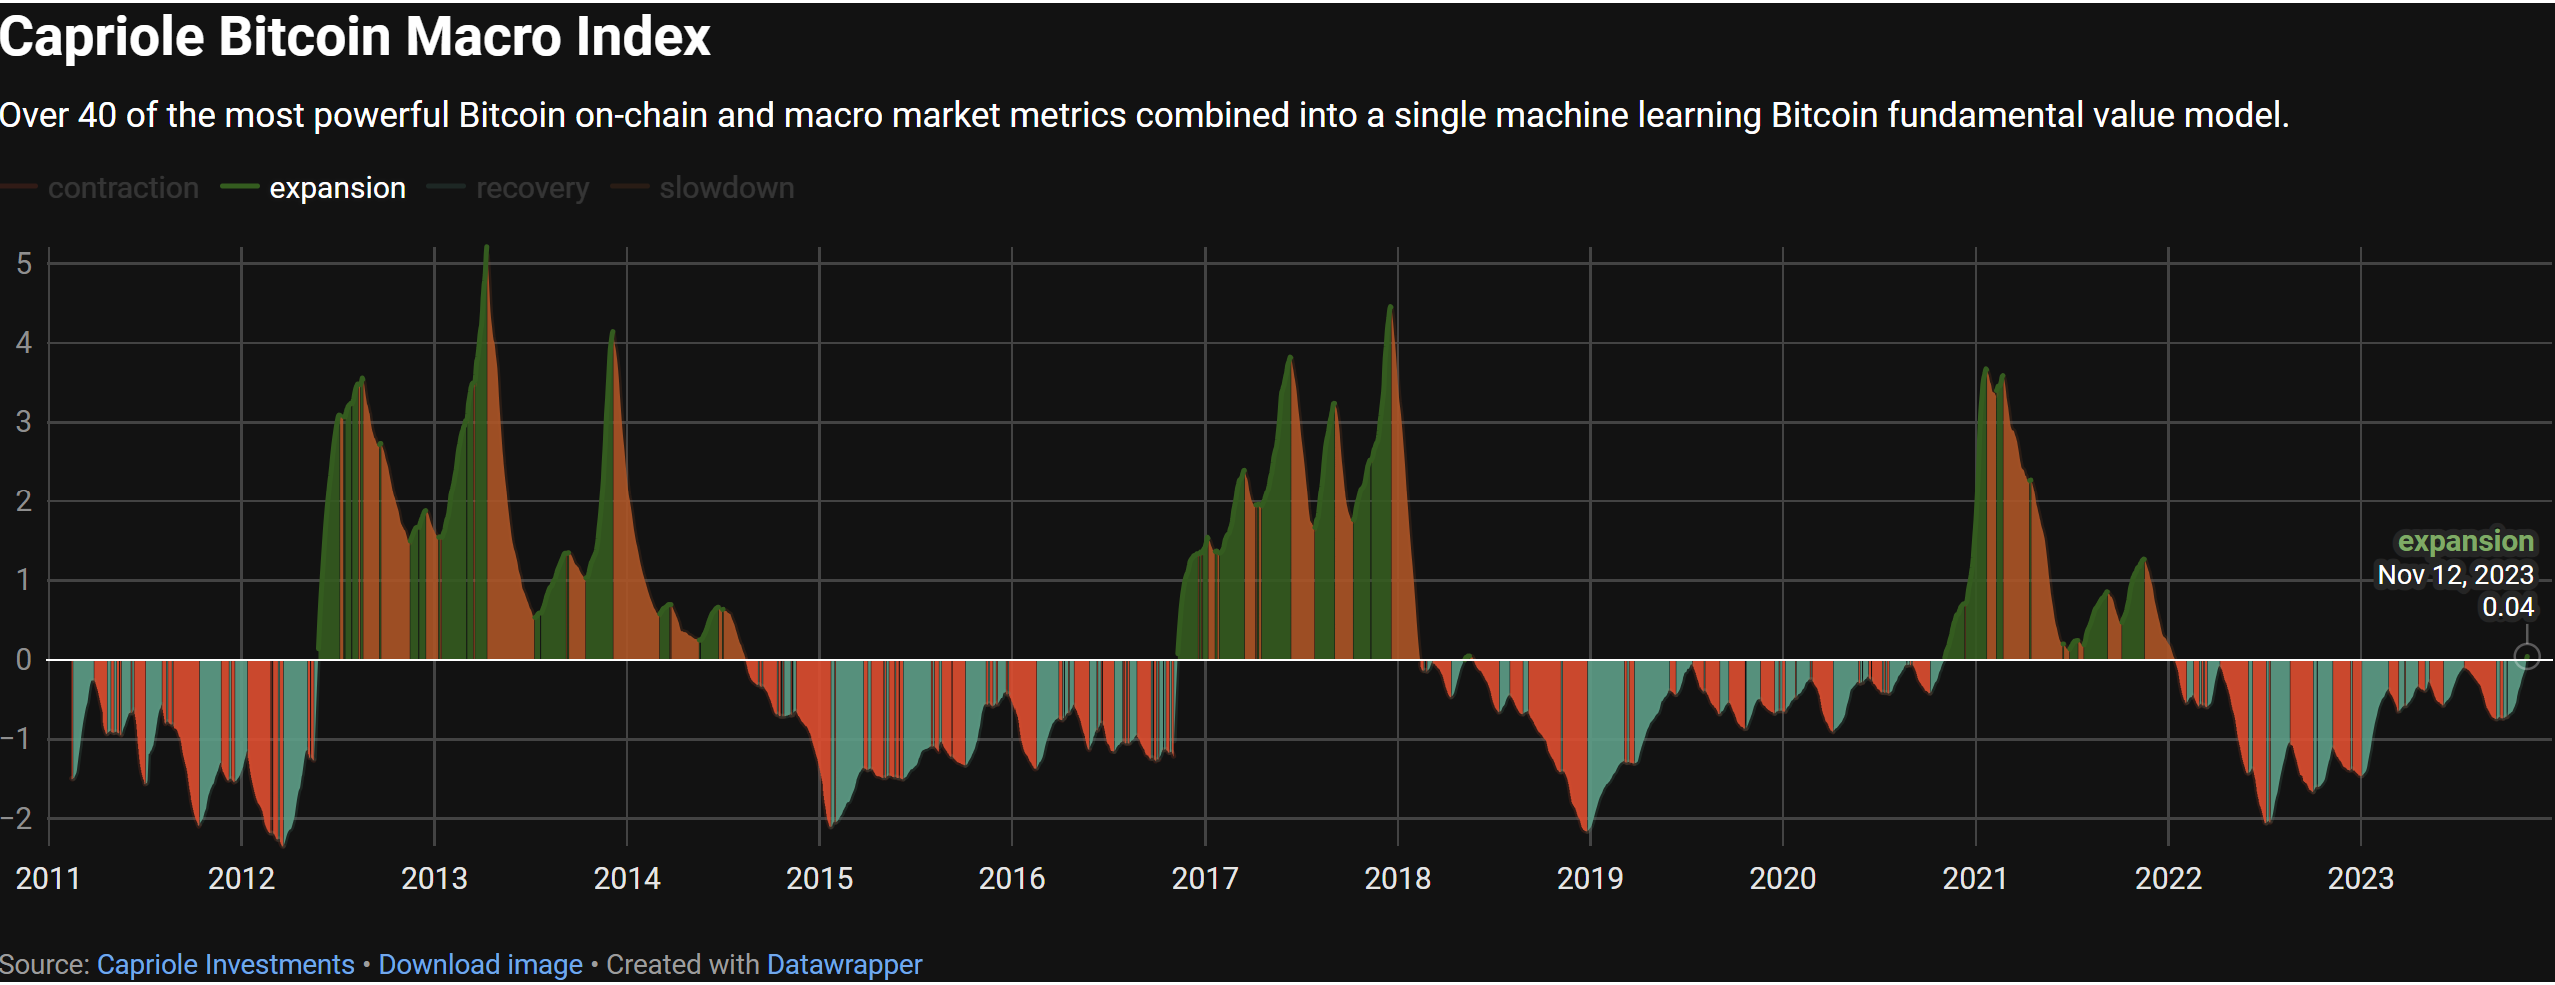
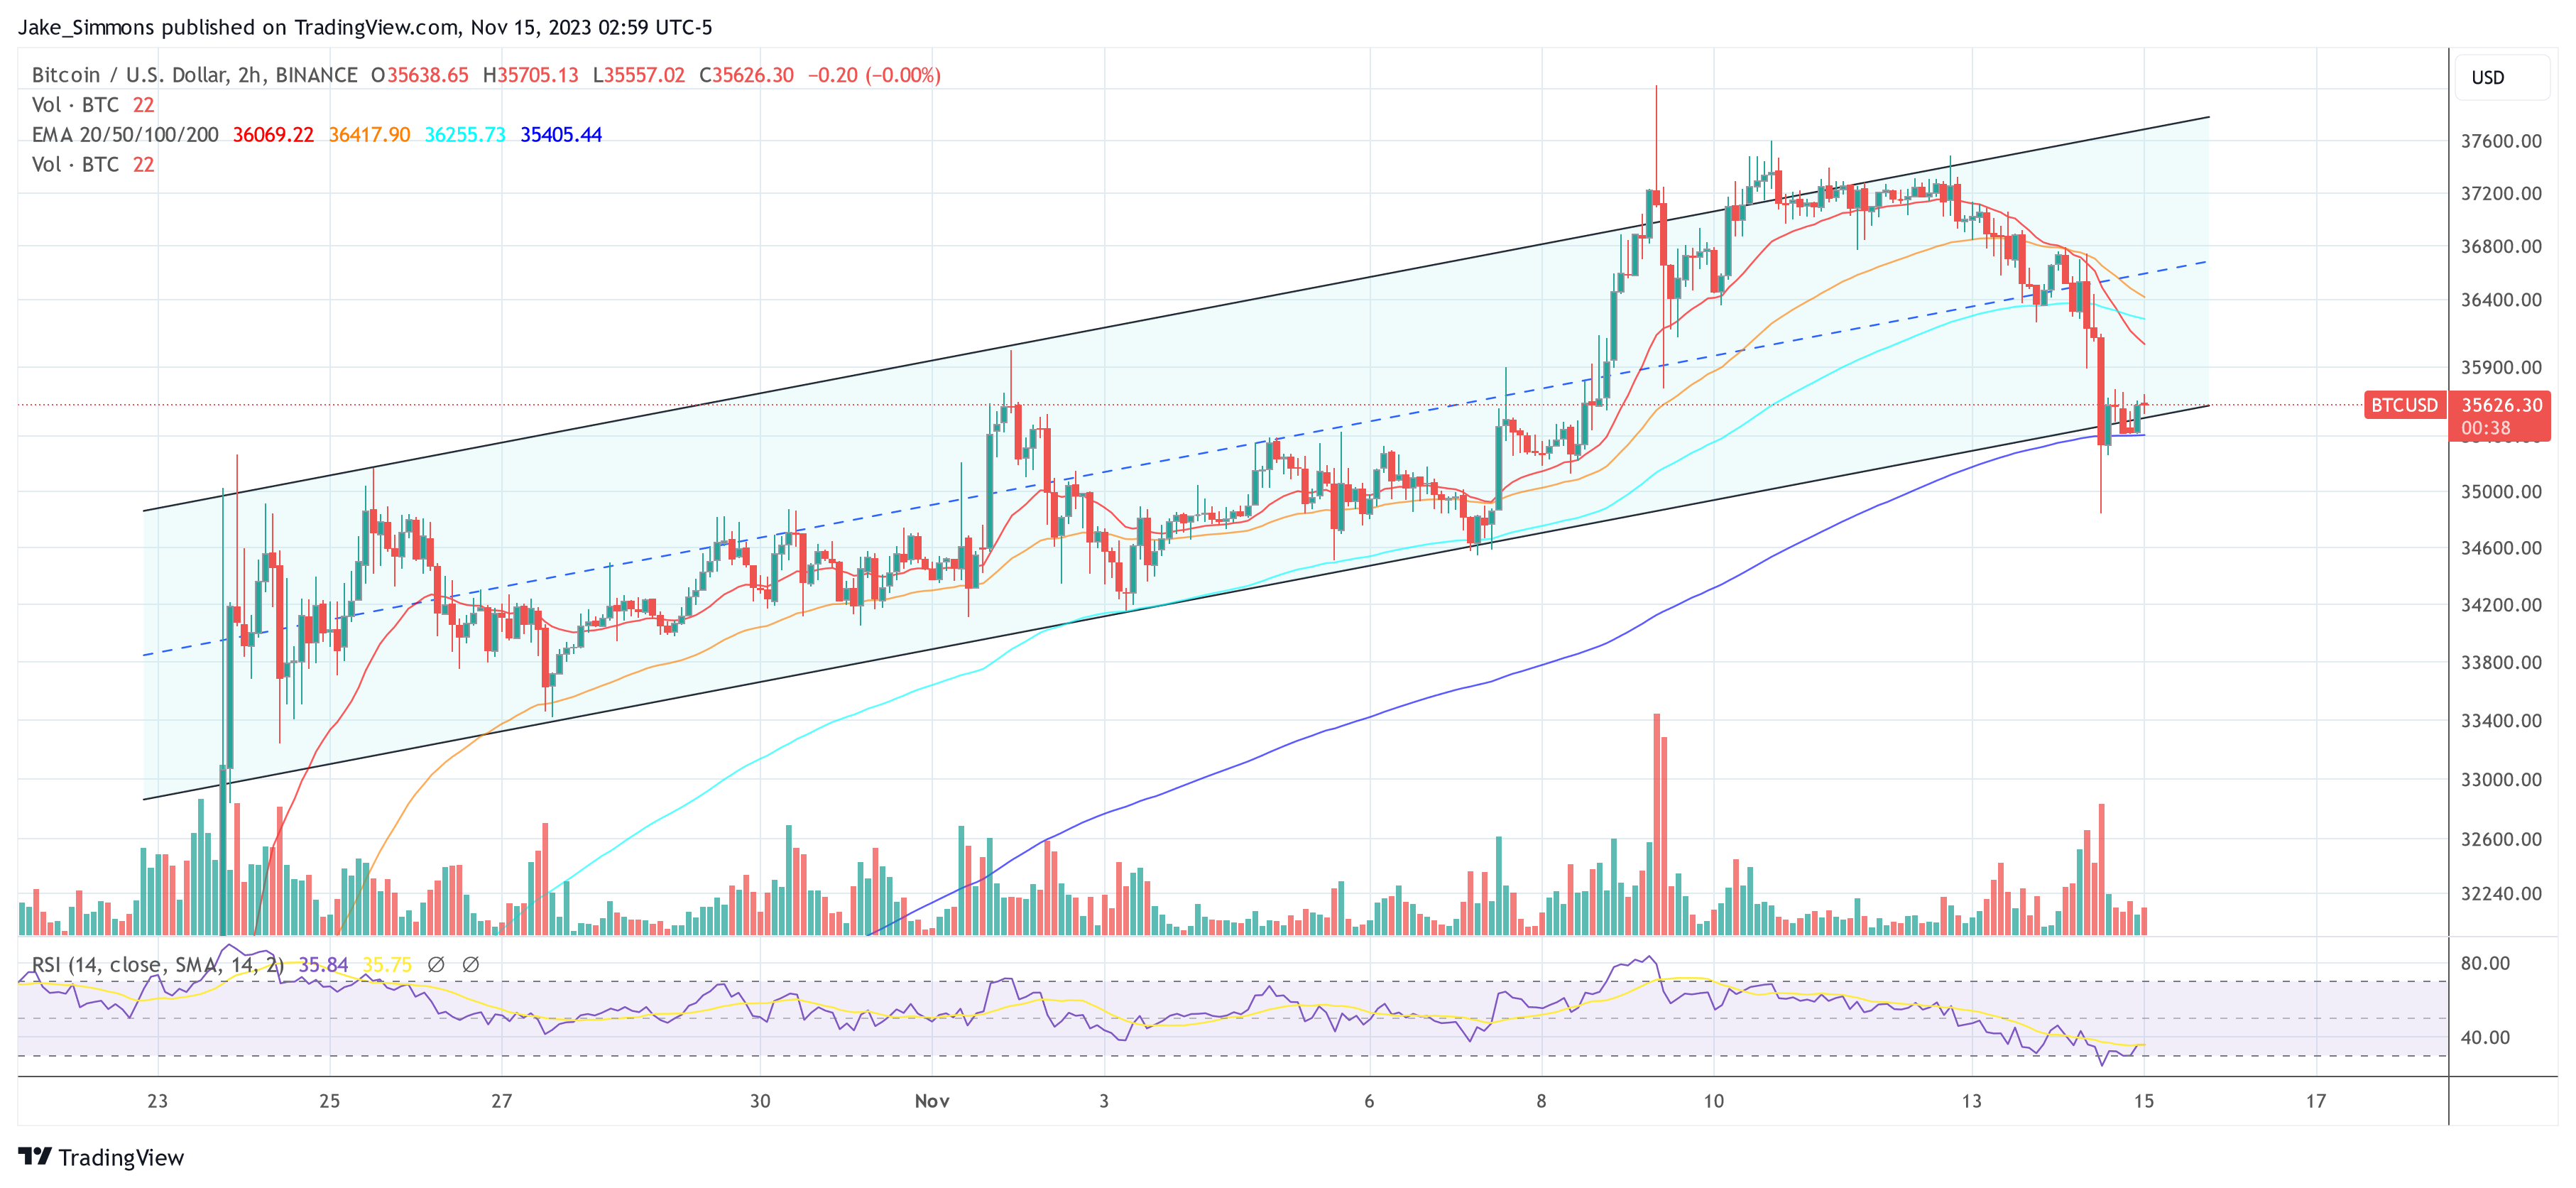
Bitcoin Macro Index Enters ‘Expansion’, Echoing 400% Bull Run Surge
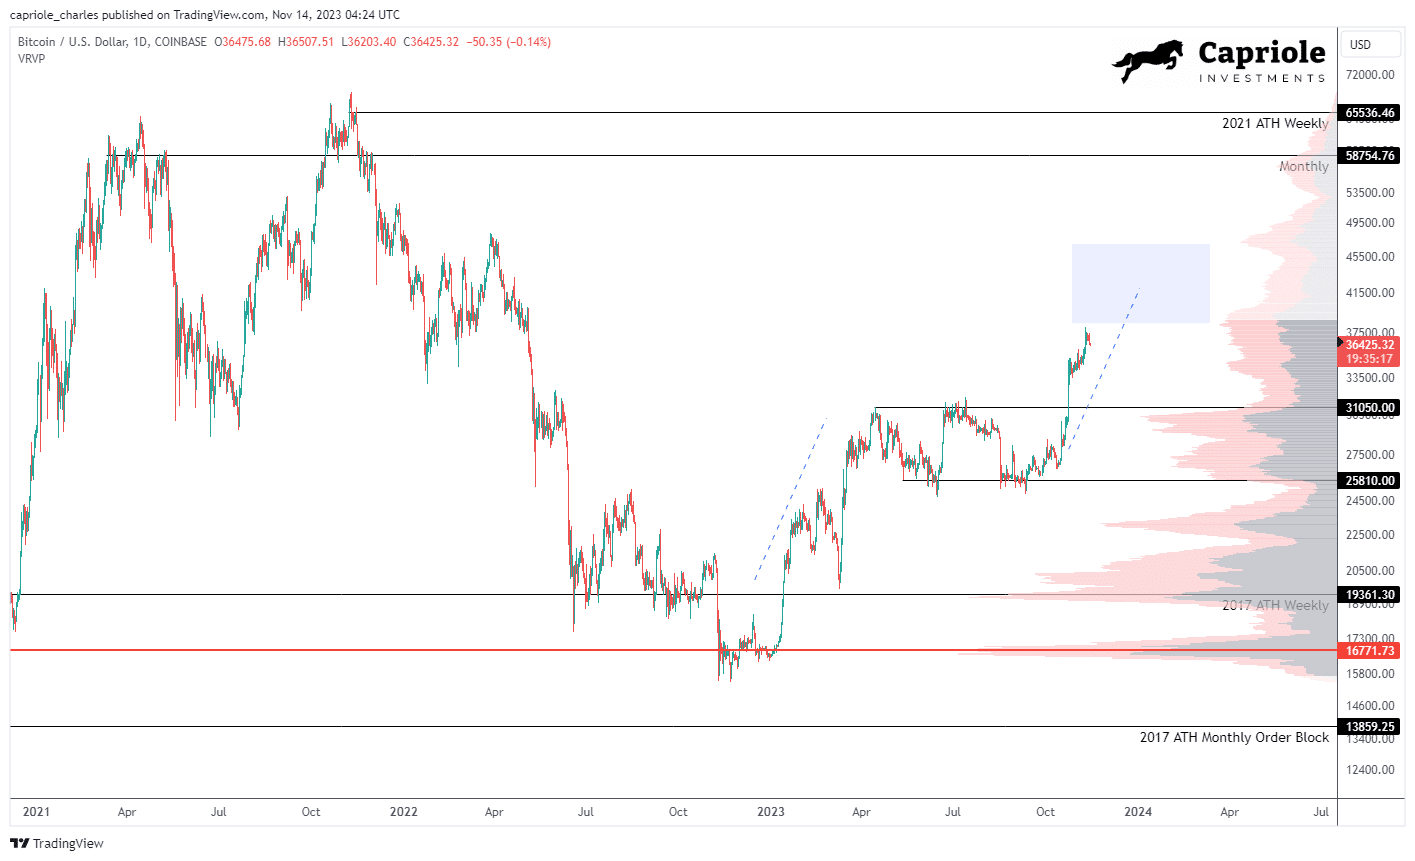
In a detailed market update, Charles Edwards, founder of Capriole Investment, has provided an in-depth analysis of Bitcoin’s current market position, highlighting a pivotal shift to an ‘expansion’ phase in the Bitcoin Macro Index. This transition is particularly noteworthy as it parallels conditions observed prior to historical price surges in Bitcoin’s valuation.
Bitcoin has recently experienced a sharp uptick, ascending from ,000 to an interim high of ,000. After a brief period of resistance, the price corrected to approximately ,500. Edwards highlights this movement as a critical technical victory, with Bitcoin overcoming and holding above the major resistance benchmarks of ,000 on both the weekly and monthly timeframes.
This consolidation above key resistance levels sets a bullish context in the high timeframe technical analysis, positioning Bitcoin in a strong technical stance according to traditional market indicators. “The recent breakout into the 2021 range offers the best high timeframe technical setup we have seen in years. Provided K holds on a weekly and monthly basis in November, the next significant resistance is range high (-65K).”
Bitcoin Macro Index Enters Expansion
The crux of Edwards’ update is the shift in the Bitcoin Macro Index, a complex model synthesizing over 40 metrics encompassing Bitcoin’s on-chain data, macro market indicators, and equity market influences. The index does not take price as an input, thus providing a ‘pure fundamentals’ perspective.
The current expansion is the first since November 2020, and only the third instance since the index’s inception, with the two previous occasions leading to substantial price rallies in the following periods. Edwards elucidates this with a direct quote: “The transition from recovery to expansion is simply the optimal time to allocate to Bitcoin from a risk-reward opportunity for this model.”
A look at the Bitcoin chart reveals that the Bitcoin price rose by a whopping 400% during the last bull run from early November 2020 to November 2021, after the Macro Index entered the expansion phase. The first historical signal was provided by the Macro Index on November 9, 2016, which was followed by a massive bull run of almost 2,600% until Bitcoin reached its then all-time high of ,000 in February 2018.
Short-Term Technicals And Derivatives Market Analysis
In the short term, the technical outlook presents a mixed picture, according to Edwards. The derivative markets are indicating an overheated state, with low timeframe analysis suggesting a retracement could be imminent. Edwards introduces the ‘Bitcoin Heater’ metric, recently launched on Capriole Charts, which aggregate various derivatives market data and quantify the level of market risk based on the open interest and heating level of perpetuals, futures, and options markets.
The below chart shows that most of the time when the Bitcoin Heater is above 0.8, the market corrects or consolidates. “But there are large exceptions to the rule: such as the primary bull market rally from November 2020 through to Q1 2021. […] We should expect this metric to be high more frequently in 2024 (much like Q4 2020 – 2021),” Edwards stated.
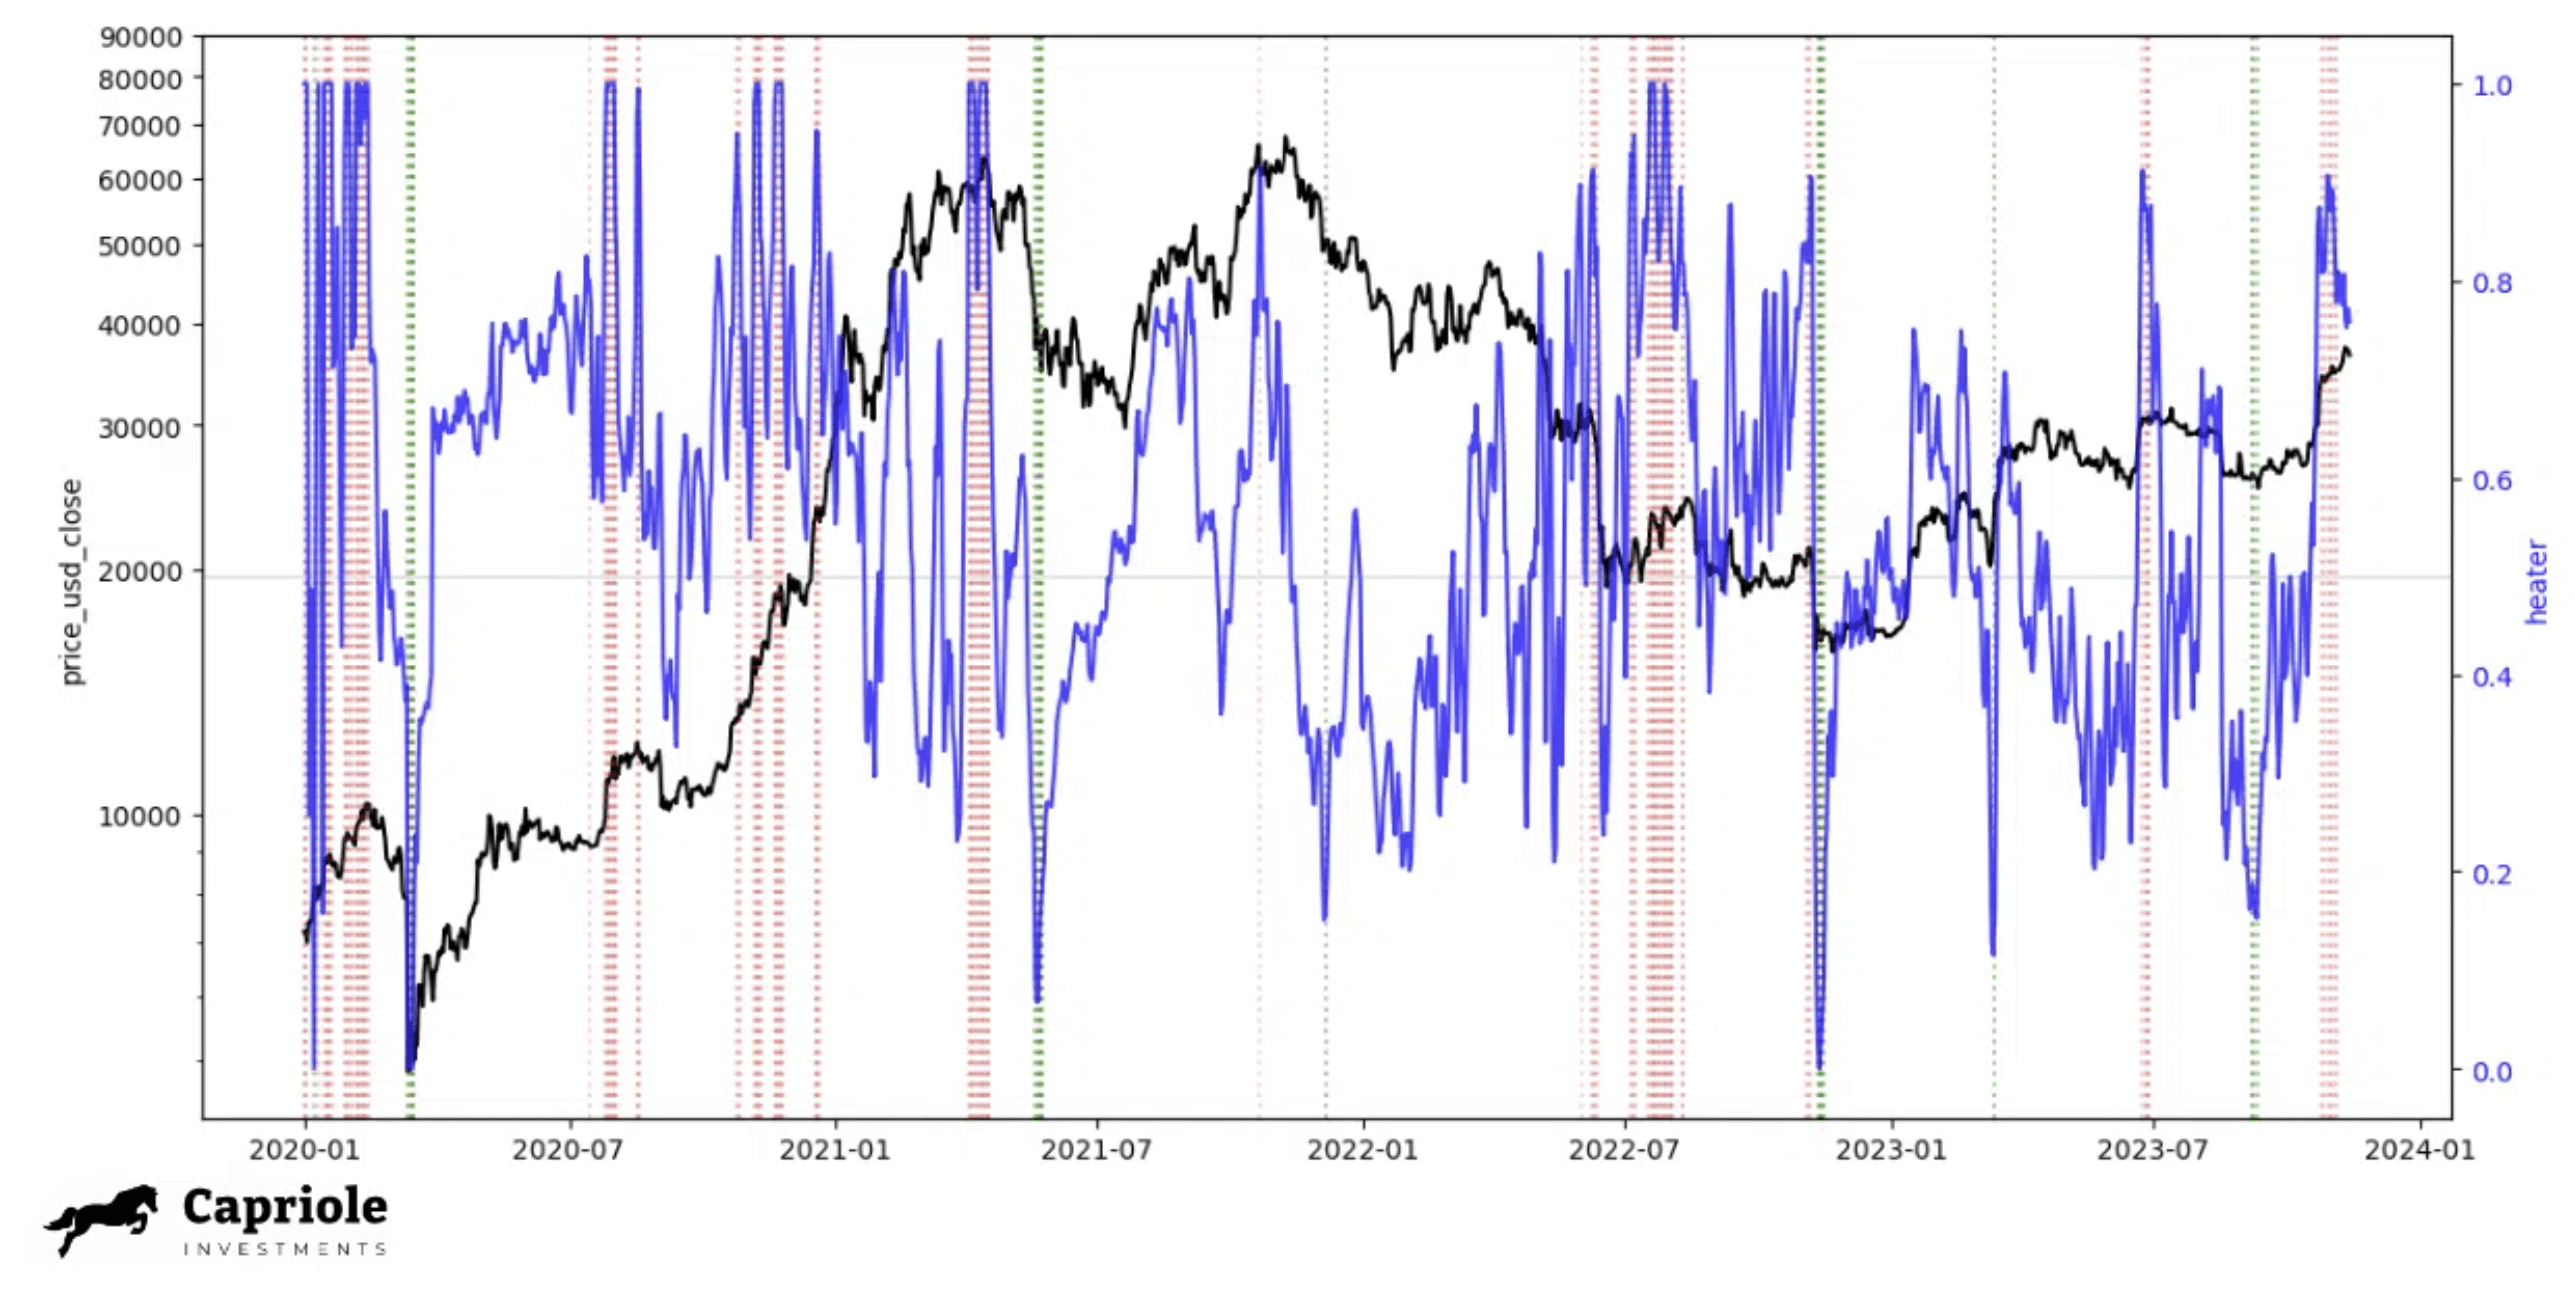
The analyst concluded that the overall trend for Bitcoin remains positive, with major data points indicating a strong bullish scenario. However, he also cautioned about potential short-term risks in the low timeframe technicals and derivatives market. These, according to him, are common in the development of a bull run and could offer valuable opportunities if dips occur.
At press time, BTC traded at ,626.
Bitcoin And Gold Poised For Growth Amidst US Fiscal Troubles, Top Macro Investor Says
Bitcoin (BTC) and gold, two seemingly divergent assets, find common ground in the eyes of veteran macro investor Luke Gromen. In a recent interview, Gromen posits that these assets could flourish as the fiscal challenges in the United States continue to mount.
Gromen’s argument hinges on the idea that both gold and Bitcoin are “duration assets” with fixed supplies and the potential for their face values to rise. In times of fiscal distress, these assets tend to shine.
As the US grapples with fiscal issues exacerbated by relentless quantitative easing and potential shifts in Federal Reserve policies, Gromen believes that this environment will create a fertile ground for gold, oil, and Bitcoin.
“[Gold and BTC will do well] because they are simply duration assets with a more fixed supply and a face value that can rise,” he stated.
“They do well when a nation has a fiscal problem, and when the reserve currency issue of the world and her allies all have fiscal problems, and hers is at least as bad or probably worse than the others – even Europe – then it’s really good for gold and Bitcoin.”
BRICS And The Dollar’s Reshaping
Gromen also delved into the potential ramifications of the BRICS nations (Brazil, Russia, India, China, and South Africa) launching a gold-backed currency. Such a move could undermine the US dollar’s longstanding position as the world’s reserve currency. The prospect of a gold-backed currency gaining traction among these major economies could weaken the dollar’s dominance in international trade and finance.
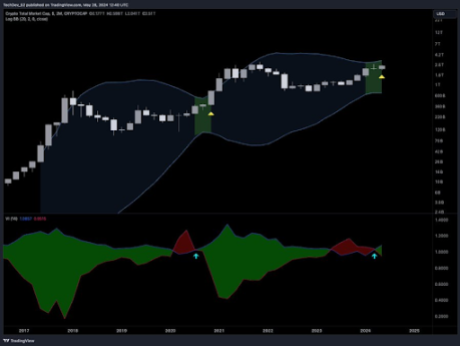
Meanwhile, the cryptocurrency sector is experiencing a bullish surge, with Bitcoin leading the charge. It has surpassed the critical psychological threshold of ,000, sparking optimism among investors. Notably, Cryptoinsightuk, a pseudonymous crypto trading analyst, has conducted a revealing analysis of Bitcoin’s relative strength index (RSI) indicator.
Bitcoin’s Bullish Momentum
Cryptoinsightuk’s analysis tracks the instances when Bitcoin’s weekly RSI crossed above the 50 mark (green) and then dropped below this level (red). The expert found that, on average, these events led to a remarkable 1,100% price increase for Bitcoin. Such a surge could become a reality in the right circumstances, including a supply squeeze and the introduction of a spot Bitcoin exchange-traded fund (ETF).
As Bitcoin’s price currently hovers around ,539 with a 1.2% decline over the past 24 hours but a 4.9% gain over the last seven days, investors are closely monitoring these developments, eagerly awaiting signs of whether Bitcoin’s bullish momentum will persist in the coming weeks and months.
(This site’s content should not be construed as investment advice. Investing involves risk. When you invest, your capital is subject to risk).
Featured image from iStock