 The Central Bank of Nigeria warned local financial institutions against rejecting older or lower-denomination U.S. dollar banknotes. The apex bank said it will take strong action against financial institutions that refuse to accept mutilated or overcirculated local currency banknotes. Older U.S. Dollar Banknotes Still Legal Tender The Central Bank of Nigeria (CBN) has informed registered […]
Bitcoin News
Bitcoin Takes A Beating: Another $630 Million Exits, Price Drops Lower
The once-sizzling crypto market continues to sputter, with Bitcoin, the undisputed king of the digital realm, leading the retreat.
After a euphoric climb that saw it breach the ,000 level earlier this year, Bitcoin has shed its royal cloak, plummeting to new lows and dragging the entire crypto ecosystem into a period of frosty uncertainty.
Exodus From The Empire: Investors Pull Billions
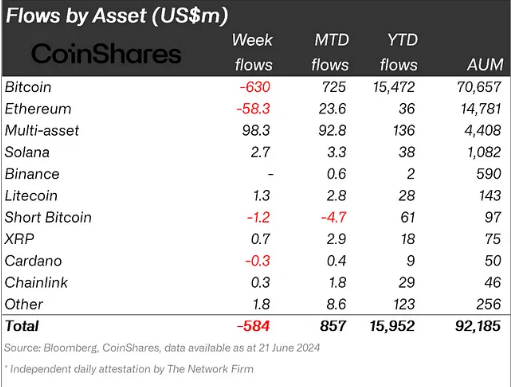
The past weeks have been marked by a mass exodus from Bitcoin. Investors, spooked by the prolonged price slump, have been fleeing the flagship cryptocurrency in droves. A recent report by CoinShares paints a bleak picture, revealing a staggering 0 million outflow from Bitcoin just last week.
This follows a similarly hefty outflow of 1 million the week prior, marking a brutal two-week stretch for Bitcoin. The hemorrhaging extends beyond Bitcoin, with other prominent cryptocurrencies like Ethereum experiencing their own investor flight.
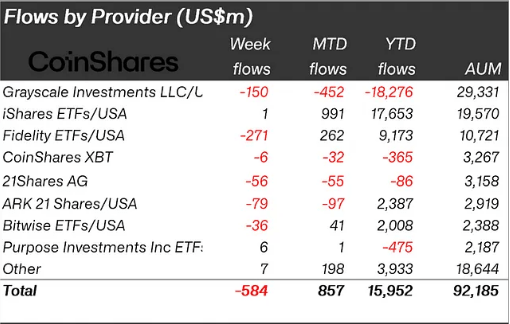
The sell-off isn’t confined to individual holdings. Bitcoin exchange-traded funds (ETFs), which allow traditional investors to dabble in crypto without directly owning it, have also been hit hard.
Major issuers like Fidelity and Grayscale have witnessed a six-day consecutive outflow, with hundreds of millions of dollars vanishing from their coffers. This mass exodus from both Bitcoin and Bitcoin ETFs paints a clear picture: investors are losing faith, seeking shelter from the crypto storm.
A Chink In The Armor? Not Quite
While the overall sentiment is undeniably bearish, there are a few glimmers of hope amidst the gloom. Short positions, which essentially bet on a price decrease, have seen a surprising decline of .2 million.
This could be interpreted as a decrease in bearish bets, hinting at a potential shift in investor sentiment. Additionally, some altcoins like Solana, Litecoin, and Polygon have defied the downward trend, registering healthy gains. This suggests that not all bets are off the table, and some investors might be seeking opportunities in other corners of the crypto market.
A Crypto Winter Thaw Or Avalanche?
The crypto market is no stranger to dramatic fluctuations. Bitcoin itself has a history of epic boom-and-bust cycles. However, the current downturn raises concerns about a prolonged “crypto winter” – a period of sustained decline.
Meanwhile, the much-anticipated approval of an Ethereum ETF, initially viewed as a potential market catalyst, seems to be doing little to dispel the current chill.
Will investors regain their appetite for digital assets, leading to a Bitcoin-fueled thaw? Or will the current outflow snowball into a full-blown avalanche, burying the crypto market under a blanket of red? The unfolding of this crypto winter remains to be seen.
Featured image from Silktide, chart from TradingView
Bitcoin Price Decline Continues: Lower Targets in Sight
Bitcoin price started another decline from the ,850 resistance zone. BTC is again moving lower and might even decline below the ,500 support zone.
- Bitcoin failed to climb above ,000 and started another decline.
- The price is trading below ,800 and the 100 hourly Simple moving average.
- There was a break below a connecting bullish trend line with support at ,500 on the hourly chart of the BTC/USD pair (data feed from Kraken).
- The pair could continue to move down and even trade below the ,500 support zone.
Bitcoin Price Resumes Decline
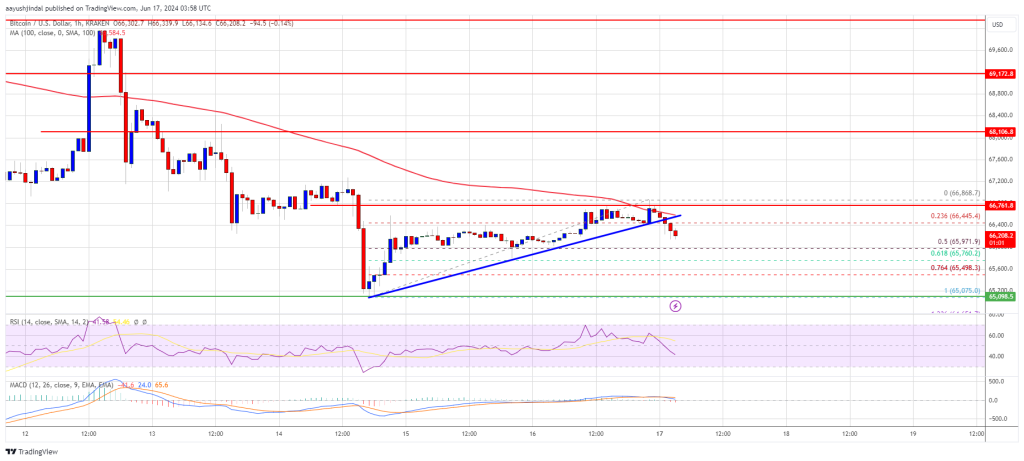
Bitcoin price struggled to climb above the ,000 resistance zone. BTC remained in a bearish zone and started a fresh decline from the ,868 high. There was a move below the ,500 level.
Besides, there was a break below a connecting bullish trend line with support at ,500 on the hourly chart of the BTC/USD pair. The pair traded below the 23.6% Fib retracement level of the upward move from the ,075 swing low to the ,868 high.
Bitcoin is now trading below ,800 and the 100 hourly Simple moving average. It seems like the price might soon test the 50% Fib retracement level of the upward move from the ,075 swing low to the ,868 high.
On the upside, the price is facing resistance near the ,500 level and the 100 hourly Simple moving average. The first major resistance could be ,850. The next key resistance could be ,000. A clear move above the ,000 resistance might start a decent increase and send the price higher.
In the stated case, the price could rise and test the ,000 resistance. Any more gains might send BTC toward the ,500 resistance in the near term.
More Losses In BTC?
If Bitcoin fails to climb above the ,500 resistance zone, it could continue to move down. Immediate support on the downside is near the ,000 level.
The first major support is ,750. The next support is now forming near ,500. Any more losses might send the price toward the ,000 support zone in the near term.
Technical indicators:
Hourly MACD – The MACD is now gaining pace in the bearish zone.
Hourly RSI (Relative Strength Index) – The RSI for BTC/USD is now below the 50 level.
Major Support Levels – ,500, followed by ,000.
Major Resistance Levels – ,500, and ,000.
Bitcoin Price Slips Lower: Slow Descent or Opportunity Ahead?
Bitcoin price extended losses and declined below the ,200 level. BTC found support near ,650 and now consolidating in a range.
- Bitcoin spiked below ,000 but the bulls are still in action.
- The price is trading above ,000 and the 100 hourly Simple moving average.
- There is a key rising channel forming with resistance at ,200 on the hourly chart of the BTC/USD pair (data feed from Kraken).
- The pair could gain bullish momentum if it settles above the ,400 level.
Bitcoin Price Stuck Below K
Bitcoin price extended its decline below the ,500 level. BTC tested the ,650 zone and recently started a recovery wave. The price traded as low as ,652 before it climbed back above ,500.
The bulls were able to push the price back above ,000. It even spiked above the 50% Fib retracement level of the downward move from the ,550 swing high to the ,652 low. Bitcoin price is now trading above ,000 and the 100 hourly Simple moving average.
On the upside, the price is facing resistance near the ,200 level. There is also a key rising channel forming with resistance at ,200 on the hourly chart of the BTC/USD pair.
The first major resistance could be ,400 or the 61.8% Fib retracement level of the downward move from the ,550 swing high to the ,652 low. The next key resistance could be ,800. A clear move above the ,800 resistance might send the price higher.
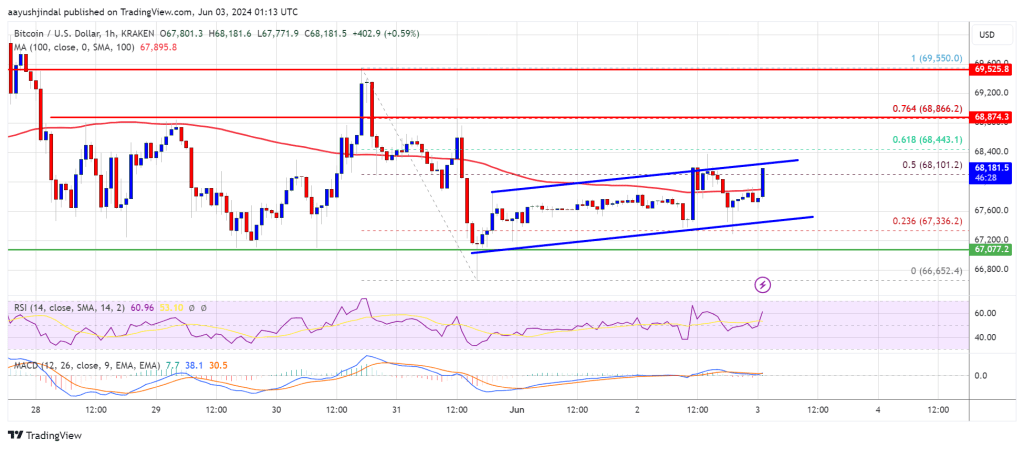
In the stated case, the price could rise and test the ,500 resistance. Any more gains might send BTC toward the ,600 resistance.
More Losses In BTC?
If Bitcoin fails to climb above the ,400 resistance zone, it could start another decline. Immediate support on the downside is near the ,500 level.
The first major support is ,200. The next support is now forming near ,000. Any more losses might send the price toward the ,500 support zone in the near term.
Technical indicators:
Hourly MACD – The MACD is now gaining pace in the bullish zone.
Hourly RSI (Relative Strength Index) – The RSI for BTC/USD is now above the 50 level.
Major Support Levels – ,500, followed by ,000.
Major Resistance Levels – ,400, and ,800.
Study: Crypto Losses 28% Lower in May; Attackers Primarily Targeting Defi Platforms
 In May, cybercriminals were less successful in their attacks on decentralized platforms, resulting in losses attributed to hacks and fraud incidents amounting to approximately .4 million. During the same period last year, digital assets worth .3 million were lost to similar attacks. Gala Games, which incurred a loss of million, and Sonnefinance with […]
Bitcoin News
JPMorgan Predicts ‘Negative’ Initial Reaction for Ethereum ETFs — Expects Lower Demand Than Bitcoin ETFs
 JPMorgan has predicted an initial negative market reaction for spot ethereum exchange-traded funds (ETFs), expecting lower demand compared to bitcoin ETFs. The global investment bank also cautions that approximately billion may exit the Grayscale Ethereum Trust, putting downward pressure on ether prices shortly after the launch of spot ethereum ETFs. ‘Initial Market Reaction to […]
Bitcoin News
XRP Price Grinds Lower: Searching for Support Amid Downtrend
XRP price extended losses below the .5220 support zone. It tested the .5120 support and now attempting another recovery wave toward .550.
- XRP is struggling to start a fresh increase above the .5320 resistance zone.
- The price is now trading below .530 and the 100-hourly Simple Moving Average.
- There is a major bearish trend line forming with resistance near .5230 on the hourly chart of the XRP/USD pair (data source from Kraken).
- The pair could continue to move down if the price stays below .5320.
XRP Price Dips Further
XRP price remained in a short-term bearish zone like Bitcoin and Ethereum. The bears were able to push the price below the key support at .5220. Finally, the price tested the .5120 support zone.
A low was formed at .5126 and the price is now attempting a fresh recovery wave. There was a move above the .5165 level. The price climbed above the 23.6% Fib retracement level of the downward wave from the .5406 swing high to the .5126 low.
However, the price is still trading below .530 and the 100-hourly Simple Moving Average. On the upside, the price is facing resistance near the .5220 level. There is also a major bearish trend line forming with resistance near .5230 on the hourly chart of the XRP/USD pair.
The first key resistance is near .5265 or the 50% Fib retracement level of the downward wave from the .5406 swing high to the .5126 low. A close above the .5265 resistance zone could send the price higher. The next key resistance is near .5320.
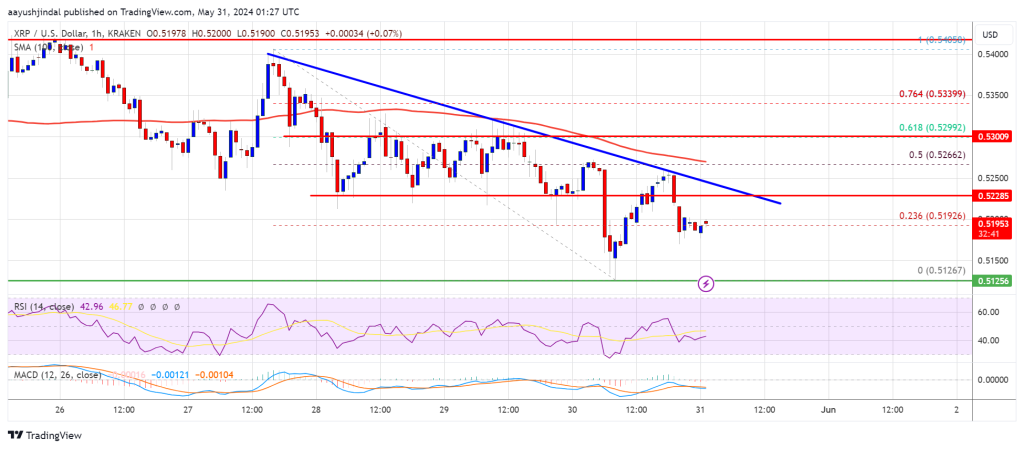
If there is a close above the .5320 resistance level, there could be a steady increase toward the .5450 resistance. Any more gains might send the price toward the .5650 resistance.
More Downsides?
If XRP fails to clear the .5220 resistance zone, it could continue to move down. Initial support on the downside is near the .5150 level.
The next major support is at .5120. If there is a downside break and a close below the .5120 level, the price might accelerate lower. In the stated case, the price could decline and retest the .50 support in the near term.
Technical Indicators
Hourly MACD – The MACD for XRP/USD is now losing pace in the bearish zone.
Hourly RSI (Relative Strength Index) – The RSI for XRP/USD is now below the 50 level.
Major Support Levels – .5120 and .500.
Major Resistance Levels – .5220 and .5320.
Bitcoin Network Adjusts to Lower Fees and Reduced Hashrate After Latest Halving
 Based on the three-day simple moving average, Bitcoin’s hashrate has continued its downward trend, registering at about 550 exahash per second (EH/s). Following the halving, onchain costs have decreased significantly, with data indicating transfer fees ranging from .50 to .65 per transaction. Bitcoin’s Hashrate Slides 19% in 16 Days According to statistics, the three-day simple […]
Bitcoin News
Argentine Lower House Passes Cryptocurrency Legalizing Opportunity in Reintroduced Omnibus Law
 The Argentine Chamber of Deputies passed a series of cryptocurrency tax opportunities for citizens holding undeclared assets in foreign countries as part of reintroducing the “Omnibus law.” The bill, which was dropped in February, has now been reintroduced and approved by the lower house and is expected to be discussed by the Senate in the […]
Bitcoin News
Bitcoin Price Grinds Lower As Bears Aim For New Monthly Low
Bitcoin price struggled to settle above the ,000 zone. BTC is again moving lower and there is a risk of more downsides below ,000.
- Bitcoin started another decline after it failed to surpass the ,000 resistance zone.
- The price is trading below ,500 and the 100 hourly Simple moving average.
- There is a key bearish trend line forming with resistance at ,350 on the hourly chart of the BTC/USD pair (data feed from Kraken).
- The pair could accelerate lower if there is a daily close below the ,400 support zone.
Bitcoin Price Dives Again
Bitcoin price attempted a fresh increase above the ,000 zone. However, BTC failed to gain pace for a move above the ,000 resistance zone. A high was formed at ,301 and the price started another decline.
There was a move below the ,800 level. The price declined below the 50% Fib retracement level of the upward move from the ,408 swing low to the ,301 high. Bitcoin is now trading below ,200 and the 100 hourly Simple moving average.
There is also a key bearish trend line forming with resistance at ,350 on the hourly chart of the BTC/USD pair. The pair is signalling a bearish bias below the 76.4% Fib retracement level of the upward move from the ,408 swing low to the ,301 high.
Immediate resistance is near the ,350 level or the trend line. The first major resistance could be ,000 or ,300. A clear move above the ,300 resistance might send the price higher. The next resistance now sits at ,000.
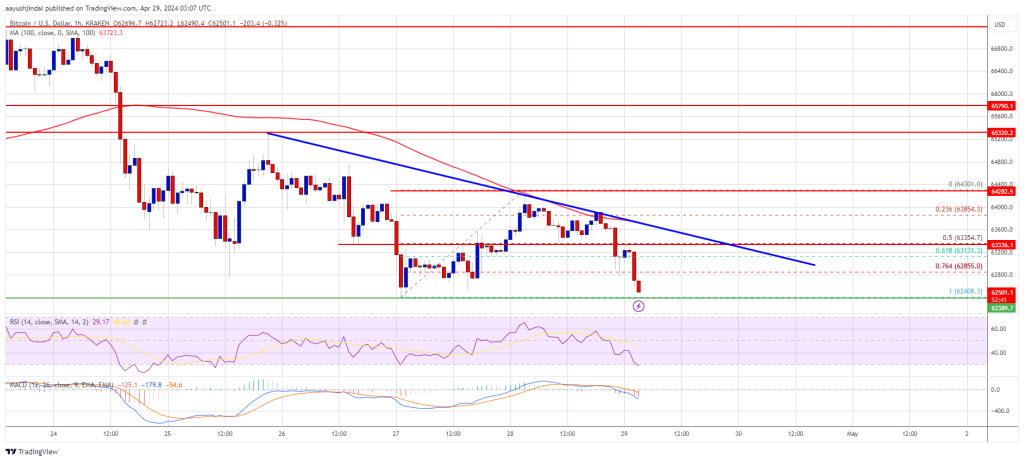
Source: BTCUSD on TradingView.com
If there is a clear move above the ,000 resistance zone, the price could continue to move up. In the stated case, the price could rise toward ,500. The next major resistance is near the ,200 zone. Any more gains might send Bitcoin toward the ,500 resistance zone in the near term.
More Losses In BTC?
If Bitcoin fails to rise above the ,350 resistance zone, it could continue to move down. Immediate support on the downside is near the ,400 level.
The first major support is ,000. If there is a close below ,000, the price could start to drop toward ,200. Any more losses might send the price toward the ,000 support zone in the near term.
Technical indicators:
Hourly MACD – The MACD is now gaining pace in the bearish zone.
Hourly RSI (Relative Strength Index) – The RSI for BTC/USD is now below the 50 level.
Major Support Levels – ,400, followed by ,000.
Major Resistance Levels – ,350, ,000, and ,000.