 The decentralized exchange Velocore confirmed a breach on its platform on June 2, during which attackers stole ethereum tokens worth an estimated .8 to million. The Velocore team is actively pursuing the hackers and is open to negotiating a settlement. Hackers Exploited Vulnerabilities Within the CPMM Pool Contract The decentralized exchange Velocore on Zksync […]
Bitcoin News
Study: Crypto Losses 28% Lower in May; Attackers Primarily Targeting Defi Platforms
 In May, cybercriminals were less successful in their attacks on decentralized platforms, resulting in losses attributed to hacks and fraud incidents amounting to approximately .4 million. During the same period last year, digital assets worth .3 million were lost to similar attacks. Gala Games, which incurred a loss of million, and Sonnefinance with […]
Bitcoin News
JayX Launches Unique LK Trading Contest: Win Big Even with Losses
 PRESS RELEASE. JayX, a leader in blockchain innovation, is thrilled to announce the LK Trading Contest, a novel event designed to engage traders of all levels with its unique dual prize structure. Running from May 20, 2024, 10:00 UTC to June 20, 2024, 9:59 UTC, this competition celebrates both high performers and those who face […]
Bitcoin News
XRP Bears Keeps Pushing, Indicators Suggest A Strengthening Case of More Losses
XRP price started a fresh decline from the .5050 resistance zone. The price could decline further if there is a close below the .4865 support.
- XRP extended losses and traded below the .500 support.
- The price is now trading below .4950 and the 100-hourly Simple Moving Average.
- There is a key bearish trend line forming with resistance at .4980 on the hourly chart of the XRP/USD pair (data source from Kraken).
- The pair could slide further toward the .4550 support in the near term.
XRP Price Dives Below .50
Recently, XRP price attempted a recovery wave above the .5050 level. However, the bears were active and the price started a fresh decline below the .500 support, like Ethereum and Bitcoin.
There was a move below the .4920 and .4880 levels. A low was formed at .4867 and the price is now consolidating losses. It is trading near the 23.6% Fib retracement level of the downward move from the .5085 swing high to the .4867 low.
The price is now trading below .4950 and the 100-hourly Simple Moving Average. Immediate resistance is near the .4980 level. There is also a key bearish trend line forming with resistance at .4980 on the hourly chart of the XRP/USD pair. It is close to the 50% Fib retracement level of the downward move from the .5085 swing high to the .4867 low.
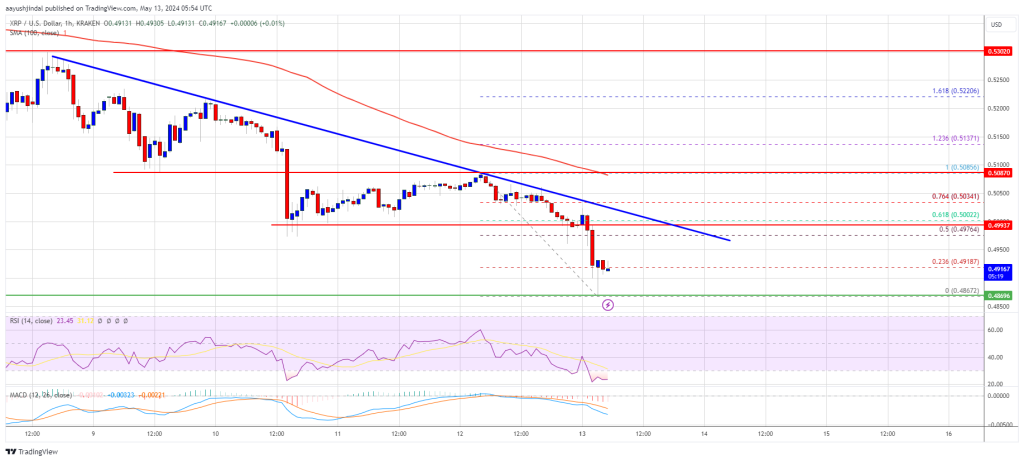
Source: XRPUSD on TradingView.com
The first key resistance is near .500. A close above the .500 resistance zone could spark a strong increase. The next key resistance is near .5085 and the 100-hourly Simple Moving Average. If the bulls remain in action above the .5085 resistance level, there could be a rally toward the .5250 resistance. Any more gains might send the price toward the .550 resistance.
More Losses?
If XRP fails to clear the .50 resistance zone, it could start another decline. Initial support on the downside is near the .4865 level.
The next major support is at .4780. If there is a downside break and a close below the .4780 level, the price might accelerate lower. In the stated case, the price could retest the .450 support zone.
Technical Indicators
Hourly MACD – The MACD for XRP/USD is now gaining pace in the bearish zone.
Hourly RSI (Relative Strength Index) – The RSI for XRP/USD is now below the 50 level.
Major Support Levels – .4865 and .4780.
Major Resistance Levels – .500 and .5085.
XRP Price Consolidates Below $0.530: What Could Trigger More Losses?
XRP price is consolidating losses above the .500 support. The price could extend losses if it fails to recover above the .530 resistance zone.
- XRP extended losses and traded below the .530 support.
- The price is now trading below .5250 and the 100-hourly Simple Moving Average.
- There was a break above a connecting bearish trend line with resistance at .5150 on the hourly chart of the XRP/USD pair (data source from Kraken).
- The pair could start another increase if the bulls push the price above .530.
XRP Price Stable Above .50
Recently, XRP price extended losses and traded below the .5250 support, like Bitcoin and Ethereum. There was a move toward the .5080 support. A low was formed at .5087 and the price is now consolidating losses.
There was a minor increase above the .5120 resistance. Besides, there was a break above a connecting bearish trend line with resistance at .5150 on the hourly chart of the XRP/USD pair. However, the pair is still trading below .5250 and the 100-hourly Simple Moving Average.
Immediate resistance is near the .5250 level. It is near the 23.6% Fib retracement level of the downward move from the .5699 swing high to the .5087 low. The first key resistance is near .530 and the 100-hourly Simple Moving Average.
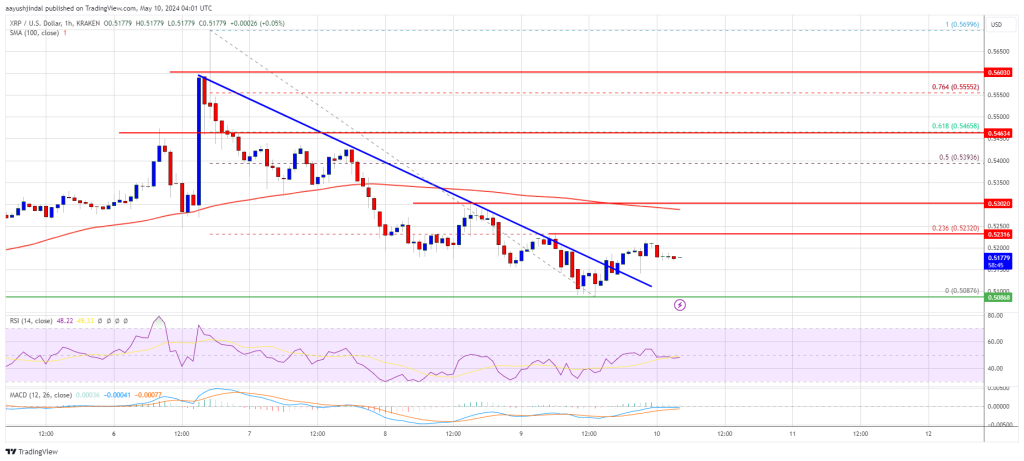
Source: XRPUSD on TradingView.com
A close above the .530 resistance zone could spark a strong increase. The next key resistance is near .5465. If the bulls remain in action above the .5465 resistance level, there could be a rally toward the .580 resistance. Any more gains might send the price toward the .600 resistance.
More Losses?
If XRP fails to clear the .530 resistance zone, it could start another decline. Initial support on the downside is near the .5150 level.
The next major support is at .5080. If there is a downside break and a close below the .5080 level, the price might accelerate lower. In the stated case, the price could retest the .4840 support zone.
Technical Indicators
Hourly MACD – The MACD for XRP/USD is now losing pace in the bearish zone.
Hourly RSI (Relative Strength Index) – The RSI for XRP/USD is now below the 50 level.
Major Support Levels – .5150 and .5080.
Major Resistance Levels – .5250 and .530.
Mixed Fortunes for US Bitcoin Funds as GBTC Losses Offset Other Gains
 Following two days of positive inflows, U.S. spot bitcoin exchange-traded funds (ETFs) experienced a decline, with .7 million exiting on Tuesday. Grayscale’s Bitcoin Trust (GBTC) saw million leave during the day’s trading sessions, overshadowing the break-even and positive reports from the other spot bitcoin funds. Fidelity, Ark Invest, Invesco Report Gains While GBTC Struggles […]
Bitcoin News
Meta Faces Tough Market Response as AI Investments Surge and Metaverse Losses Continue
 Meta’s shares dropped 15% in after-hours trading following announcements in April of plans for significant investment in AI, alongside a weaker revenue outlook and continued losses in its metaverse division, Reality Labs. The company anticipates its expenses will soar to between billion and billion for the fiscal year, attributing the increase to higher […]
Bitcoin News
Bitcoin Investors In The Red: Losses Trump Profits As Ratio Dips Below 1
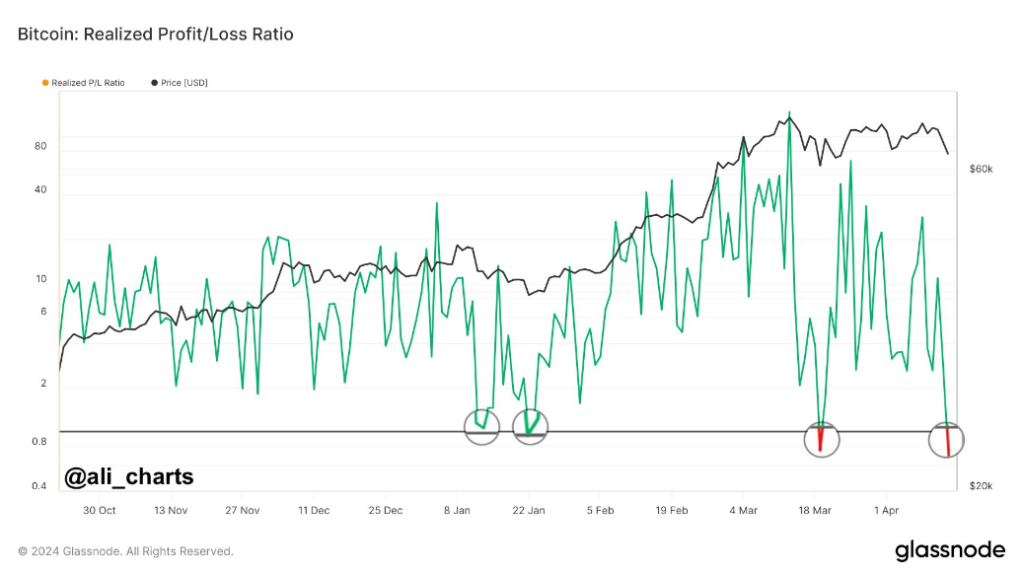
Investors are bracing themselves for a rollercoaster ride as Bitcoin, the flagship digital asset, navigates through choppy waters. Recent data from Glassnode has revealed a noteworthy development: the Realized Profit/Loss Ratio for Bitcoin has dipped below one.
This crucial metric, which compares the sell value of Bitcoin with the price at which it was bought, indicates that investors are currently realizing more losses than profits. Historically, such a dip has often heralded a potential bottoming out of Bitcoin’s price, serving as a vital signal for market watchers.
Sense Of Optimism Despite Bitcoin Price Decline
The past 24 hours have witnessed significant volatility in Bitcoin’s price trajectory. A sharp decline early in the day saw Bitcoin’s price plummet to approximately ,000, worrying many investors.
However, a remarkable recovery ensued, with the price steadily climbing and peaking at around ,000. This robust rebound has instilled a sense of optimism, with a prevailing bullish sentiment taking hold as the day progressed.
Institutional interest in Bitcoin continues to grow, with recent developments signaling potential shifts in capital inflows. The approval of a spot Bitcoin ETF by Hong Kong regulators has opened the floodgates for increased institutional engagement, particularly from Asia.
This move could inject fresh capital into Bitcoin markets, potentially fueling further price momentum. Furthermore, regional dynamics play a significant role in shaping investor sentiment and behavior. Varying investment trends across different regions highlight the diverse responses to prevailing market conditions.
While some regions may exhibit cautious sentiment amidst volatility and geopolitical uncertainties, others may embrace Bitcoin as a hedge against inflation and currency devaluation.
Critical Support Levels
Bitcoin analyst Willy Woo has pinpointed a critical support level at ,000. Breaching this threshold could signify a transition into a bearish market sentiment. Conversely, there’s anticipation among investors for potential short liquidations that could drive the price upwards, potentially reaching between ,000 and ,000, provided that current support levels hold steady.
These anticipated events hinge on market liquidity and investor reactions to the rapidly evolving price movements. As Bitcoin continues its consolidation phase near all-time highs, investors remain cautiously optimistic about its future prospects.
The upcoming halving event adds another layer of complexity to the already intricate market dynamics, with expectations of heightened volatility in the days ahead.
Analysts suggest that this period of lateral movement serves as a crucial stage for the redistribution of assets among investors, potentially laying the groundwork for a more sustainable recovery in the long run.
The cryptocurrency market, particularly Bitcoin, is navigating through a period of heightened uncertainty and volatility. The recent dip in the Realized Profit/Loss Ratio signals a potential turning point in Bitcoin’s price trajectory, while institutional interest and regional dynamics continue to shape market sentiment.
Featured image from Pexels, chart from TradingView
Ethereum Price Fails Again, Signs Of More Losses Below $3,300
Ethereum price is struggling to recover above the ,360 resistance zone. ETH is now showing signs of more losses below the ,300 and ,250 levels.
- Ethereum is facing many hurdles near the ,350 and ,360 levels.
- The price is trading below ,350 and the 100-hourly Simple Moving Average.
- There was a break below a rising channel with support at ,320 on the hourly chart of ETH/USD (data feed via Kraken).
- The pair could extend losses if there is a close below the ,200 support zone.
Ethereum Price Signals Downside
Ethereum price traded below the ,300 level before the bulls appeared. ETH traded as low as ,215 before there was a minor recovery wave, like Bitcoin. The price climbed above the ,250 and ,280 levels.
There was a move above the 23.6% Fib retracement level of the downward wave from the ,655 swing high to the ,215 low. However, the bears were active near the ,360 resistance. The bulls struggled and the price reacted to the downside.
There was a break below a rising channel with support at ,320 on the hourly chart of ETH/USD. Ethereum is now trading below ,300 and the 100-hourly Simple Moving Average.
Immediate resistance is near the ,300 level. The first major resistance is near the ,360 level. The next key resistance sits at ,435 or the 50% Fib retracement level of the downward wave from the ,655 swing high to the ,215 low, above which the price might test the ,500 level.
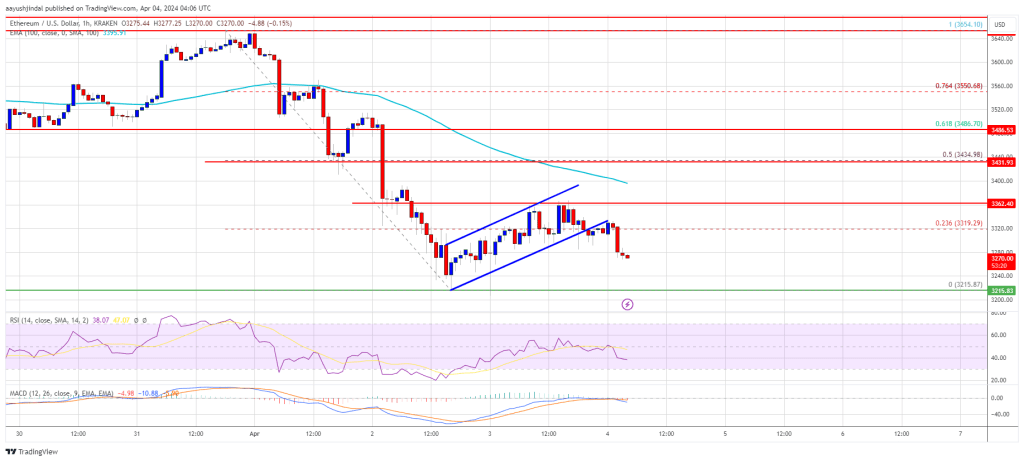
Source: ETHUSD on TradingView.com
The next key resistance is seen near the ,550 level, above which Ether could gain bullish momentum. In the stated case, the price could rise toward the ,650 zone. If there is a move above the ,650 resistance, Ethereum could even rise toward the ,750 resistance. Any more gains might call for a test of ,800.
More Losses In ETH?
If Ethereum fails to clear the ,360 resistance, it could continue to move down. Initial support on the downside is near the ,240 level.
The first major support is near the ,215 zone. The next key support could be the ,200 zone. A clear move below the ,200 support might send the price toward ,120. Any more losses might send the price toward the ,040 level.
Technical Indicators
Hourly MACD – The MACD for ETH/USD is gaining momentum in the bearish zone.
Hourly RSI – The RSI for ETH/USD is now below the 50 level.
Major Support Level – ,215
Major Resistance Level – ,360
Bitcoin Price Consolidates Losses But Recovery Could Face Hurdles
Bitcoin price extended its decline below the ,000 support zone. BTC is now consolidating losses and might attempt a recovery wave toward ,000.
- Bitcoin price declined further below the ,500 and ,000 levels.
- The price is trading below ,500 and the 100 hourly Simple moving average.
- There is a key bearish trend line forming with resistance near ,200 on the hourly chart of the BTC/USD pair (data feed from Kraken).
- The pair could recover but the bears might remain active near ,000.
Bitcoin Price Drops Further
Bitcoin price turned red after it broke the ,000 support zone. BTC extended its decline below the ,500 and ,000 levels. Finally, it tested the ,500 region.
A low was formed near ,572 and the price is now consolidating losses. There was a move above the ,000 level. The price even tested the 23.6% Fib retracement level of the downward move from the ,306 swing high to the ,572 low.
Bitcoin is now trading below ,000 and the 100 hourly Simple moving average. There is also a key bearish trend line forming with resistance near ,200 on the hourly chart of the BTC/USD.
Immediate resistance is near the ,000 level. The first major resistance could be ,200 and the trend line. If there is a clear move above the ,200 resistance zone, the price could start a fresh increase. In the stated case, the price could rise toward the 50% Fib retracement level of the downward move from the ,306 swing high to the ,572 low at ,950.
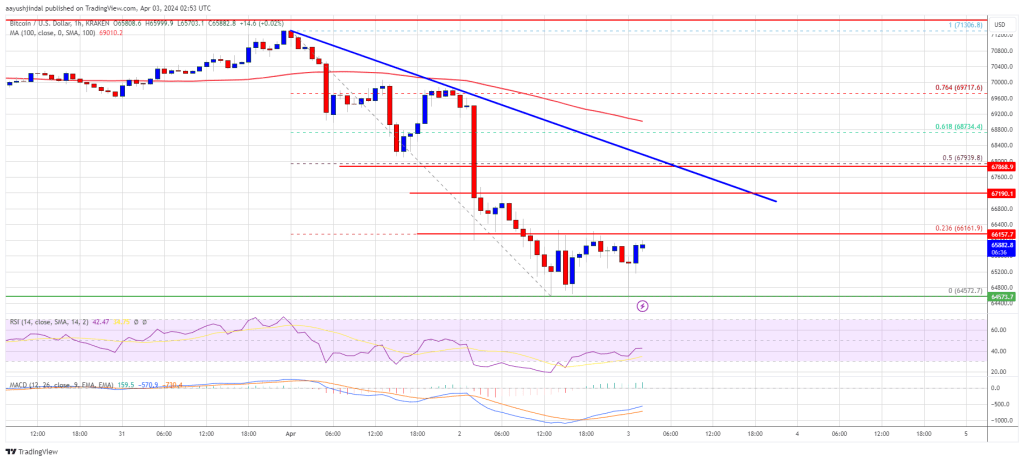
Source: BTCUSD on TradingView.com
The next major resistance is near the ,500 zone. Any more gains might send Bitcoin toward the ,000 resistance zone in the near term.
More Losses In BTC?
If Bitcoin fails to rise above the ,200 resistance zone, it could continue to move down. Immediate support on the downside is near the ,200 level.
The first major support is ,500. The next support sits at ,000. If there is a close below ,000, the price could start a drop toward the ,500 level. Any more losses might send the price toward the ,500 support zone in the near term.
Technical indicators:
Hourly MACD – The MACD is now losing pace in the bearish zone.
Hourly RSI (Relative Strength Index) – The RSI for BTC/USD is now below the 50 level.
Major Support Levels – ,200, followed by ,500.
Major Resistance Levels – ,000, ,200, and ,950.