 Losses attributed to crypto crimes involving the use of deepfakes are projected to surpass billion in 2024. According to the latest Bitget research study, these losses are expected to continue rising if no regulatory intervention is introduced to curb this type of fraud. Educating users and implementing comprehensive legal and cybersecurity frameworks globally are […]
Bitcoin News
Federal Reserve Stress Test Projects $685 Billion in Losses for Large Banks
 The Federal Reserve Board’s annual stress test results reveal that large banks are expected to face nearly 5 billion in projected losses during a severe recession scenario. These losses are significantly higher than last year due to increased risks in bank balance sheets and higher expenses. The aggregate common equity tier 1 (CET1) capital ratio […]
Bitcoin News
Bearish Wave Hits Solana: SOL Drops Below $140 – More Losses On The Horizon?
Solana, a leading blockchain platform, is experiencing a significant downturn as a persistent bearish wave sweeps through its market. This decline, driven by a combination of factors, has led to SOL’s price suffering a huge drop below the 0 support mark.
Solana’s price has struggled to find stability, breaking through key support levels and signaling further potential losses. As bearish sentiment continues to dominate, traders and investors are closely monitoring the situation, seeking signs of a possible reversal or additional declines in the near future.
Technical Indicators Signal Further Losses For Solana
On the 4-hour chart, the price of SOL is beginning to decline again after a failed attempt to move upward. It should also be noted here that the digital asset is still actively bearish trading below the 100-day Simple Moving Average (SMA).
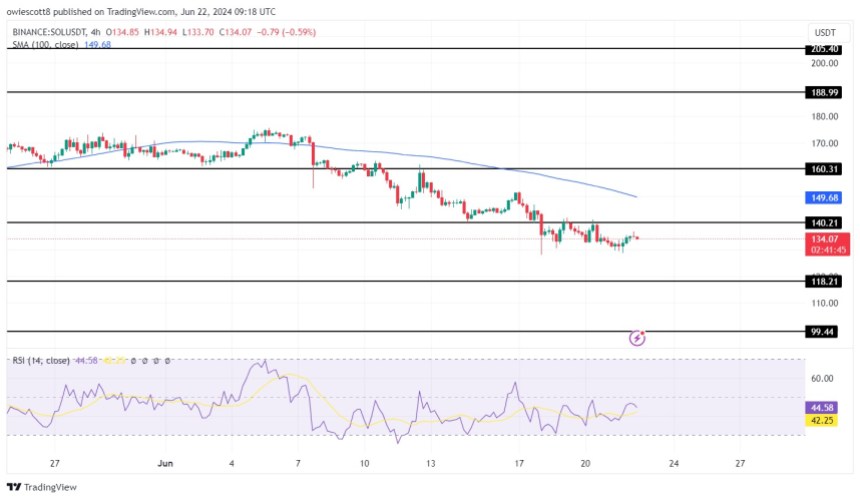
The 4-hour Relative Strength Index (RSI) also suggests that Solana may be poised for a further decline as the signal line of the RSI indicator is attempting a reversal below 50% dropping toward the oversold.
From the 1-day chart based on the current price movement, it can be observed that SOL is still actively bearish as it is still trading below the 100-day SMA. It can also be noticed here that it is attempting to start moving downward by dropping a rejection candlestick.
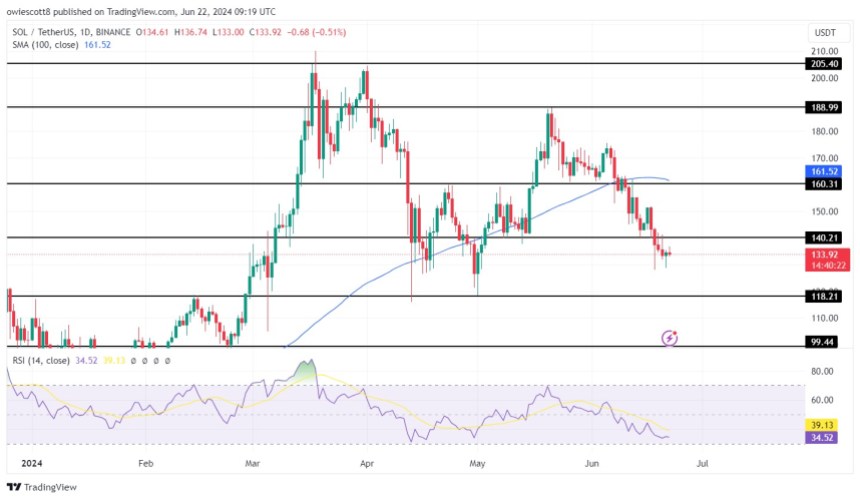
Also, the RSI indicator reveals that SOL’s price may likely decline further as the RSI line is actively trending below 50% heading toward the oversold zone. It is worth noting that from the analysis and technical indicators on both the 4-hour and 1-day chart, it can be suggested that the price of SOL may extend its decline for a while.
Potential Scenarios For SOL’s Price Movement
Presently, Solana has broken below the 0 mark and is attempting a downward move toward the 8 support level. If SOL’s price breaks this level, it will continue to move down to test the support level and may probably move on to test other lows if it breaches below this level.
However, if it fails to move downward as predicted and breaks above the 0 mark, it will start a move toward the 0 resistance level. Should it break above this resistance level, it will continue to move upward to test the 8 resistance level. Furthermore, Solana may witness a higher climb to test the 5 resistance level on the chart if it breaks the above support level and possibly heads on to create a new high.
The price of SOL has decreased by 0.57%, trading at about 3 in the last 24 hours, with a market capitalization of more than billion and a trading volume of more than .9 billion as of the time of writing. There has been a 12.94% increase in market capitalization in the last day despite the trading volume being down by 9.84%.
Fifth Day of Outflows Hits US Bitcoin ETFs With $139 Million in Losses
 U.S. spot bitcoin exchange-traded funds (ETFs) experienced their fifth consecutive day of outflows on Thursday, losing 9.88 million. Grayscale’s Bitcoin Trust (GBTC) led the decline with a million reduction, followed closely by Fidelity’s (FBTC) million loss. U.S. Bitcoin ETFs Experience Sustained Outflows The 11 spot bitcoin ETFs reported .16 billion in trade volume […]
Bitcoin News
Dogecoin Bears Return: Indicators Point To More Losses In DOGE
Dogecoin started another decline from the .1285 resistance zone against the US Dollar. DOGE is consolidating and might resume its decline below .1220.
- DOGE price is moving lower below the .1250 support zone.
- The price is trading below the .1250 level and the 100-hourly simple moving average.
- There is a key rising channel or a bearish flag pattern forming with support near .1220 on the hourly chart of the DOGE/USD pair (data source from Kraken).
- The price must settle above .1260 and .1285 to gain bullish momentum and start a fresh increase.
Dogecoin Price Dips Again
After a decent recovery wave, Dogecoin price faced resistance near the .1285 zone. DOGE failed to continue higher and started a fresh decline from the .1285 high like Bitcoin and Ethereum.
There was a move below the .1250 support level and the 100-hourly simple moving average. The price dipped below the 23.6% Fib retracement level of the upward move from the .1129 swing low to the .1285 high. However, the bulls are now active near the .1220 zone.
Dogecoin is now trading below the .1250 level and the 100-hourly simple moving average. There is also a key rising channel or a bearish flag pattern forming with support near .1220 on the hourly chart of the DOGE/USD pair.
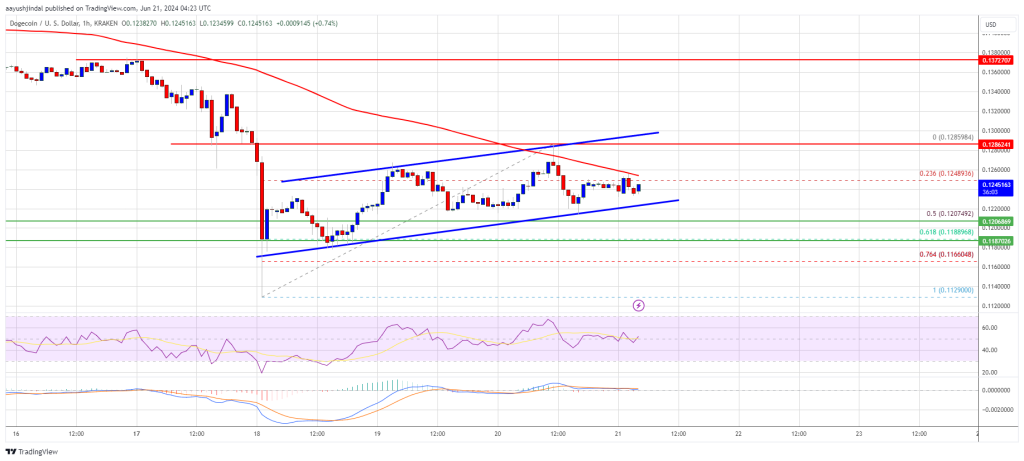
If there is a fresh increase, the price might face resistance near the .1260 level. The next major resistance is near the .1285 level. A close above the .1285 resistance might send the price toward the .1350 resistance. Any more gains might send the price toward the .1420 level. The next major stop for the bulls might be .150.
More Losses In DOGE?
If DOGE’s price fails to gain pace above the .1285 level, it could continue to move down. Initial support on the downside is near the .1220 level.
The next major support is near the .1185 level. If there is a downside break below the .1185 support, the price could decline further. In the stated case, the price might decline toward the .1120 level.
Technical Indicators
Hourly MACD – The MACD for DOGE/USD is now gaining momentum in the bearish zone.
Hourly RSI (Relative Strength Index) – The RSI for DOGE/USD is now below the 50 level.
Major Support Levels – .1220, .1185 and .1120.
Major Resistance Levels – .1260, .1285, and .1320.
XRP Price Under Siege: Losses Likely to Extend Amid Market Weakness
XRP price struggled to surpass the .500 resistance zone. The price is moving lower and showing bearish signs for a move below the .4850 support.
- XRP price faced another rejection near the .50 resistance zone.
- The price is now trading below .4950 and the 100-hourly Simple Moving Average.
- There was a break below a short-term rising channel with support at .4920 on the hourly chart of the XRP/USD pair (data source from Kraken).
- The pair could extend losses if there is a close below the .4850 support zone.
XRP Price Dips Again
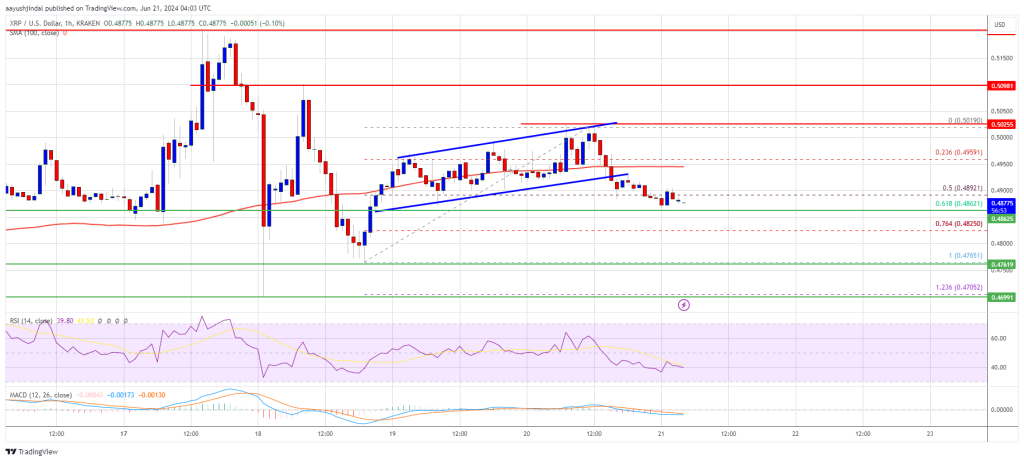
XRP price attempted a fresh increase above the .4950 resistance zone. It even spiked above the .50 resistance but there was no real bullish momentum. A high was formed at .5019 and the price started a fresh decline like Bitcoin.
There was a move below the .4980 and .4950 levels. There was a break below a short-term rising channel with support at .4920 on the hourly chart of the XRP/USD pair. The pair even traded below the 50% Fib retracement level of the upward move from the .4765 swing low to the .5019 high.
The price is now trading below .4950 and the 100-hourly Simple Moving Average. The bulls seem to be active near the .4850 support and the 61.8% Fib retracement level of the upward move from the .4765 swing low to the .5019 high.
If there is a fresh increase, the price might face hurdles near the .4950 level. The first major resistance is near the .50 and .5020 levels. A clear move above the .5020 resistance might send the price toward the .5150 resistance.
The next major resistance is near the .5250 level. A close above the .5250 resistance zone could send the price higher. The next key resistance is near .5320. Any more gains might send the price toward the .550 resistance.
More Losses?
If XRP fails to clear the .50 resistance zone, it could continue to move down. Initial support on the downside is near the .4850 level.
The next major support is at .4765. If there is a downside break and a close below the .4765 level, the price might gain bearish momentum. In the stated case, the price could even trade below the .4540 low in the near term.
Technical Indicators
Hourly MACD – The MACD for XRP/USD is now gaining pace in the bearish zone.
Hourly RSI (Relative Strength Index) – The RSI for XRP/USD is now below the 50 level.
Major Support Levels – .4850 and .4765.
Major Resistance Levels – .5020 and .5150.
Bitcoin Price Slide: Extends Losses Amid Increased Selling Pressure
Bitcoin price extended its losses and traded below the ,000 level. BTC is showing bearish signs and might extend losses below the ,600 level.
- Bitcoin remained in a bearish zone and traded below ,000.
- The price is trading below ,000 and the 100 hourly Simple moving average.
- There is a connecting trend line forming with resistance at ,500 on the hourly chart of the BTC/USD pair (data feed from Kraken).
- The pair could continue to move down and even trade below the ,500 support zone.
Bitcoin Price Extends Its Decline
Bitcoin price struggled to recover above the ,500 resistance zone. BTC remained in a bearish zone and started a fresh decline from the ,256 high. There was a move below the ,500 level.
There was a clear move below the ,500 and ,000 support levels. Finally, the price tested ,600. A low was formed at ,611 and the price is now consolidating losses. There was a minor increase above the ,000 level. The price climbed above the 23.6% Fib retracement level of the downward move from the ,256 swing high to the ,611 low.
Bitcoin is now trading below ,000 and the 100 hourly Simple moving average. There is also a connecting trend line forming with resistance at ,500 on the hourly chart of the BTC/USD pair.
On the upside, the price is facing resistance near the ,000 level or the 50% Fib retracement level of the downward move from the ,256 swing high to the ,611 low. The first major resistance could be ,250. The next key resistance could be ,500.
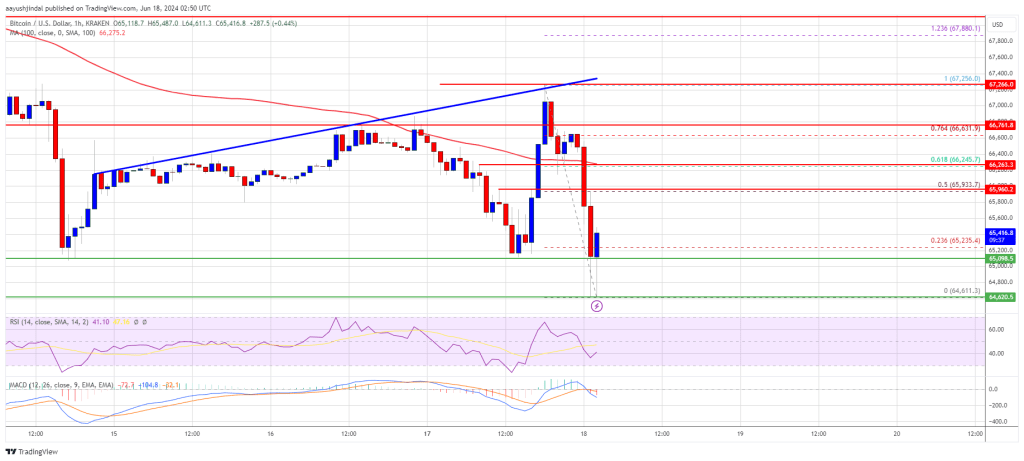
A clear move above the ,500 resistance might start a decent increase and send the price higher. In the stated case, the price could rise and test the ,500 resistance. Any more gains might send BTC toward the ,500 resistance in the near term.
More Losses In BTC?
If Bitcoin fails to climb above the ,000 resistance zone, it could continue to move down. Immediate support on the downside is near the ,000 level.
The first major support is ,600. The next support is now forming near ,500. Any more losses might send the price toward the ,200 support zone in the near term.
Technical indicators:
Hourly MACD – The MACD is now gaining pace in the bearish zone.
Hourly RSI (Relative Strength Index) – The RSI for BTC/USD is now below the 50 level.
Major Support Levels – ,000, followed by ,500.
Major Resistance Levels – ,000, and ,500.
Crypto Economy Shrinks, Over 3 Dozen Coins Record Double-Digit Losses
 While the crypto market experienced a general decline, with bitcoin dropping 5.6% and ethereum falling 4.4%, roughly six crypto tokens managed to stand out over the past week. Weekly Crypto Report: Bitcoin and Ethereum Drop, Numerous Tokens See Major Losses As of this writing, the global crypto market capitalization stands at .39 trillion, reflecting a […]
Bitcoin News
US Banking Sector Teeters: $517B Unrealized Losses, 63 Troubled Institutions Flagged
 U.S. banks reported an alarming increase in unrealized losses and a growing list of institutions at risk of failure in the first quarter of 2024, according to the latest U.S. Federal Deposit Insurance Corporation (FDIC) data. The FDIC report highlights 7 billion in unrealized losses and identifies 63 banks as vulnerable, marking a concerning uptick […]
Bitcoin News
Decentralized Exchange Velocore Confirms Breach, Reports $6.8 Million in Financial Losses
 The decentralized exchange Velocore confirmed a breach on its platform on June 2, during which attackers stole ethereum tokens worth an estimated .8 to million. The Velocore team is actively pursuing the hackers and is open to negotiating a settlement. Hackers Exploited Vulnerabilities Within the CPMM Pool Contract The decentralized exchange Velocore on Zksync […]
Bitcoin News