 Recent data from Glassnode provides a detailed analysis of bitcoin’s long-term holders (LTH) and their impact on the cryptocurrency market. In the latest onchain report, researchers highlight key metrics and behaviors of LTHs to understand supply and demand dynamics. Bitcoin Market Trends and Long-Term Holders Analyzed in the Latest Glassnode Report Glassnode’s analysis shows that […]
Bitcoin News
Former Coinbase Business Developer: ‘There Wasn’t a Long-Term Case for Bitcoin Payments’
 Nick Tomaino, a former business developer and marketing lead at Coinbase, explained how the idea of bitcoin for payments gradually lost its relevance in the market. Tomaino detailed that Coinbase rode this premise back in 2014 to raise 5 million in two funding rounds, but it was quickly clear that there was not a case […]
Bitcoin News
Bitcoin Price Surge To $71,000 Sends All Long-Term Holders Into Profit, What About Short-Term Holders?
Bitcoin long-term holders are back in profit following the flagship crypto’s recent price surge. However, the same can’t be said for most short-term holders yet, given the levels at which they purchased their Bitcoin holdings.
Only 0.03% Of Long-term Bitcoin Holder Supply In Loss
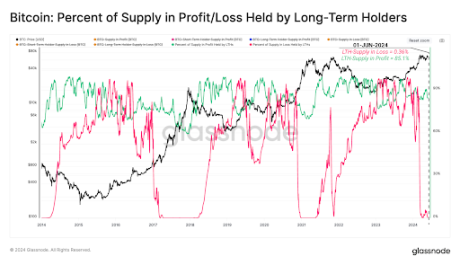
In a recent market report, on-chain analytics platform Glassnode claimed that the total volume of long-term holder (LTH) supply held in loss is “negligible,” with only 4,900 BTC (0.03% of LTH) acquired above Bitcoin’s current price. These long-term holders in loss are said to have been those who bought the 2021 cycle top and have held since then.
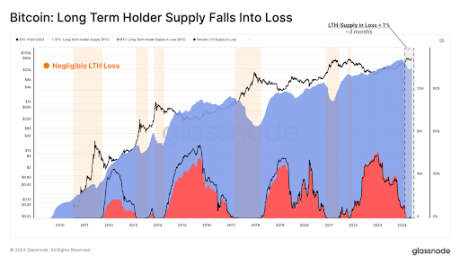
Long-term holders currently account for over 85% of the Bitcoin supply in profit. Glassnode noted that this was to be expected, given that the LTH supply in loss during the euphoric phase of the bull market “tends towards zero.” Therefore, this LTH will keep accounting for most of the supply in profit as the bull run progresses.
Tokens held for more than 155 days fall under this LTH supply, although most investors in this category are likely those who held with high conviction throughout the last bear market, even as Bitcoin dropped below ,000. Back then, this LTH supply accounted for most of the unrealized losses.
Short-Term Holder Supply Accounts For Most Unrealized Loss
Glassnode revealed that the short-term holder (STH) supply currently accounts for most of the market losses as these investors continue to buy the flagship crypto near local and global highs. As such, these holders automatically fall back into a loss whenever Bitcoin encounters a price correction.
Data from Glassnode shows that 1 million BTC (26.6%) out of the 3.35 million BTC representing the STH supply are currently at a loss. An overwhelming 56% (1.9 million BTC) of the STH supply is said to have moved into an unrealized loss when Bitcoin recently experienced a price drawdown to the ,000 level.
Glassnode also revealed that a “significant cluster” of STH coins was accumulated close to the current spot price. This is significant considering how investors who invested in this region could react to any volatile price fluctuations, irrespective of what direction they take. A significant drop or increase in Bitcoin’s price could lead these investors to offload their tokens.
Besides these short-term holders, Glassnode suggested that the ‘Single-Cycle holders’ are another group of investors to keep an eye on. These investors have been holding a “significant magnitude of unrealized profit” since Bitcoin broke above the ,000 range. They already took some profits when Bitcoin hit its current all-time high (ATH) of ,000 in March and will likely offload more of their tokens as Bitcoin reaches a new ATH.
Best Long-Term Bitcoin Buy Signal Flashes, Hedge Fund CEO Warns
In his latest dispatch, Charles Edwards, CEO of the Bitcoin and digital asset hedge fund Capriole, has flagged a significant market indicator in the latest edition of the firm’s newsletter, Update #51. Edwards points to the activation of the “Hash Ribbons” buy signal, a notable event that has historically indicated prime buying opportunities for Bitcoin.
Bitcoin Hash Ribbons Flash Buy Signal
The Hash Ribbons indicator, first introduced in 2019, utilizes mining data to predict long-term buying opportunities based on miners’ economic pressures. The signal arises from the convergence of short-term and long-term moving averages of Bitcoin’s hash rate, specifically when the 30-day moving average falls below the 60-day. According to Edwards, this event has “in the vast majority of cases synced with broader Bitcoin market weakness, price volatility and significantly long-term value opportunities.”
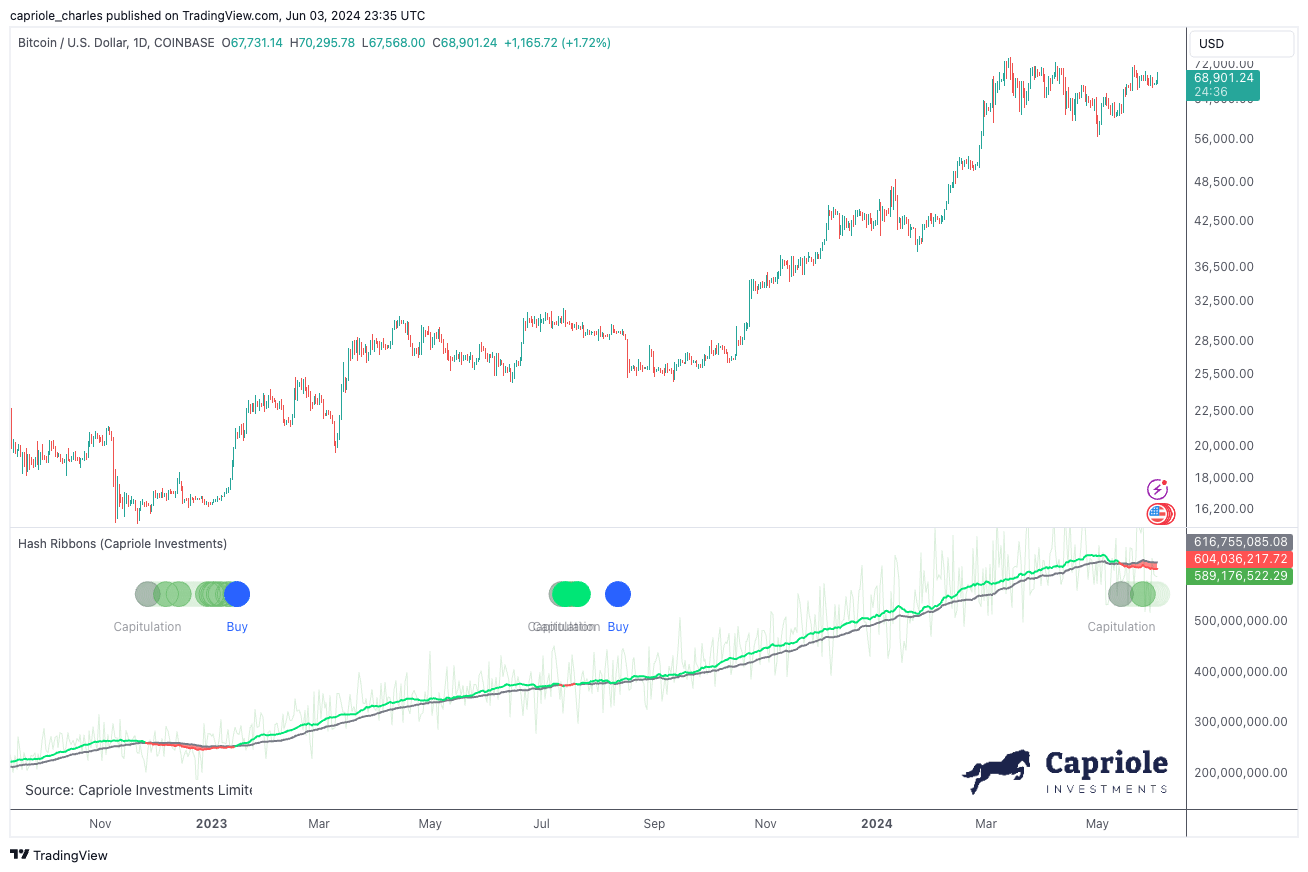
The current Miner Capitulation, as highlighted by Edwards, began two weeks ago and coincides with post-halving adjustments in the mining sector. This period often leads to the shuttering of operations and even bankruptcies among less efficient miners. Edwards notes, “Just as we are seeing today, these mining rigs will typically then be phased out over several weeks following the Halving resulting in falling hash rates.”
Despite the historical profitability of miners, especially with increased block fees from new applications such as Ordinals and Runes, Edwards suggests that the market should not overlook the current opportunity signaled by the latest Miner Capitulation. “While this capitulation is occurring when miners have broadly been profitable, we would be remiss not to note this rare opportunity,” stated Edwards.
The Hash Ribbons have not been without their critics, with each occurrence stirring debate about the current relevance and accuracy of the signal. Edwards addressed these criticisms by referencing the previous year’s signal, which correlated with Bitcoin trading in the ,000 range, reinforcing the indicator’s predictive strength. “Every occurrence brings some debate about their relevance today, or why the current signal perhaps doesn’t count,” Edwards explained.
Edwards recommends that the safest approach to leveraging the Hash Ribbons is by waiting for confirmation through renewed hash rate growth and a positive price trend. He concludes, “The safest (lowest volatility opportunity) to allocate to the Hash Ribbons strategy is on confirmation of the Hash Ribbon Buy which is triggered by renewed Hash Rate growth (30DMA>60DMA) and a positive price trend (as defined by the 10DMA>20DMA of price).”
Broader Market Context
Transitioning from the technical to the contextual, Edwards discusses the changing regulatory landscape that has recently become more favorable to cryptocurrencies. The SEC’s approval of an Ethereum ETF, categorizing ETH as a commodity, marks a significant shift in the regulatory approach towards cryptocurrencies and reflects growing institutional acceptance.
“The reclassification of Ethereum and the approval of its ETF represent a pivotal shift in governmental stance on cryptocurrencies,” Edwards notes. “This could lead to increased institutional involvement and potentially more stability in the crypto markets.”
Furthermore, Edwards points to macroeconomic factors that could influence Bitcoin’s value. The expansion of the M2 money supply and the Federal Reserve’s stance on interest rates are designed to stimulate economic activity. However, Edwards warns of the potential long-term consequences of these policies, such as inflation, which could enhance Bitcoin’s appeal as a hedge against monetary devaluation.
“Bitcoin was conceptualized as an alternative to traditional financial systems in times of economic stress,” Edwards remarks. “The current economic policies reinforce the fundamental reasons for Bitcoin’s existence and could lead to increased adoption.”
On the technical front, Edwards provides an analysis of Bitcoin’s price movements, highlighting the recent breakout and consolidation above critical resistance levels. He sets a conditional mid-term price target of 0,000, contingent upon the market sustaining its current momentum and the monthly close remaining above a critical threshold of ,000.
At press time, BTC traded at ,008.
Long-Term Bitcoin Holders Resist Selling Amid Recent Highs — What This Signals
As Bitcoin flirts with its previous all-time highs, the celebrated ‘diamond hands’—a term in crypto parlance denoting long-term holders (LTHs)—are demonstrating notable restraint, selling their holdings at a rate notably lower than in previous bull markets.
According to a recent analysis by on-chain analytics firm Glassnode, despite the near ,000 valuation, the selling pressure from these seasoned investors remains subdued.
Bitcoin Diamond Hands Loyalty Amid Highs
The phenomenon of ‘diamond hands’ holding firm as Bitcoin reaches significant price levels is not new but remains a cornerstone of market stability.
These LTHs, defined by Glassnode as wallets holding Bitcoin for over 155 days, display investment maturity that underpins the market’s resilience.
Even with Bitcoin’s price hovering around ,722—down 3.5% over the past week but still up slightly by 0.6% in the last 24 hours—these investors are not rushing to cash out.
Additionally, Glassnode’s report highlights that long-term holders are yet to reach the point of selling that typically precedes a market downturn.
The market value to realized value (MVRV) ratio, a reliable metric to gauge the profitability of long-held Bitcoins, indicates that many LTHs are sitting on substantial unrealized profits. Historically, LTHs begin to sell once this ratio hits particular highs, which has not yet occurred despite the recent peak.

Interestingly, during the surge to ,800 in March—the latest all-time high—long-term holders were not the primary sellers. Glassnode pointed out that only a modest 519k BTC was sold by LTHs during this period, considerably less than in previous bull runs, where monthly sales approached nearly one million BTC.
Of this, 519k BTC sold, “20% originated from Grayscale ETF holders,” as reported by Glassnode. This restrained selling behavior is significant, suggesting a strategic approach to holding and a belief in further price appreciation.

The Future Holds Optimism
Moving forward, Glassnode anticipates that LTHs will continue to play a pivotal role in the market dynamics. Their recent behavior indicates a shift towards re-accumulation following significant distribution around the k all-time high.
Such patterns underscore a sophisticated strategy: Bitcoin’s most steadfast supporters may be gearing up for another run, anticipating higher peaks beyond current levels.
Amid these developments, crypto analyst Cryptorphic has forecasted Bitcoin reaching as high as 6,000 by May 2025, adding to the sentiment around Bitcoin, which remains interestingly bullish.
#Bitcoin could hit 6,000 by May 27 2025!
These green boxes represent the price action after #BTC halvings. We’ve never seen a red year after a halving.
Bitcoin halvings are significant events, here are the percentages of Bitcoin’s price increase one year after each halving… pic.twitter.com/QEmNN8OuP2— Cryptorphic (@Cryptorphic1) May 27, 2024
Featured image created with DALL·E, Chart from TradingView
Bitcoin Bulls Gain Breathing Room As Long-Term Holder Activity Eases – Glassnode
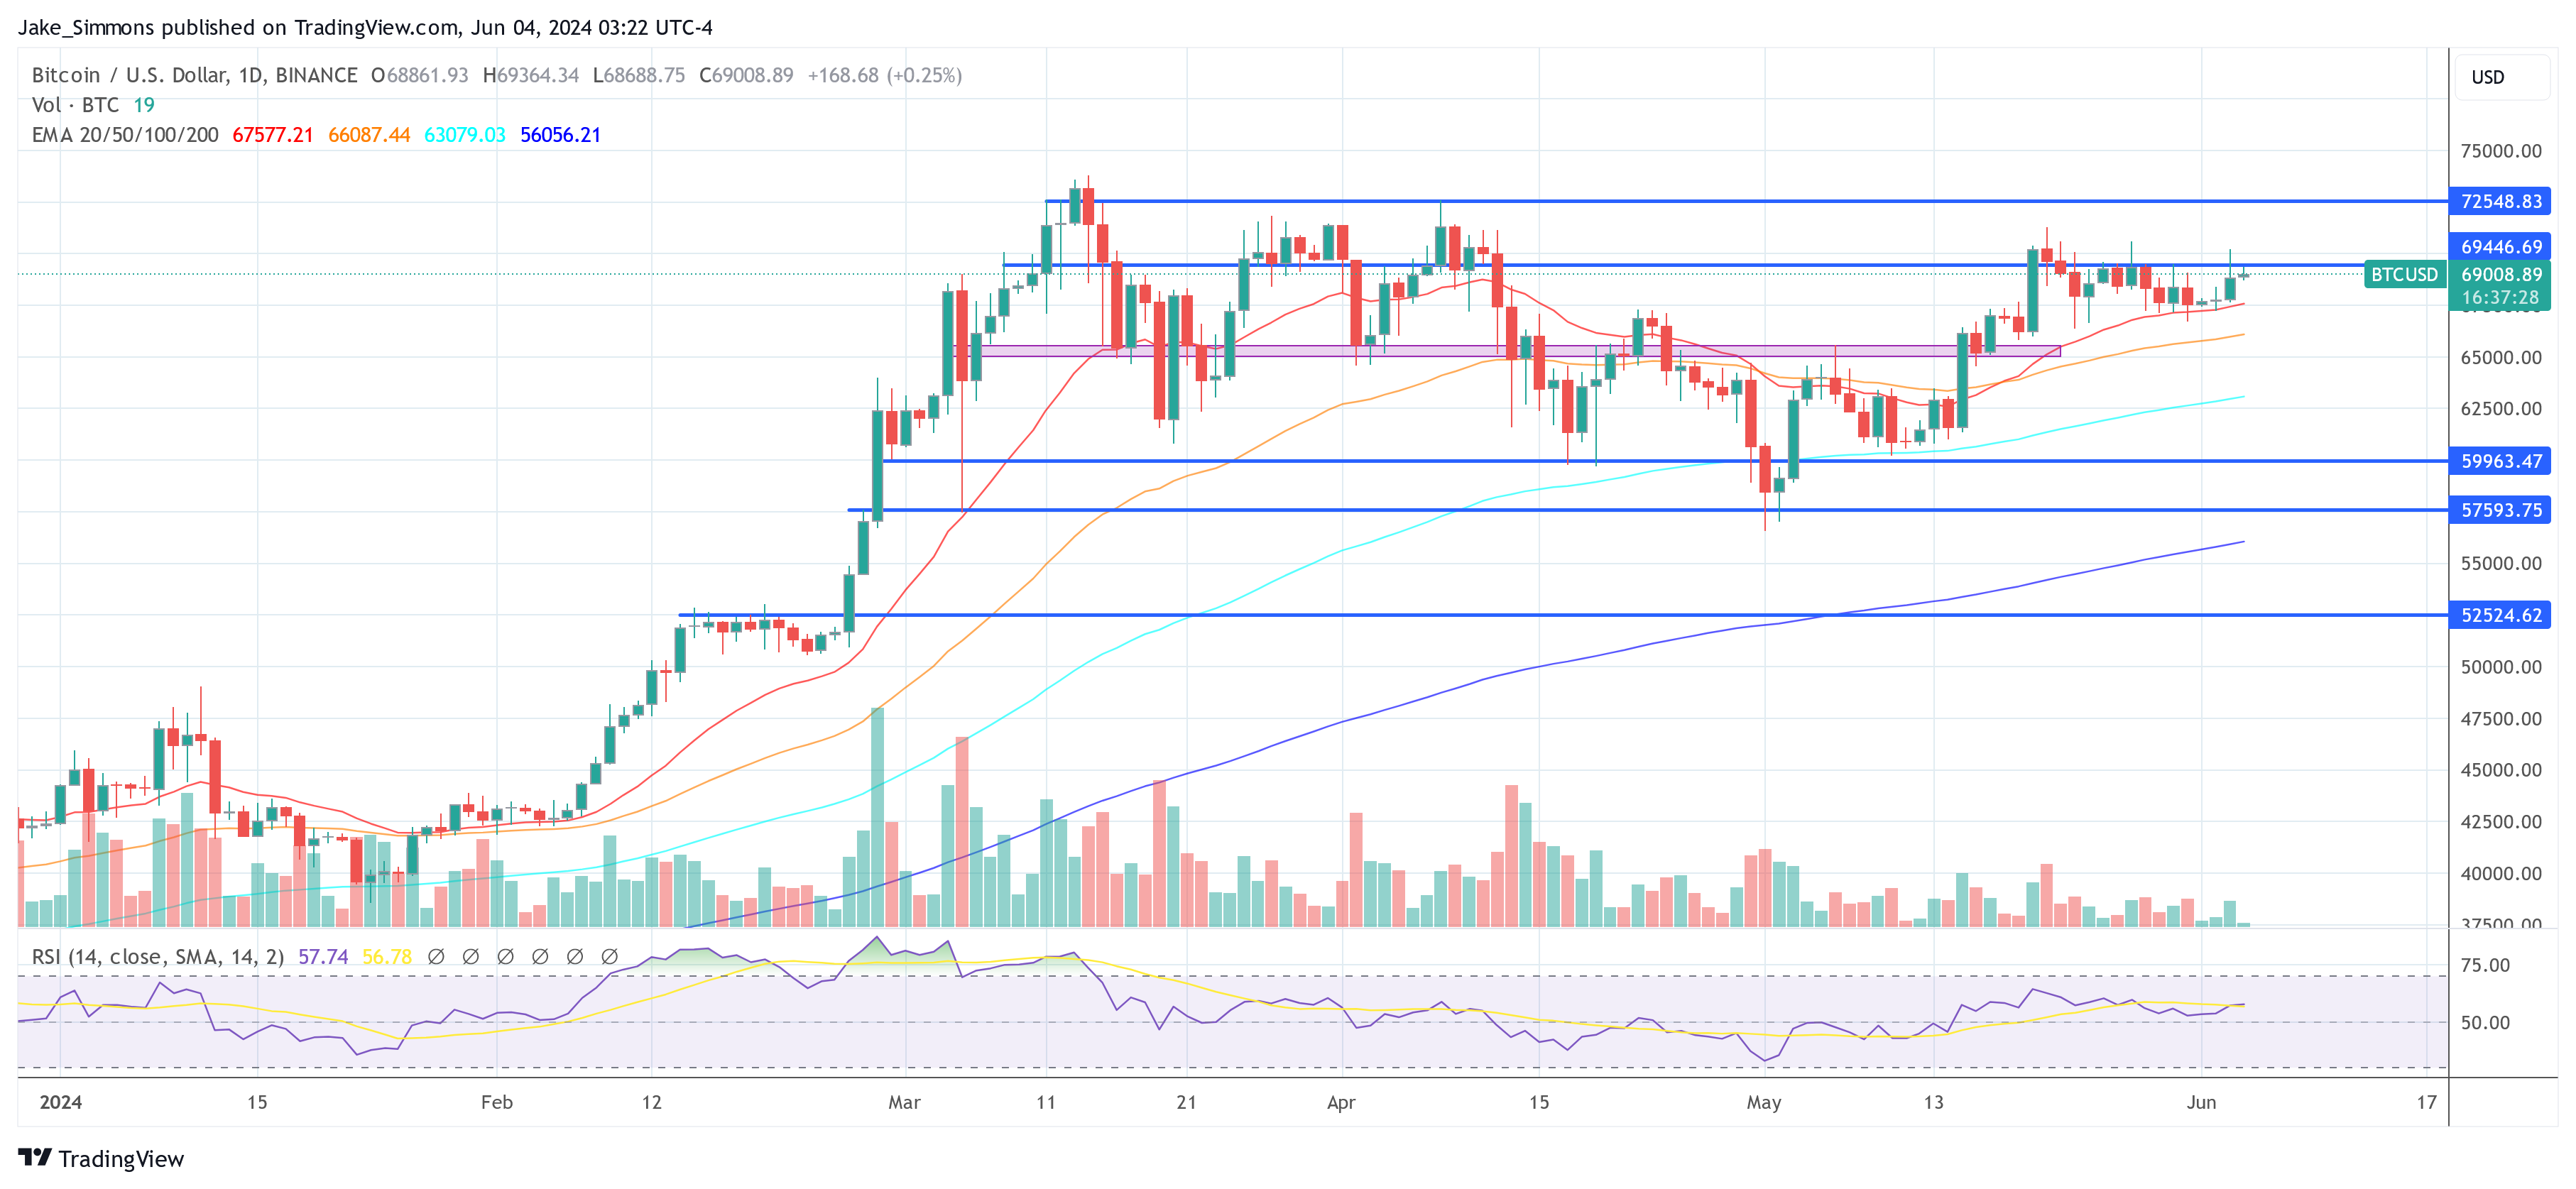
Bitcoin continues to dominate discussions, with its recent price movements drawing particular attention. As the asset struggles to reclaim its March all-time high of over ,000, with recent attempts peaking above ,000 earlier this week, the price has since receded to approximately ,231 at the time of writing.
This retracement marks a 7.3% drop from its March peak, signifying a volatile period for the cryptocurrency, influenced by various underlying market factors.
Long-Term Holders Lessen Selling, What This Spell For BTC
Glassnode, a renowned market intelligence platform, highlights a significant development in Bitcoin’s market behavior. According to a recent analysis of the platform, there has been a notable decline in the distribution pressure from Bitcoin’s long-term holders (LTHs).
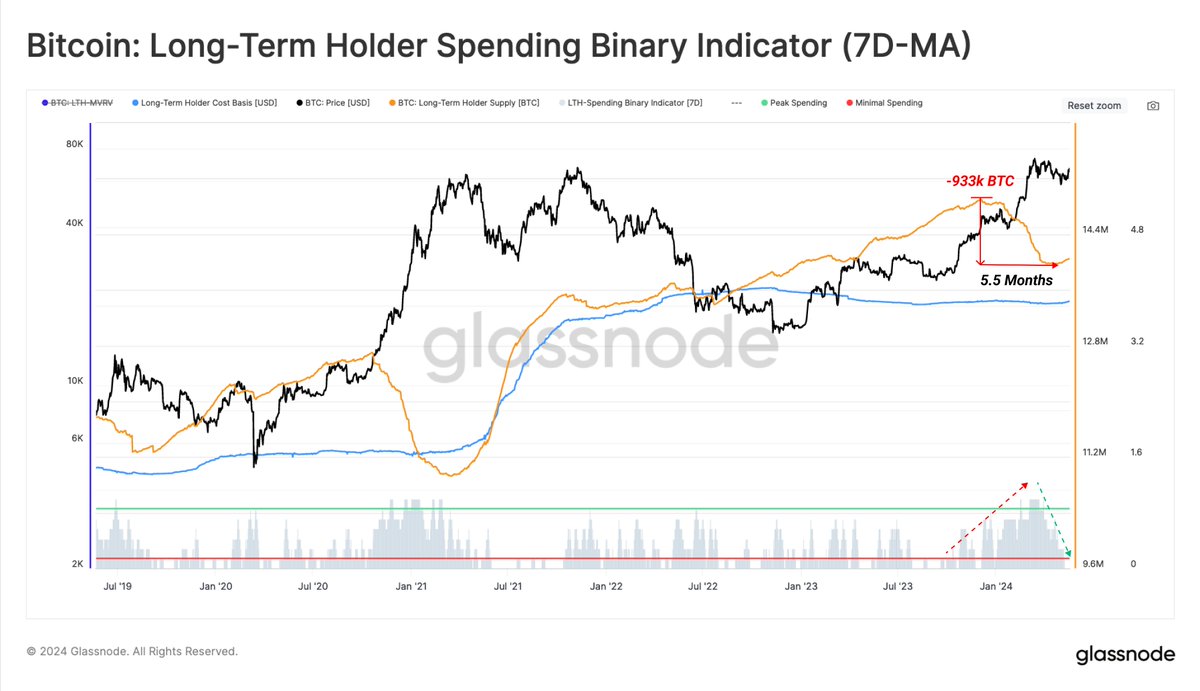
Glassnode’s “Long-Term Holder Binary Spending Indicator” tracks the sell-off activity of long-standing Bitcoin holders, and its recent data points to a marked reduction in this group’s selling pressure.
Historically, when long-term holders reduce their selling, it alleviates downward pressure on the price, potentially giving rise to more bullish market conditions.
Further insights into Bitcoin’s price behavior come from prominent crypto analyst RektCapital, who noted on social media platform X that Bitcoin typically faces resistance at the range high post-Halving and suggests a prolonged re-accumulation phase.
As the crypto asset trades just below ,000, RektCapital discloses that Bitcoin might only break out from its current re-accumulation range around 160 days post-Halving, projecting a significant breakout as late as September 2024. This analysis is crucial as it sets expectations for investors looking for signs of Bitcoin’s next big move.
Historically, Bitcoin has always rejected from the Range High on the first attempt at a breakout after the Halving
Moreover, history suggests this Re-Accumulation should last much longer
Bitcoin tends to breakout from these Re-Accumulation Ranges only up to 160 days after… https://t.co/Jw7FcQui2Q pic.twitter.com/beLdOPqZOi
— Rekt Capital (@rektcapital) May 24, 2024
Meanwhile, recent price action from Bitcoin has led to substantial losses for some traders, with Coinglass data showing about .68 million in liquidations for Bitcoin long traders and .34 million for short traders over the past 24 hours.
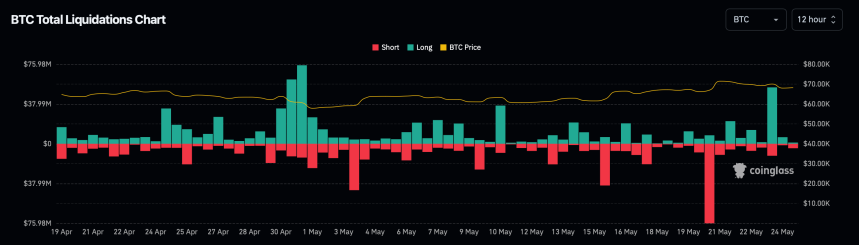
Overall, the crypto market has seen total liquidations amounting to 2.07 million during the same period, affecting 78,874 traders.
Upcoming Challenges For The Bitcoin Market
According to Greeks.Live, the imminent expiry of a significant volume of Bitcoin and Ethereum options adds another layer of complexity to the market’s immediate future. 21,000 BTC in options are set to expire soon, with a Put Call Ratio of 0.88 and a Maxpain point at ,000, representing a notional value of .4 billion.
Similarly, 350,000 ETH options are nearing expiration, and their dynamics could influence the broader market due to their .3 billion notional value and a Put Call Ratio of 0.58.
May 24 Options Data
21,000 BTC options are about to expire with a Put Call Ratio of 0.88, Maxpain point of ,000 and notional value of .4 billion.
350,000 ETH options are about to expire with a Put Call Ratio of 0.58, Maxpain point of ,200 and notional value of .3… pic.twitter.com/rftA9kBm4q— Greeks.live (@GreeksLive) May 24, 2024
In this context, a put option gives the holder the right to sell an asset at a predetermined price within a specific timeframe, which is often used as protection against a decline in the asset’s price.
Conversely, a call option offers the right to buy under similar conditions and is typically utilized in anticipation of a price increase. The Put Call Ratio is a tool that helps gauge market sentiment, with a higher ratio indicating a bearish outlook and a lower ratio suggesting bullish conditions.
Featured image created with DALL·E, Chart from TradingView
Bitcoin Long-Term Holders Buy The Blood, Snatch Up 70,000 BTC
Glassnode data has revealed that Bitcoin long-term holders are taking advantage of the cryptocurrency’s lower price to significantly increase their holdings. This accumulation further strengthens the belief that this group of Bitcoin investors anticipate a potential upside for Bitcoin despite its recent volatility.
Long-Term Holders Pay .3 Billion For 70,000 BTC
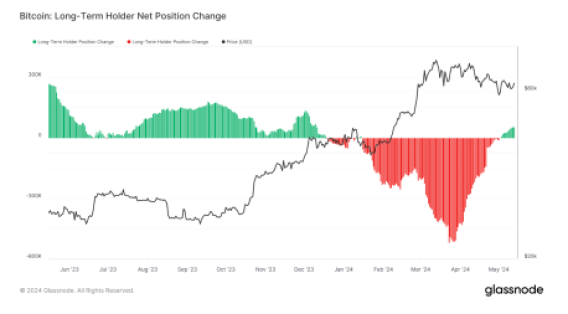
According to Glassnode, long-term Bitcoin holders who had previously sold 1 billion BTC in the latter part of 2023 are accumulating once again. This buying activity could be interpreted as a potential bullish signal for Bitcoin.
Traditionally, Bitcoin long-term holders sell their holdings during peak prices and buy new tokens during periods of correction or substantial declines. When these seasoned investors buy cryptocurrencies during market lows, it usually indicates their expectations of a potential rebound, leading to profits.
On the other hand, short-term holders are known to buy cryptocurrencies during sporadic price surges, often signaling that a cryptocurrency is nearing its peak.
With Bitcoin presently stabilizing above ,000, long-term Bitcoin holders probably see the cryptocurrency’s value as a prime buying opportunity. They have recently added a staggering 70,000 BTC valued at over .3 billion to their holdings.
This sentiment for Bitcoin’s potential rally is also shared by a few crypto analysts who have predicted that the cryptocurrency would surge to new all-time highs during the approaching bull market. Earlier in March, before Bitcoin’s halving event, the cryptocurrency skyrocketed above ,000, marking a new historic all-time high.
With the bull market still on the way, Bitcoin could see further upsides as market conditions improve and investor demand rises. This could potentially lead to profits for long term holders who had purchased the cryptocurrency earlier.
Moreover, the upcoming United States inflation report, set for release on May 15, could also be another primary factor driving long-term investors’ substantial BTC accumulation. With the US Consumer Price Index (CPI) remaining historically high, and the Federal Reserve (FED) unchanged rates, Bitcoin is seen as a possible hedge against inflationary pressures, protecting investors’ wealth against decline.
Bitcoin Whales Display Opposite Trend
Reports from blockchain analytics platform Santiment reveal that Bitcoin whales are showing an opposite trend from long-term holders.
The analytics platform noted that Bitcoin whales appear to be taking a break from accumulating BTC, as the number of large-scale transactions has been decreasing significantly.
This trend coincides with the cryptocurrency’s reduced on-chain activities and its declining value over the past few weeks.
Crypto analyst Ali Martinez has also shared a similar report, emphasizing that Bitcoin’s accumulation trend score is currently displaying a value closer to zero, indicating that larger investors were distributing their holdings rather than buying.
Despite the downtrend, Martinez has disclosed that Bitcoin’s current TD sequential is signaling a buying opportunity and the cryptocurrency was poised for a rebound soon. At the time of writing, the cryptocurrency’s price is trading below ,000, receiving a decrease of about 6.38% in the last month, according to CoinMarketCap.
Bitcoin Long-Term Holders Accumulating Like In 2021: Is BTC Ready For A 15X?
Bitcoin is moving sideways, posting drab price action, forcing participation to taper. But amid this consolidation and even fear of more losses, one analyst has shared data suggesting that long-term holders are accumulating at spot rates.
Are We Back To 2021? Bitcoin Long-Term Holders Accumulating
In a post on X, the analyst noted that this re-accumulating pace is picking up momentum, mirroring a welcomed trend that preceded the impressive 2021 bull run.
Therefore, if long-term holders, or HODLers, accumulate, the probability of BTC rallying in the sessions ahead is elevated. Thus far, BTC has been trending above ,000, up 10% from the May 2024 lows.
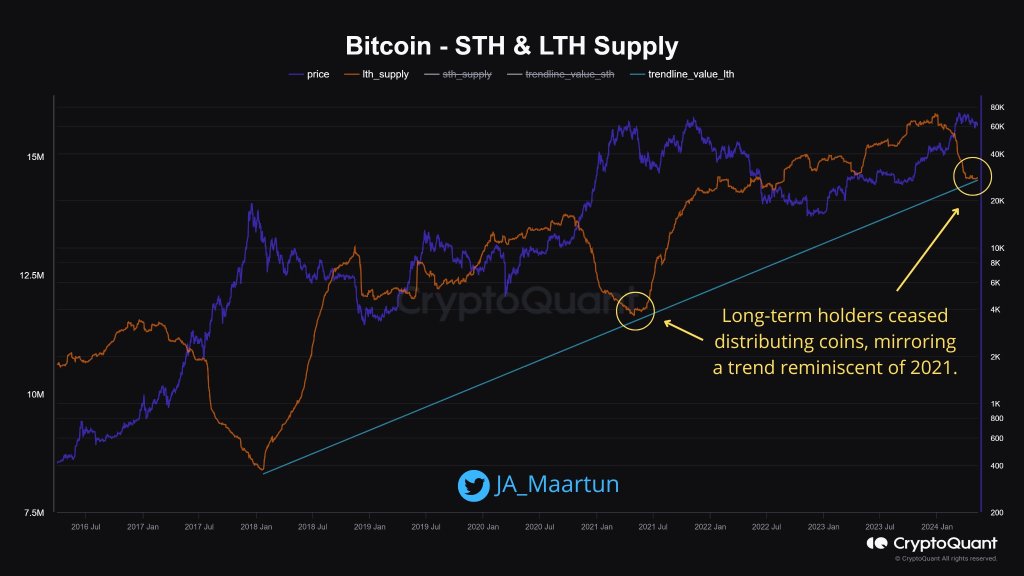
For clarity, the data shared by the analyst uses Unspent Transaction Outputs (UTXOs) to classify long-term and short-term holders. Analyzing the age of UTXOs makes it easier to gauge the behavior of different investor groups.
Usually, UTXOs older than 155 days have “diamond hands” or long-term holders. Meanwhile, those who hold BTC for less than 155 days are short-term holders or often classified as “weak” hands.
They are usually traders or speculators interested in riding on price volatility, like in the first half of Q1 2024.
When long-term holders stopped distributing BTC in 2021, prices rose sharply. By November 2021, the coin had peaked at around ,000, lifting prices by nearly 1,500% from 2020 lows. It is unclear if BTC is ready for another 15X surge from spot rates, a move that would propel it to over 0,000.
BTC Has Strong Support At ,000, Analyst Urges Patience
While the on-chain data paints a bullish picture, some analysts advocate caution. Taking to X, one analyst notes that Bitcoin has strong support at around the psychological ,000 mark. The coin could stabilize if bulls soak in selling pressure and reject attempts for lower lows.
However, if prices dump below ,000, triggered by a news event, BTC may fall to as low as the ,000 to ,000 zone.
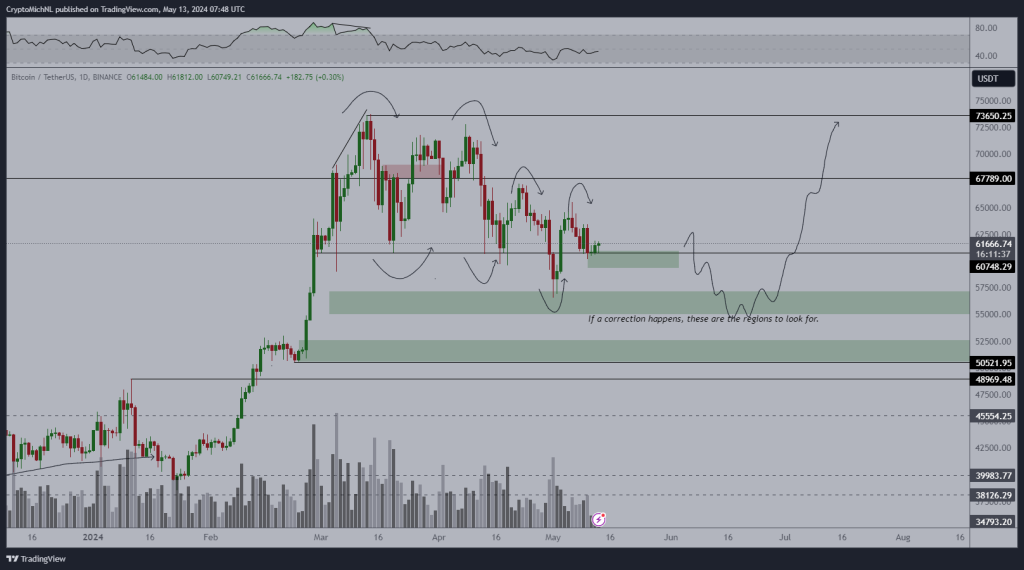
Despite the potential for short-term volatility, the analyst encourages investors to maintain a long-term perspective. Accumulating Bitcoin at these levels and exercising patience could be a winning strategy, the analyst says.
This preview would be especially true now that on-chain data shows that long-term holders are accumulating.
Before then, traders should watch price action. The coin is moving sideways, finding rejection at ,000. Even though prices are lower, the last day’s series of higher highs is encouraging and might spark demand.
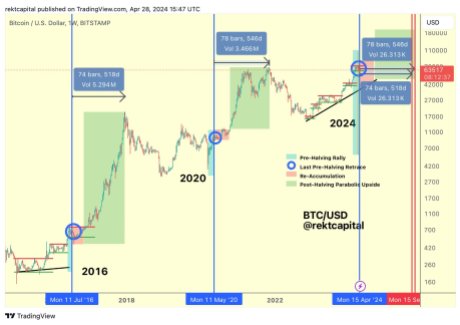
Bitcoin Long-Term Outlook: Analyst Foresees Peak In Late 2025
Following the fourth Bitcoin Halving, Rekt Capital, a popular cryptocurrency trader and expert, has offered a compelling narrative on the future trajectory of Bitcoin, predicting that the crypto asset could peak this bull cycle in the following year. Rekt Capital’s analysis emphasizes on the possibility that this current cycle could reiterate past Halving cycle trends, positioning BTC for significant gains in the coming months.
Bitcoin Could Mirror Past Halving Cycle
According to the analyst, Bitcoin reached its all-time high within 518 days following the Halving in the 2015–2017 cycle. Meanwhile, after the event in the 2019-2021 bull cycle, the digital asset topped out within 546 days. This suggests that the event has always catalyzed massive growth for the leading cryptocurrency asset.
Should the past trend hold, the next bull market top might happen between 518 and 546 days following the recently concluded fourth Halving, particularly around the middle of September or middle of October in 2025, according to Rekt Capital.
The analyst noted that in this cycle Bitcoin is accelerating by about 220 days currently. Thus, the longer time BTC consolidates after this Halving, it will be better for resynchronizing this current cycle with the previous events cycle.
Rekt Capital also noted that Bitcoin has experienced further declines in the three weeks after the Halving, according to historical data from 2016. He has labeled the period as the Post-Halving “Danger Zone,” this is where there is a chance of downside volatility at the range low of the Re-accumulation Range.
In 2016, approximately 21 days after the occurrence, Bitcoin saw a lengthy -11% decline before gaining momentum toward the upside. However, data for 2016 indicates that if there will be downside volatility in this cycle around the Re-Accumulation Range Low, it may happen during the following 15 days.
Although the post-Halving danger zone ends in 15 days, the 2016 data indicates that there may be some negative volatility in the interim, possibly reaching the ,600 Range Low.
Parabolic Phase For BTC
It is worth noting that Rekt Capital anticipates a parabolic phase after the re-accumulation phase is concluded. During this stage, Bitcoin usually sees massive growth leading all the way up to a new all-time high.
In the previous Halvings, Bitcoin would historically consolidate in this Re-Accumulation Range for up to 150 days before ultimately entering a parabolic phase. Once BTC breaks out of this re-accumulation stage, Rekt Capital expects BTC to see a parabolic upside by September this year if it consolidates within the aforementioned timeframe.
At the time of writing, BTC was down by over 5% in the past 7 days and was trading at ,504. Presently, its market cap is down by 1.53%, while its trading volume has increased by over 22% in the last 24 hours.
XRP Price Ready For 70% Breakout As Long-Term Consolidation Nears Its End
The XRP price has seen some level of recovery over the last two days that has seen positive sentiment returning to the latocin once again. This has carried forward with the expectation that the price will continue to surge. One crypto analyst in particular, who goes by RLinda, has revealed why the cryptocurrency is set to surge 70%.
XRP Price Completes A False Breakdown
In the analysis that was posted on the TradingView website, crypto analyst RLinda outlined a number of reasons why the XRP price may be getting ready for a surge. One of these reasons is the fact that the altcoin has completed a false breakdown.
This is referring to the price crash that sent the price falling from .7 to .42, recording an almost 50% crash. However, the crypto analyst believes that this crash was bullish for the coin as it was basically a false breakdown, followed by a breakout.
In scenarios such as this, the XRP price could be headed for a breakout similar to the breakdown and eventual recovery between August and November 2023. Such a case could see the price rise 50% with a higher end of 70%.
Additionally, the XRP price has also been in long term consolidation, another factor that could contribute to this breakout. “XRPUSDT is forming a technical false break of support, in the long term consolidation above the zone should be formed with the purpose of continuation of growth, the potential of which can be opened by 50-70%,” the analyst stated.
The State Of XRP
XRP has already seen investors returning once it was clear the worst of the crash. Crypto whales, in particular, have been making their bets, moving 600 million XRP tokens. As NewsBTC reported, whales holding between 10 million and 100 million XRP increased their holdings by 30 million in just one week. But even more interesting is the fact that they have moved up to 600 million tokens in the space of two weeks.
These moves come ahead of crypto analysts prediction major upside for the cryptocurrency. One of those is crypto analyst Egrag Crypto who predicted that the XRP price is ready to spike as high as .4. This would mean an over 100% increase in price.
However, XRP has not exactly been the market favorite in recent times. Its daily trading volume has seen a notable decline, with Coinmarketcap reporting a 20% drop to .33 billion in the last day. Nevertheless, the altcoin remains the 7th-largest in the space, with a market cap of .3 billion.