 Bitcoin’s price fell beneath the ,000 mark on Monday, declining over 6% against the U.S. dollar. At 1:30 p.m. EDT on June 24, the currency’s price hit an intraday low of ,809 per coin. Bitcoin Struggles Against Bearish Market, Slides to Near K Level This Monday proved tumultuous for bitcoin (BTC), as its price dipped […]
Bitcoin News
Ethereum Longs Crushed! Who Got Burned In The $62 Million Fire Sale?
Ethereum (ETH) bulls got a taste of fire on June 11th as the altcoin’s derivatives market witnessed a dramatic surge in long liquidations. According to data from Coinglass, this event marked the highest level of long liquidations since May 23rd, signifying a significant correction for traders who bet on rising prices.
Crimson Chart: Long Positions Liquidated
Overconfident investors piled into long positions, essentially placing a wager that Ethereum’s price would climb. However, the market had other plans. An unexpected price drop sent shivers down the spines of these bulls, triggering a wave of liquidations.
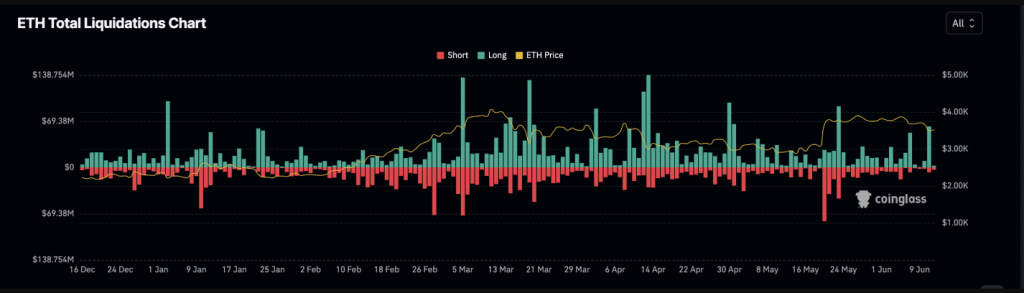
As the price dipped below a certain threshold set by the exchange (known as the margin requirement), these positions were forcefully closed to prevent further losses for the unfortunate traders. The result? A collective sigh of relief for some exchanges, but a hefty bill for liquidated bulls, totaling over million on that fateful day.
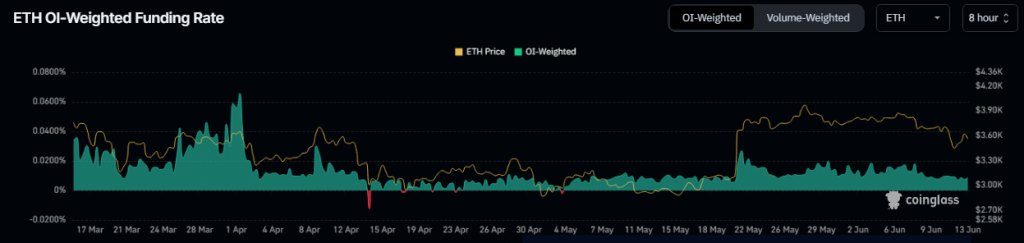
Positive Funding Rate Offers A Glimmer Of Hope
While the market correction sent shockwaves through the Ethereum derivatives landscape, a silver lining emerged in the form of a positive Funding Rate. This metric essentially reflects the fees paid by traders holding short positions (betting on a price decline) to those holding long positions.
In simpler terms, a positive Funding Rate indicates a stronger demand for long positions, suggesting that even amidst the carnage, some investors remain optimistic about Ethereum’s long-term prospects. This positivity is further bolstered by the fact that ETH’s Funding Rate hasn’t dipped into negative territory since May 3rd.
A Temporary Hiccup?
The jury’s still out on whether this event represents a fleeting blip or a more concerning trend. While the positive Funding Rate offers a glimmer of hope, the significant drop in derivatives activity paints a different picture.
The past 24 hours have seen a worrying decline in both options trading volume (down 50%) and Open Interest (total outstanding contracts, down 2%). This suggests a potential flight from the market, with fewer participants actively trading options contracts or holding open positions.
Ether Price Forecast
Meanwhile, the current Ethereum price prediction by CoinCodex suggests a 2.46% rise to ,636 by July 13, 2024. Despite this positive outlook, the market sentiment remains bearish. The Fear & Greed Index stands at 70 (Greed), indicating strong investor interest.
Over the last 30 days, Ethereum has shown significant volatility, with positive gains on 53% of the days and an overall price fluctuation of 8.63%. While the short-term forecast is optimistic, the mixed signals highlight the need for cautious investment given the current market unpredictability.
Featured image from SignatureCare Emergency Center, chart from TradingView
Bitcoin Dips Below $70K, Reaches $68,450 Low, $86M in BTC Longs Liquidated
 The price of bitcoin fell on Friday afternoon after spending several days above the ,000 mark. The value dropped to ,450 on Bitstamp, currently down ,700 from its intraday high. Bitcoin’s Sudden Drop Impacts Entire Crypto Economy Wipes Out 4M in Longs Bitcoin (BTC) plummeted to a low of ,450 per unit after reaching the […]
Bitcoin News
Ethereum Bloodbath: Over $55 Million In Longs Liquidated As Price Plummets
The recent price action of Ethereum has not been so much of a breeze. The second-largest cryptocurrency by market cap experienced a surge that nearly reached its all-time high, only to be met with a sharp reversal, leaving long traders licking their wounds.
Bulls Take A Hit, But Sentiment Remains Positive
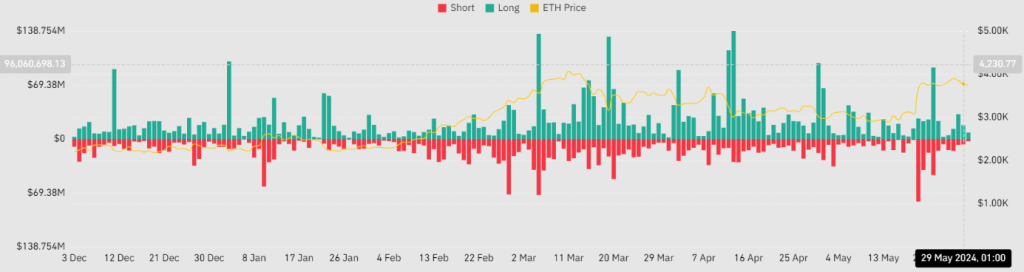
The past few days have seen a significant decline in Ethereum’s price, dropping from ,880 to around ,735. This has resulted in substantial liquidations for long traders, exceeding million in the last three days compared to only million for short positions.
Despite the dip, technical indicators paint a bullish picture. The price remains above the short moving average, and the Relative Strength Index (RSI) sits comfortably above 60, suggesting a strong underlying trend.
The funding rate, which reflects the cost of borrowing and lending cryptocurrency, provides further evidence of bullish sentiment. It has remained positive, currently at 0.014%, suggesting that buyers are still dominant and expect the price to rise further.
Open Interest Soars, Signaling Sustained Investor Interest
While the price has dipped, investor interest in Ethereum remains robust. Open Interest, which reflects the total amount of outstanding futures contracts, reached a peak of billion on May 28th, the highest level in over a year. This indicates that despite the recent volatility, investors are still heavily engaged with Ethereum and believe in its long-term potential.
Ethereum Price Forecast
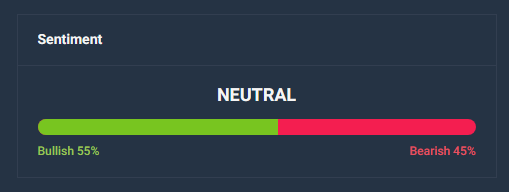
Meanwhile, Ethereum’s current price prediction of ,940 by June 30th suggests a potential 2% increase. While the technical indicators remain neutral, the high Fear & Greed Index of 73 indicates a prevailing sense of greed among investors. This could fuel further price movement in the short term.
Looking at the recent performance, Ethereum has experienced a moderate amount of volatility with 57% green days over the past month. This suggests a potential for continued upward momentum, especially considering the significant price increase since the cycle low of 7. However, it’s important to remember that the market is dynamic, and corrections can occur even in bullish environments.
Related Reading: Political Memecoin Mania: Super Trump Token Explodes With 200% Surge
Overall, the technical analysis paints a mixed picture for Ethereum. While the neutral sentiment and recent price dip might raise some concerns, the high Fear & Greed Index and strong performance since the cycle low suggest potential for further growth.
Featured image from Pexels, chart from TradingView
Bulls In Control: Ethereum Longs See Biggest Candle Ever After ETF News
Data suggests users on Binance responded to the Ethereum exchange-traded fund (ETF) news by aggressively longing the cryptocurrency.
Ethereum Net Taker Volume On Binance Has Just Seen Its Biggest Candle Ever
As explained by CryptoQuant community manager Maartunn in a post on X, the Ethereum Net Taker Volume has observed a sharp increase after rumors have surfaced that the ETH spot ETFs have a renewed chance of gaining approval.
The “Net Taker Volume” here refers to an indicator that keeps track of the difference between the ETH taker buy and taker sell volumes on any given centralized exchange.
When the value of this metric is positive, it means that the taker buy or long volume is outpacing the taker sell or short volume on the platform right now. Such a trend implies a bullish sentiment is dominant among the investors.
On the other hand, the indicator being negative suggests the presence of a majority bearish mentality among the users of the exchange as the shorts are outpacing the longs.
Now, here is a chart that shows the trend in the Ethereum Net Taker Volume on the cryptocurrency exchange Binance over the last few years:
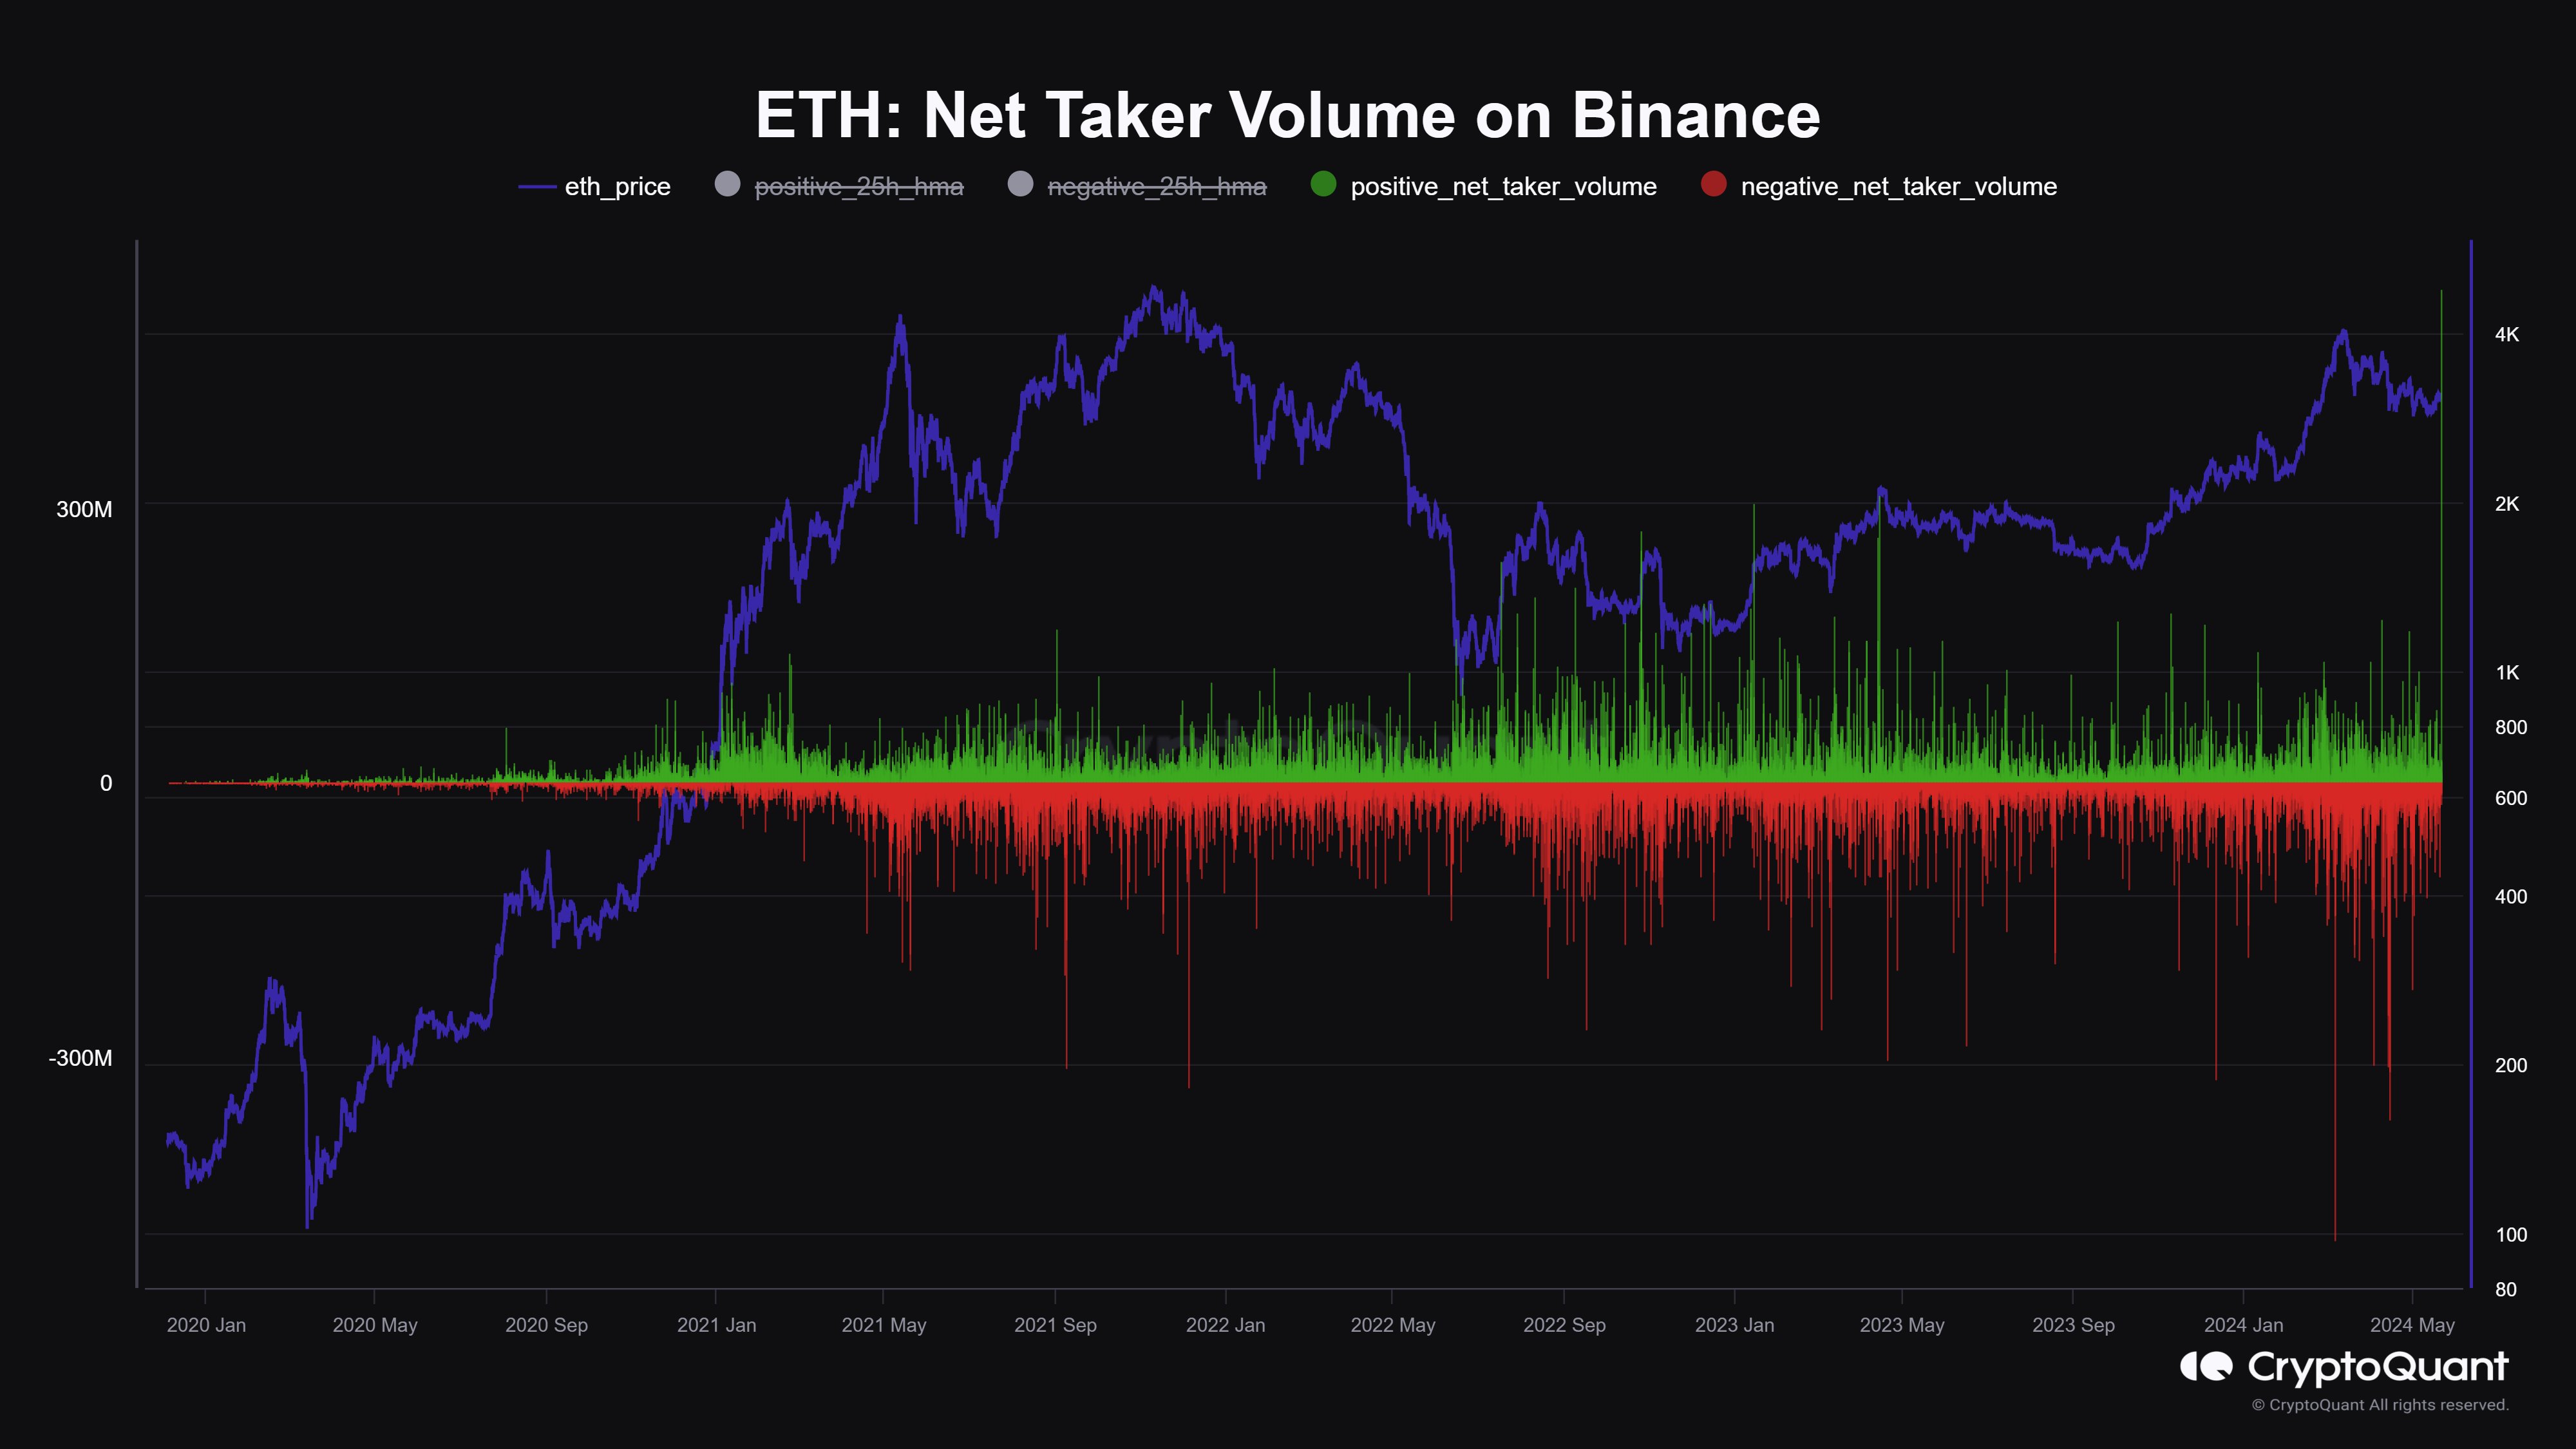
As displayed in the above graph, the Ethereum Net Taker Volume on Binance has just registered a huge positive spike, the implying investors have just opened a large amount of longs on the platform.
More specifically, the indicator’s value during this spike has been 0 million, which, according to the analyst, is the single largest spike the cryptocurrency has ever seen.
“Binance-traders are longing the Ethereum ETF-news like there is no tomorrow,” notes Maartunn. This isn’t particularly surprising, considering the market is very well aware what a spot ETF could mean for the asset after having witnessed what went down for Bitcoin.
The ETF news pre-approval had been bullish for BTC and while the approval itself had initially led to bearish price action, it eventually paid off for the asset as capital started rapidly flowing in through these investment vehicles and the coin enjoyed a rally that led to a new all-time high (ATH).
In another X post, the CryptoQuant analyst pointed out that the Ethereum Open Interest has shot up as well. The “Open Interest” measures the total amount of ETH-related positions that are currently open on all derivative exchanges.
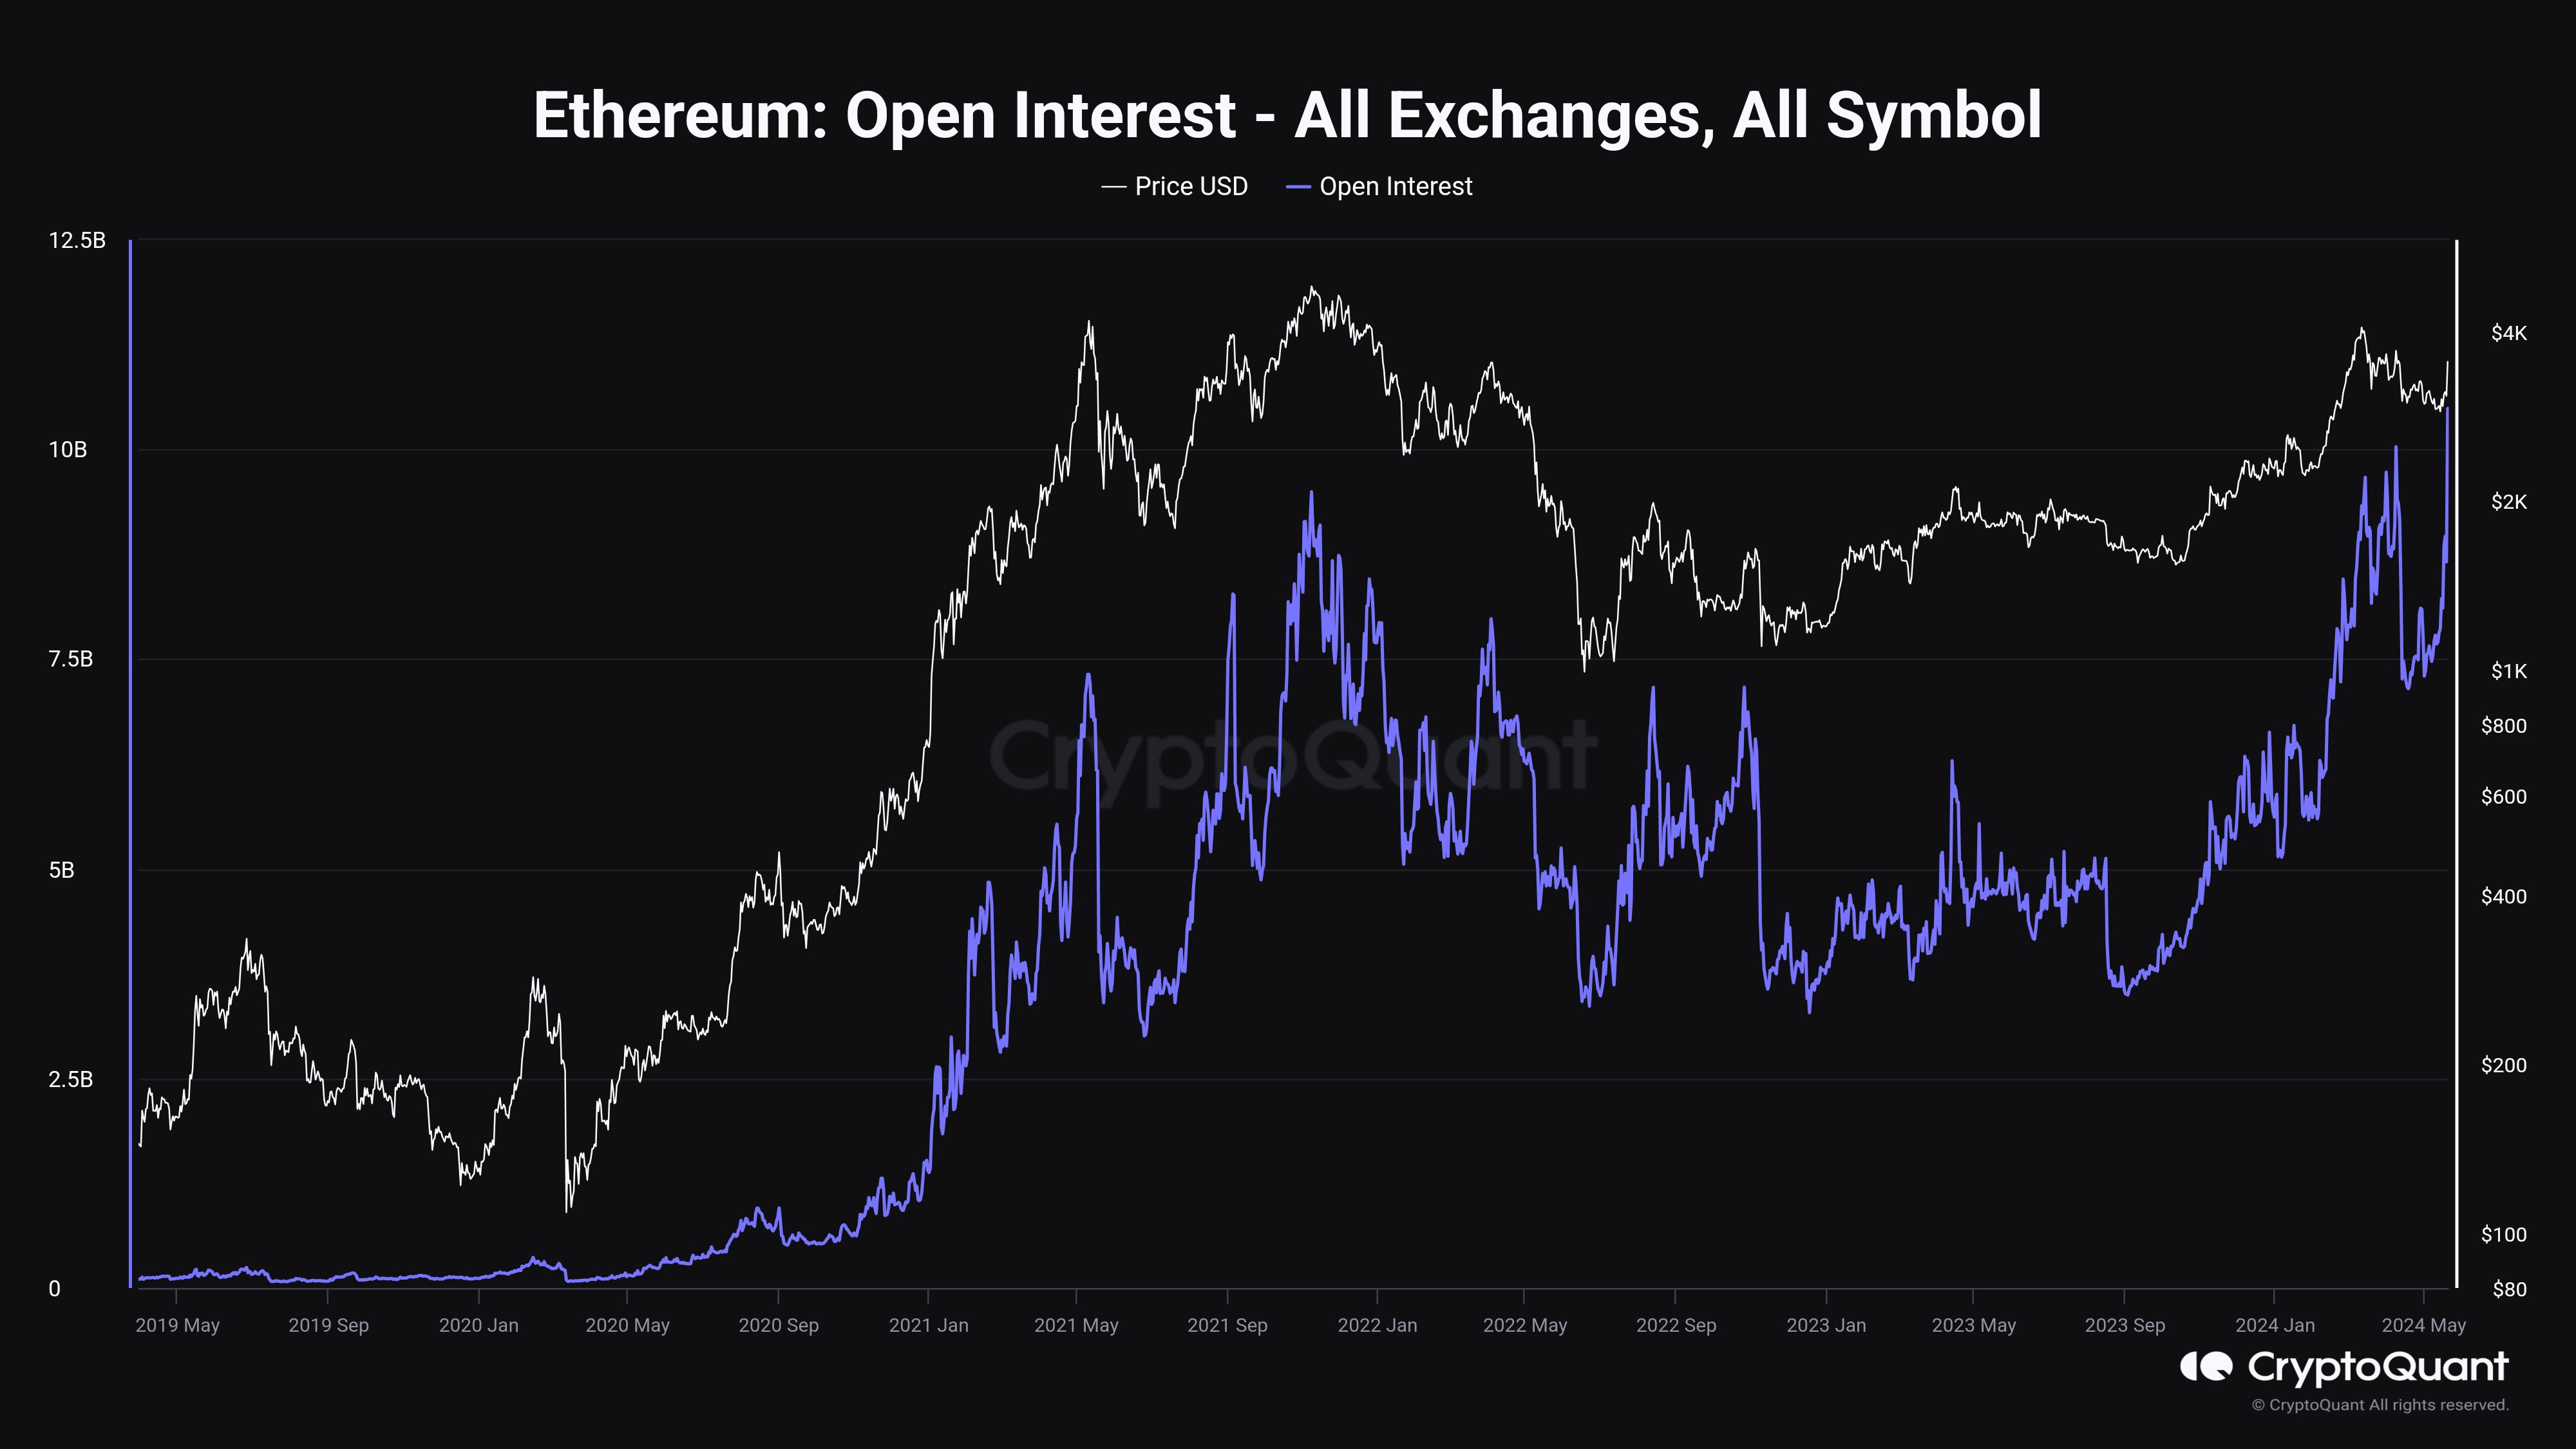
This trend isn’t that unexpected, given that derivatives users have been opening a large amount of longs for the asset. With this rapid surge, the Ethereum Open Interest has managed to set a new ATH.
Historically, intense speculation has generally led to more volatility for the coin, as the risk of large liquidations happening can become high in such periods. As such, this Open Interest spike may signal some turbulent times ahead for Ethereum.
ETH Price
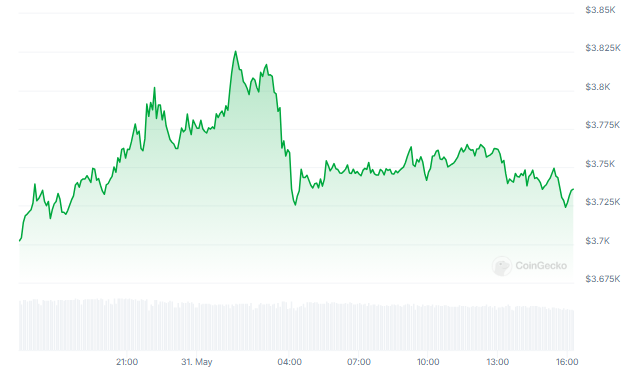
So far in the rally fueled by the ETF news, Ethereum has managed to break past the ,800 level, which is a milestone the coin hadn’t achieved since mid-March.
BTC Price Down 2%, Triggering Liquidation of Over $34M in Bitcoin Longs in Derivatives Shake-Up
 On May 9, 2024, bitcoin’s value faced a decline, hitting an intraday low of ,634 at approximately 7 a.m. EDT. The latest downturn has led to the liquidation of about .79 million in bitcoin long positions across various derivatives markets. As Bitcoin’s Value Declines, Heavy Liquidations Follow Bitcoin is facing challenges on Thursday, with its […]
Bitcoin News
Massive Bitcoin Market Turbulence Triggers $4,500 Crash; $167M in BTC Longs Erased in 1 Hour
 The price of bitcoin continued to decline over the weekend, dropping an additional 7.7% in the last 24 hours. It plummeted to a daily low of ,384 per coin, prompting a significant wave of leveraged liquidations on Saturday. Bitcoin Value Declines Amid Market Instability; Extensive Liquidations Reported By 4:00 p.m. Eastern Time on Saturday, bitcoin’s […]
Bitcoin News
$113 Million In Longs Get Rekt As Bitcoin Plunges Back To $34,000
Data shows the cryptocurrency longs have taken a beating today because of the plunge towards ,000 that Bitcoin has observed.
Cryptocurrency Futures Market Has Seen Liquidations Totaling 7 Million Today
According to data from CoinGlass, a large amount of liquidations have taken place in the cryptocurrency futures market during the past day. “Liquidation” here refers to a forced closure of a futures contract being done by the derivative contract with which said position is open.
A contract is liquidated when it amasses losses equal to a certain percentage of the margin (that is, the initial collateral that the holder had put forth when opening the contract).
As it’s easy for traders’ bets to fail during volatile periods, it’s not surprising that the volatility from the past day has induced liquidations throughout the market. The below table shows the data for the liquidations that have occurred in the sector during the last day.
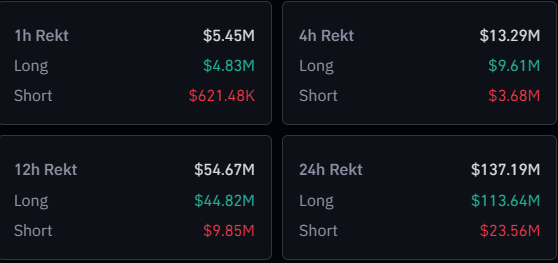
As you can see, the cryptocurrency futures market has seen liquidations amounting to about 7 million in the past day. Out of these, around 3 million of the contracts were long positions.
This means that more than 82% of the liquidation flush in this period has involved the long holders. This is consistent with the price action, as most of the liquidations have been triggered by a plunge in the Bitcoin price from above ,400 to the ,000 mark.
Such large liquidation events are popularly called “squeezes.” Since the squeeze from the last 24 hours has seen the longs on the losing side, the event was a “long squeeze.”
As the below table displays, Bitcoin-related contracts have unsurprisingly contributed the most towards this latest squeeze.
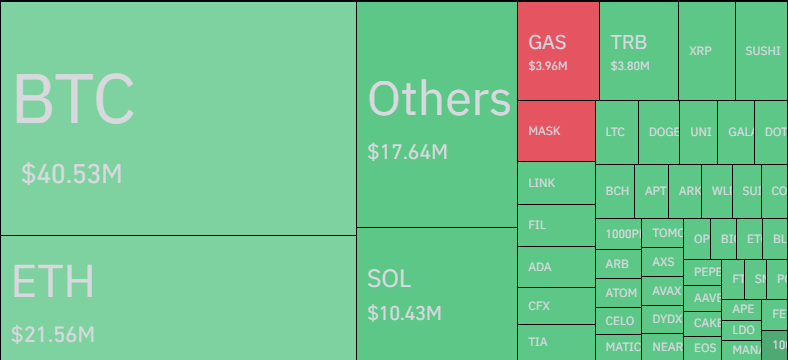
Bitcoin saw million in futures liquidations, while Ethereum registered almost half of those at million. Out of the altcoins, Solana (SOL) observed the highest liquidations.
SOL has seen a bit of an explosion recently, so it’s not unexpected that it has attracted a large amount of speculators towards it. As a natural consequence of this higher interest in the cryptocurrency, its liquidations have been more than the other altcoins.
Mass liquidation events like today’s aren’t exactly a rare occurrence in the cryptocurrency sector, due to extreme amounts of leverage being easily accessible and the volatility that most of the coins witness on the regular.
It would appear that today’s liquidation squeeze has been unable to put off speculators, as the Bitcoin open interest (a measure of the total amount of contracts open on the futures market) is still at high values.
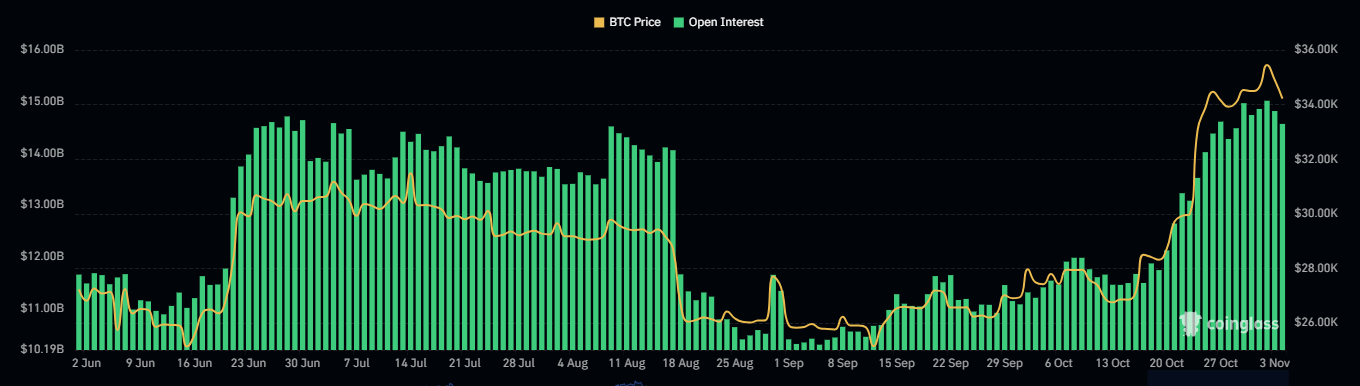
As such, it’s possible that Bitcoin will see more volatility in the near future and with it, another liquidation squeeze.
Bitcoin Price
Following its drop of more than 3%, Bitcoin is now trading around the ,200 level.
Bitcoin Longs Could Precipitate Plunge To $28,000, This Chart Urges Caution
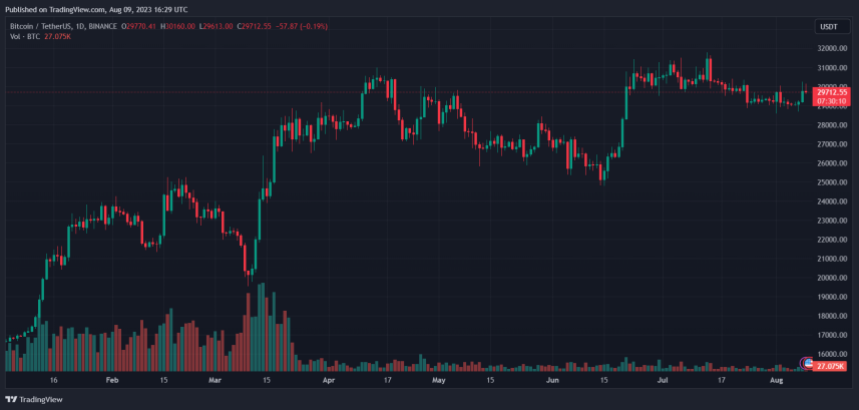
After a week of moving sideways, the Bitcoin price is finally experiencing some action; bulls are pushing for the most immediate critical resistance. The increasing uncertainty in the macroeconomic landscape supports the spike in price action, but optimist operators might have been too fast at jumping to their positions.
As of this writing, Bitcoin trades at ,700 with sideways movement in the last 24 hours and a 2% profit over the past week. Other cryptocurrencies in the top 10 are experiencing similar price action, but Solana stands out with a 6% profit on similar timeframes.
Why Is The Bitcoin Price Up Today, But Could Be Down Tomorrow
All eyes are set on tomorrow’s US Consumer Price Index (CPI) data, the proxy to gauge inflation in this country’s fiat currency. A recent report highlights positive expectations for this event, as most investors expect inflation to continue its decline.
This might allow the Federal Reserve (Fed) to slow down on its interest rates hike program, finally giving Bitcoin room to break and flip ,000 into support. However, the report notes that any surprises could trigger the opposite effect.
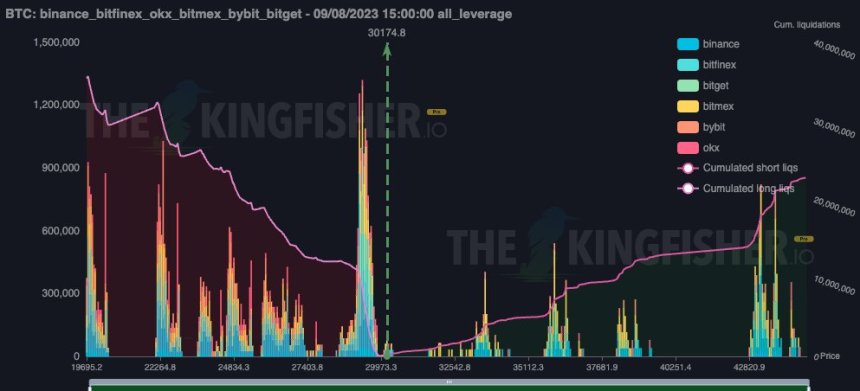
In this scenario, data from crypto analyst firm The King Fisher shows a concentration of long liquidity sitting between the ,000 to ,000 levels. As seen in the chart below, this liquidity could operate as a magnet erasing BTC’s gain and pushing it into support.
Conversely, positive CPI data could have little to no impact on BTC, allowing it to continue in its current range. As NewsBTC
Analyst Keith Alan from Material Indicators believes Bitcoin bulls are fighting to regain control over the 50-day moving average (MA). While the analyst expects bullish momentum could weaken, a push into the region around ,200 to ,000 is likely. Alan stated:
That doesn’t mean we can’t see a push to the .2k – .5k range today. In fact I think there’s a good chance we could see that, and if we do, I’ll take some more profit on my scalp. What I’m watching for is where we close today and were bid liquidity comes in as local support.
Cover image from Unsplash, chart from Tradingview
Why Ethereum Price Longs Might Profit Ahead Of “The Merge”
Ethereum price is close to reclaiming the area lost during yesterday’s downside action while Bitcoin slowly crawls back into ,000. The second cryptocurrency by market cap is about to experience a major event with high potential to operate as a bullish catalyst, “The Merge”.
At the time of writing, Ethereum price trades at ,570 with a 3% profit over the past week. As Bitcoin was pushed down by a fresh leg down, market participants see ETH as the potential savior of the sector.
ETH’s price moving sideways on the 4-hour chart. Source: ETHUSDT Tradingview
Will Bulls Or Bears Take Control Of The Ethereum Price?
Due to its importance, many experts are speculating about the potential for “The Merge”, the transition from Proof-of-Work (PoW) to Proof-of-Stake (PoS), to support a relief rally in the market. Others believe the event will operate as a “Buy the rumor, sell the news event”.
The latter often happens when there is a widely expected event in the sector which leads to a rally followed by a sudden crash shortly after the hype dissipates. Next week, the U.S. Federal Reserve will publish its Consumer Price Index (CPI) print, a metric used to measure inflation.
Economist Alex Krüger claims the CPI print might provide support for risk-on assets to rally. In the past, cryptocurrencies have trended to the upside after this event. Together with “The Merge”, Ethereum price seems poised for upside volatility. The expert said on the potential set-up for ETH traders:
If trading $ETH directionally for the merge probably want to go long into the event with stops right above the August lows and shoot for a 1700 break to take the price into the 1800-2100 range.
Whether ETH’s price can sustain the bullish momentum post “Merge”, Krüger believes that this will depend on the strength of the price action. If Ethereum can run hot into the event, the price might be able to flip key resistance levels into support.
Can “The Merge” Trigger A New Crypto Bull Run?
Despite its importance, Krüger believes “The Merge” might be unable to push the crypto market into price discovery. Legacy financial markets are trending downside, alongside cryptocurrencies. This is the most important overhead resistance only a couple of days before this event. Krüger added:
Fundamentally the merge improves ETH attractiveness via lower energy consumption and more importantly vastly improved tokenomics (…). That is highly likely not enough to kickstart a bull market by itself. Need a bull market in equities for that. To me the idea of $ETH decoupling is what I call a pipedream.
If equities bounce with the CPI print, crypto will find further support. However, macro conditions might continue to remain unfavorable for the rest of 2022 as hinted by Fed Chair Jerome Powell.
Presenting an opposite thesis, in the video below, our Editorial Director Tony Spilotro looks into the current market conditions and why a decline in Bitcoin dominance might hint at a new Altcoin Season. This could have positive implications for Ethereum price heading into “The Merge”. Take a look.