 As the value of cryptocurrencies has risen, the non-fungible token (NFT) market has experienced a 35.14% increase in sales compared to the preceding week. This marks the third consecutive week of sales growth in the NFT sector, with NFTs based on Bitcoin leading the charge throughout this period. NFT Sales Surge Past 2 Million in […]
Bitcoin News
XRP Price Prediction: Bulls Take Hit But This Level Could Trigger Another Increase
XRP price started a downside correction from the .580 resistance. The price could start a fresh rally unless there is a close below the .535 support.
- XRP is struggling to clear the .5650 and .580 resistance levels.
- The price is now trading above .535 and the 100 simple moving average (4 hours).
- There is a key bullish trend line forming with support at .5350 on the 4-hour chart of the XRP/USD pair (data source from Kraken).
- The pair could start a fresh rally unless there is a close below the .535 support.
XRP Price Dips To Key Support
In the past few days, XRP price recovered higher from the .520 zone. There was a move above the .535 and .550 resistance levels. However, the bears remained active near the .580 resistance and protected more upsides, like Bitcoin and Ethereum.
The recent high was formed at .5792 before there was a downside correction. There was a move below the .550 level. The price even tested the .535 support. A low is formed near .5322 and the price is now consolidating losses.
Ripple’s token price is now trading above .535 and the 100 simple moving average (4 hours). There is also a key bullish trend line forming with support at .5350 on the 4-hour chart of the XRP/USD pair. On the upside, immediate resistance is near the .5550 zone. It is close to the 50% Fib retracement level of the downward move from the .5793 swing high to the .5322 low.
The first key resistance is near .5620 or the 61.8% Fib retracement level of the downward move from the .5793 swing high to the .5322 low, above which the price could rise toward the .580 resistance. A close above the .580 resistance zone could spark a strong increase.
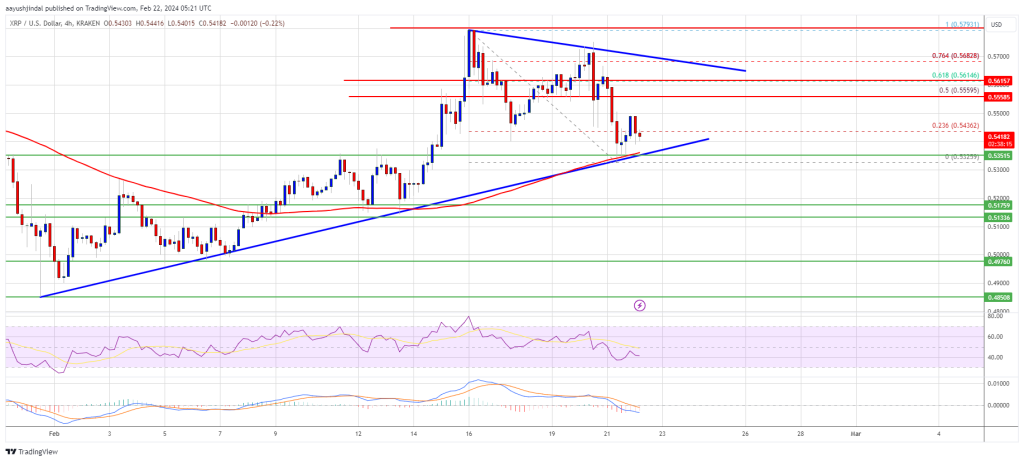
Source: XRPUSD on TradingView.com
The next key resistance is near .600. If the bulls remain in action above the .600 resistance level, there could be a rally toward the .620 resistance. Any more gains might send the price toward the .650 resistance.
Another Decline?
If XRP fails to clear the .5550 resistance zone, it could start another decline. Initial support on the downside is near the .535 zone and the trend line.
The next major support is at .5220. If there is a downside break and a close below the .5220 level, the price might accelerate lower. In the stated case, the price could retest the .480 support zone.
Technical Indicators
4-Hours MACD – The MACD for XRP/USD is now losing pace in the bearish zone.
4-Hours RSI (Relative Strength Index) – The RSI for XRP/USD is now below the 50 level.
Major Support Levels – .535, .522, and .480.
Major Resistance Levels – .555, .565, and .580.
Bitcoin Mining Company Phoenix Group Reports 50% Net Income Increase and 20% Sales Growth
 After its oversubscribed initial public offering (IPO), Phoenix Group, a Dubai-based company specializing in bitcoin mining and blockchain infrastructure, has announced a significant 50% increase in net income. The firm further revealed a 20% increase in its annual sales compared to the previous year. Dubai Bitcoin Miner Phoenix Group Records Substantial Increase in Year-on-Year Sales […]
Bitcoin News
Bitcoin Price Aims Higher, Decoding Key Hurdles To Fresh Increase
Bitcoin price is consolidating above the ,250 support zone. BTC could start a decent increase if it clears the ,000 and ,400 resistance levels.
- Bitcoin price failed again to clear the ,400 resistance zone and corrected lower.
- The price is trading below ,000 and the 100 hourly Simple moving average.
- There is a major rising channel forming with support at ,400 on the hourly chart of the BTC/USD pair (data feed from Kraken).
- The pair could continue to decline if there is a clear move below the ,250 support.
Bitcoin Price Holds Support
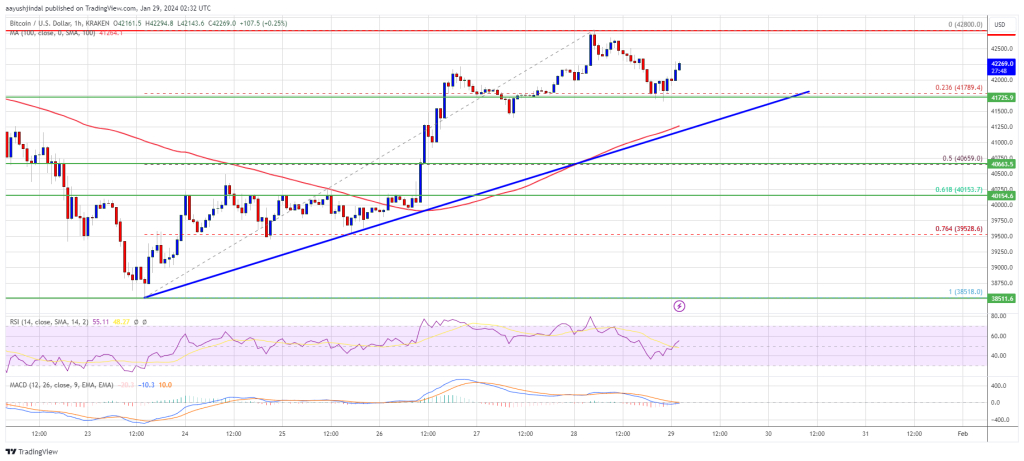
Bitcoin price made another attempt to clear the ,400 and ,500 resistance levels. However, BTC struggled to extend its gains and recently started another decline below ,000.
There was a move below the ,800 support. A low is formed near ,320 and the price is now consolidating losses. There is also a major rising channel forming with support at ,400 on the hourly chart of the BTC/USD pair.
Bitcoin is now trading below ,000 and the 100 hourly Simple moving average. Immediate resistance is near the ,900 level. It is near the 50% Fib retracement level of the downward wave from the ,489 swing high to the ,320 low.
The next key resistance could be ,200 and the 76.4% Fib retracement level of the downward wave from the ,489 swing high to the ,320 low, above which the price could start a decent increase.
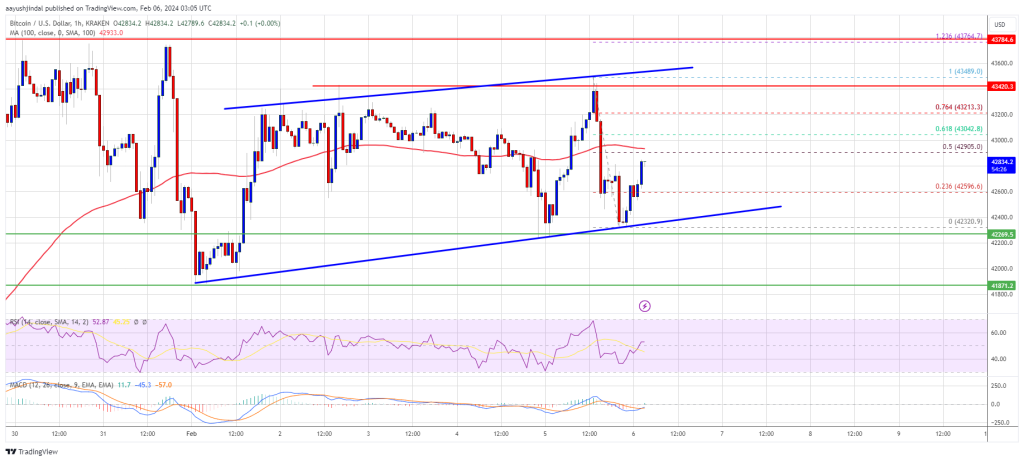
Source: BTCUSD on TradingView.com
The next stop for the bulls may perhaps be ,500. A clear move above the ,500 resistance could send the price toward the ,000 resistance. The next resistance is now forming near the ,200 level. A close above the ,200 level could push the price further higher. The next major resistance sits at ,000.
Downside Break In BTC?
If Bitcoin fails to rise above the ,000 resistance zone, it could start another decline. Immediate support on the downside is near the ,320 level.
The first major support is ,250. If there is a close below ,250, the price could gain bearish momentum. In the stated case, the price could dive toward the ,200 support.
Technical indicators:
Hourly MACD – The MACD is now gaining pace in the bullish zone.
Hourly RSI (Relative Strength Index) – The RSI for BTC/USD is now above the 50 level.
Major Support Levels – ,320, followed by ,250.
Major Resistance Levels – ,000, ,250, and ,500.
BNB Price Increase To Continue? This Resistance Could Trigger Fresh Rally
BNB price is attempting a fresh increase from the 8 zone. The price could start a fresh rally if there is a clear move above the 0 resistance.
- BNB price is showing bullish signs above the 0 pivot level.
- The price is now trading below 0 and the 100 simple moving average (4 hours).
- There is a key bearish trend line forming with resistance near 6 on the 4-hour chart of the BNB/USD pair (data source from Binance).
- The pair gather bullish momentum if there is a close above the 8-0 resistance zone.
BNB Price Eyes Fresh Rally
In the past few days, BNB price started a decent increase and cleared the 0 resistance zone, unlike Bitcoin and Ethereum. There was a move above the 5 level before the bears appeared.
A high was formed near 3 and the price recently started a downside correction. There was a move below the 8 level. The price declined below the 50% Fib retracement level of the upward move from the 7 swing low to the 3 high.
BNB is now consolidating near 5 and the 100 simple moving average (4 hours). Immediate resistance is near the 8 level. There is also a key bearish trend line forming with resistance near 6 on the 4-hour chart of the BNB/USD pair.
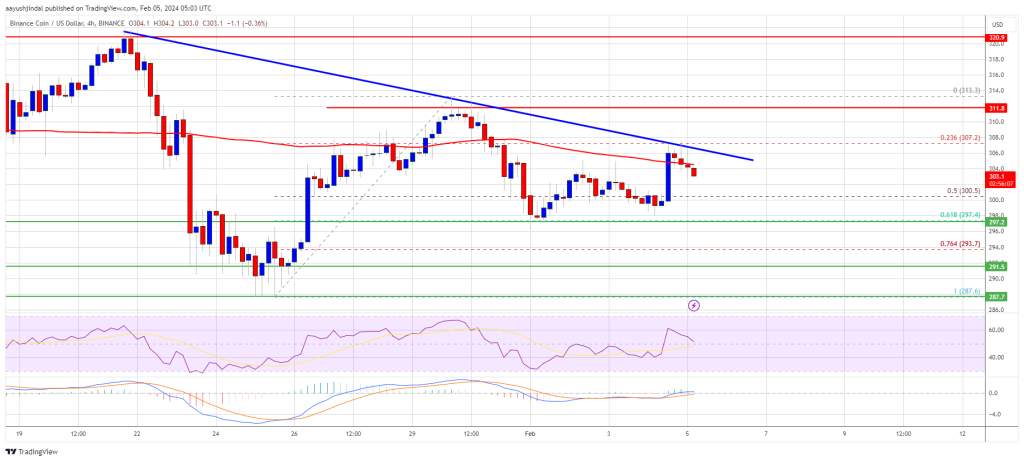
Source: BNBUSD on TradingView.com
The next resistance sits near the 0 level. A clear move above the 0 zone could send the price further higher. In the stated case, BNB price could test 0. A close above the 0 resistance might set the pace for a larger increase toward the 5 resistance. Any more gains might call for a test of the 0 level.
Another Decline?
If BNB fails to clear the 0 resistance, it could continue to move down. Initial support on the downside is near the 0 level. The next major support is near the 2 level or the 76.4% Fib retracement level of the upward move from the 7 swing low to the 3 high.
The main support sits at 8. If there is a downside break below the 8 support, the price could drop toward the 5 support. Any more losses could initiate a larger decline toward the 2 level.
Technical Indicators
4-Hours MACD – The MACD for BNB/USD is losing pace in the bullish zone.
4-Hours RSI (Relative Strength Index) – The RSI for BNB/USD is currently above the 50 level.
Major Support Levels – 0, 2, and 8.
Major Resistance Levels – 8, 0, and 0.
NFT Collections Drive Market Recovery With a 3.74% Increase in Weekly Sales

NFT sales have experienced a 3.74% increase compared to the previous week, totaling 6,234,800 over the past seven days. The latest rise defies the pattern of consecutive weeks marked by declining NFT sales.
NFT Sales Climb Higher, Defying Recent 2-Week Downtrend
The top-performing NFT collection in terms of sales this week was Bitcoin’s “Uncategorized Ordinals,” which achieved million in sales, marking a significant 36.90% increase compared to the previous week. Solana’s “Froganas” collection also performed well, accumulating .79 million in sales, reflecting a 22.95% gain since the prior week. Meanwhile, Avalanche’s “Dokyo” collection recorded sales amounting to .74 million, representing a 30.39% increase week over week.
Other notable NFT collections, included the “Gods Unchained” card compilation on Immutable X and Mythos’ “Dmarket” NFT collection. Both collections experienced increases in NFT sales, rising by 25.51% and 27.27%, respectively. In terms of blockchain dominance in sales, Ethereum took the lead this week, securing .74 million in sales, marking a solid 2.3% increase compared to the previous week. Bitcoin followed closely, claiming the second position with .93 million in sales, showing a substantial 16.66% growth since the previous week.
Solana, while still performing well, secured the third rank with sales totaling .23 million, though it experienced a slight 8.9% decline. Additionally, in the realm of noteworthy blockchain gainers, Arbitrum made a significant leap with a 108.51% increase, while BNB Chain also exhibited a jump of 89.61% in its NFT sales performance this week. This brings us to the week’s highest-priced NFT sale, “Cryptopunk #5363,” which garnered a staggering .53 million just three days prior.
The NFT titled “geth locked deposit,” minted on Arbitrum, fetched a handsome sum of 4,075 merely two days back, while Solana’s “Boogle #083″ found a new owner for 3,422. There’s been a distinct number of valuable NFTs from the Axie Infinity collection sold (minted on Ronin), and this week is no different as “Durendal” was sold for 4,275 three days ago. Completing the week’s top five priciest NFTs, Bitcoin’s “Punk #60” achieved a sale price of 9,266, just past the 24-hour mark.
What do you think about this week’s NFT sales action? Share your thoughts and opinions about this subject in the comments section below.
Ethereum Price Trims Gains But 100 SMA Could Trigger Fresh Increase
Ethereum price extended its increase above the ,320 resistance zone. ETH is correcting gains but the 100 hourly SMA might provide support and start a fresh increase.
- Ethereum started an extended recovery wave above the ,320 resistance zone.
- The price is trading above ,300 and the 100-hourly Simple Moving Average.
- There was a break below a key bullish trend lien with support at ,325 on the hourly chart of ETH/USD (data feed via Kraken).
- The pair might start a fresh increase if it manages to stay above the ,300 level.
Ethereum Price Holds Support
Ethereum price remained in a positive zone above the ,250 resistance zone. ETH cleared the ,320 resistance to move further into a positive zone, outperforming Bitcoin.
The price traded close to the ,400 level. A high was formed near ,390 and the price is now correcting gains. There was a move below the ,350 level. The price broke the 50% Fib retracement level of the upward move from the ,235 swing low to the ,390 high.
Besides, there was a break below a key bullish trend lien with support at ,325 on the hourly chart of ETH/USD. However, Ethereum is still above ,300 and the 100-hourly Simple Moving Average.
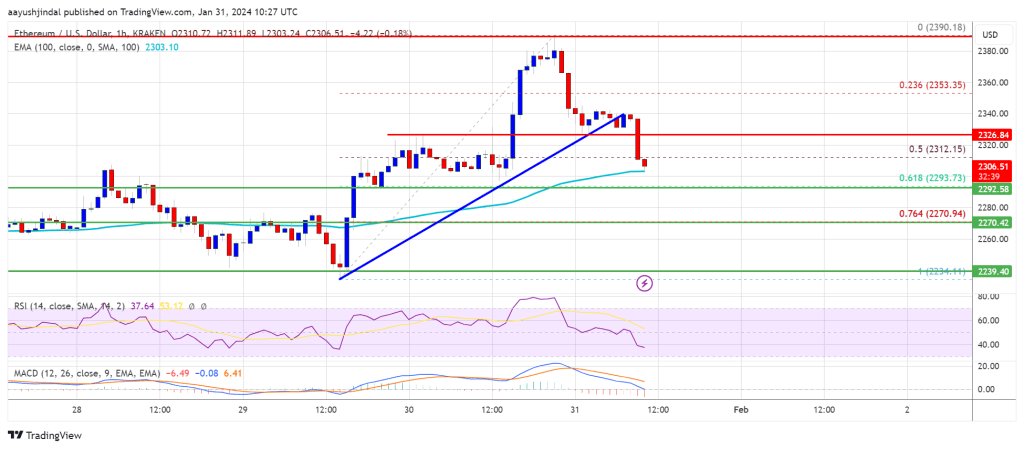
Source: ETHUSD on TradingView.com
On the upside, the first major resistance is near the ,325 level. The next major resistance is near ,350, above which the price might rise and test the ,400 resistance. If the bulls push the price above the ,400 resistance, they could aim for ,450. A clear move above the ,450 level might send the price further higher. In the stated case, the price could rise toward the ,550 level.
More Losses in ETH?
If Ethereum fails to clear the ,325 resistance, it could continue to move down. Initial support on the downside is near the ,300 level and the 100 hourly SMA.
The next key support could be the ,295 zone or the 61.8% Fib retracement level of the upward move from the ,235 swing low to the ,390 high. A daily close below the ,295 support might start another steady decline. In the stated case, Ether could test the ,200 support. Any more losses might send the price toward the ,120 level.
Technical Indicators
Hourly MACD – The MACD for ETH/USD is gaining momentum in the bearish zone.
Hourly RSI – The RSI for ETH/USD is now below the 50 level.
Major Support Level – ,300
Major Resistance Level – ,325
Bitcoin Bulls Keep Pushing, Why Increase Isn’t Over Yet
Bitcoin price is attempting a fresh increase above the ,500 resistance. BTC is showing bullish signs and might rally further above the ,800 resistance.
- Bitcoin price is consolidating gains above the ,500 resistance zone.
- The price is trading above ,750 and the 100 hourly Simple moving average.
- There is a key bullish trend line forming with support near ,650 on the hourly chart of the BTC/USD pair (data feed from Kraken).
- The pair could continue to rise if it clears the ,250 and ,800 resistance levels.
Bitcoin Price Holds Ground
Bitcoin price started a decent increase above the ,000 resistance zone. BTC was able to clear the ,500 and ,200 resistance levels. However, the bears were active near the ,800 zone.
A new weekly high was formed near ,779 before the price started a short-term downside correction. There was a drop below the ,200 level. It broke the 23.6% Fib retracement level of the upward wave from the ,650 swing low to the ,779 high.
Bitcoin is now trading above ,750 and the 100 hourly Simple moving average. There is also a key bullish trend line forming with support near ,650 on the hourly chart of the BTC/USD pair. The trend line is near the 61.8% Fib retracement level of the upward wave from the ,650 swing low to the ,779 high.
Immediate resistance is near the ,250 level. The next key resistance could be ,800, above which the price could start a decent increase. The next stop for the bulls may perhaps be ,500.
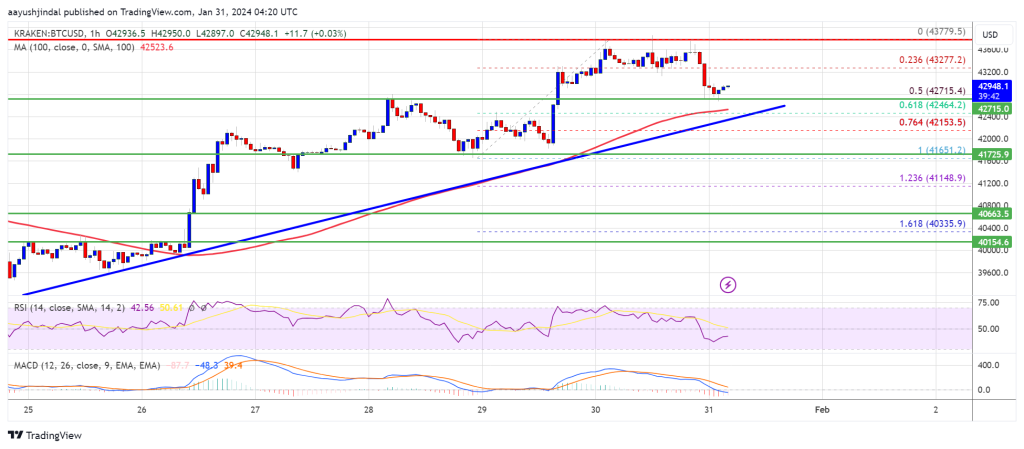
Source: BTCUSD on TradingView.com
A clear move above the ,500 resistance could send the price toward the ,000 resistance. The next resistance is now forming near the ,200 level. A close above the ,200 level could push the price further higher. The next major resistance sits at ,500.
Another Bearish Wave In BTC?
If Bitcoin fails to rise above the ,800 resistance zone, it could continue to move down. Immediate support on the downside is near the ,800 level.
The next major support is ,650 or the trend line. The main support could be ,400 and the 100 hourly SMA. If there is a close below ,400, the price could gain bearish momentum. In the stated case, the price could dive toward the ,200 support.
Technical indicators:
Hourly MACD – The MACD is now losing pace in the bullish zone.
Hourly RSI (Relative Strength Index) – The RSI for BTC/USD is now below the 50 level.
Major Support Levels – ,650, followed by ,400.
Major Resistance Levels – ,250, ,800, and ,500.
Bitcoin Whales Increase Holdings By 4.5%, Getting Ready For Rally?
Despite the recent market conditions that saw Bitcoin’s value dip below the critical ,000 mark, large-scale BTC holders, often called ‘whales,’ have demonstrated their confidence in the flagship crypto.
Crypto analyst Ali has shed light on this development via a post on X, indicating that these major investors have capitalized on the recent price correction to augment their Bitcoin portfolios.
Ali’s analysis revealed that about 67 new entities have joined the elite group of Bitcoin holders who own more than 1,000 BTC, marking a 4.50% increase in such holdings within just two weeks.
While some shivered with fear during the recent price correction, #Bitcoin whales were accumulating more $BTC!
Around 67 new entities now hold 1,000 #BTC or more, marking a 4.50% increase in two weeks. pic.twitter.com/tje3fhznRR
— Ali (@ali_charts) January 30, 2024
This move by the whales goes against the prevailing market sentiment. Despite the price volatility and uncertainties that have gripped the broader crypto space, it suggests a bullish outlook from these major players.
Bitcoin Resilience And Recovery: Factors At Play
In stark contrast to its recent price slump, Bitcoin has shown resilience, charting a course of recovery. The cryptocurrency has witnessed a surge of over 10% in value over the past week, with a notable increase of 3.2% in the last 24 hours alone, bringing its trading price to approximately ,412.
This upward trajectory is mirrored in the cryptocurrency’s trading volume, which has escalated from below billion to over billion in a single day, indicating renewed investor interest and market confidence.
The resurgence in Bitcoin’s price can be attributed to multiple factors, with the diminishing impact of Grayscale’s sell-off being a primary contributor.
Bloomberg analyst James Seyffart recently highlighted a milestone event where BlackRock’s Spot Bitcoin ETF, IBIT, nearly matched Grayscale’s GBTC regarding trading volume. This was a significant moment, as it marked the closest any spot Bitcoin ETF has come to challenging GBTC, which has long held the “liquidity crown” in the crypto spot ETF space.
The positive implications of this development for Bitcoin’s price are clear. With IBIT’s volume mainly consisting of inflows, it can potentially offset the outflow-dominated volume from GBTC.
Reduced Selling Pressure And Market Optimism
Notably, Grayscale’s conversion of GBTC to a spot Bitcoin ETF had been a key factor in Bitcoin’s drop below ,000 in the past week, leading to a wave of sell-offs from GBTC investors.
However, recent trends indicate a cooling off among GBTC investors in their rush to take profits. BitMEX Research, in a post on X, pointed out that GBTC had registered its lowest daily outflow since its launch day, amounting to 2 million yesterday.
Bitcoin ETF Flow – Day 12
GBTC flow data out
2m outflow
— BitMEX Research (@BitMEXResearch) January 29, 2024
This declining trend in outflows signals a reduction in selling pressure in the Bitcoin market, contributing to the cryptocurrency’s price recovery.
Adding to the positive sentiment, Glassnode co-founders Jan Happel and Yann Allemann, known as Negentropic on X, have recently noted that Bitcoin’s recent rise above ,200 has created substantial liquidity for long positions.
This situation suggests that Bitcoin is filling the liquidity void above the ,000 mark, which could lead to volatility and market shifts. Negentropic points out that approximately 9 million in liquidations have already occurred.
If Bitcoin maintains its upward trajectory, it could trigger further liquidations amounting to billion in short positions, potentially leading to a ‘short squeeze.’ This scenario, where short sellers are forced to exit their positions due to a rapid price increase, could catalyze further growth in Bitcoin’s value.
Featured image from Unsplash, Chart from TradingView
Bitcoin Price Restarts Increase – Can BTC Pump To $45K Again?
Bitcoin price is recovering higher above the ,000 resistance. BTC must clear ,800 and ,500 to start an increase toward the ,000 resistance.
- Bitcoin price is moving higher above the ,000 resistance zone.
- The price is trading above ,500 and the 100 hourly Simple moving average.
- There is a key bullish trend line forming with support near ,500 on the hourly chart of the BTC/USD pair (data feed from Kraken).
- The pair could start a steady increase if it clears the ,800 and ,500 resistance levels.
Bitcoin Price Aims Higher
Bitcoin price formed a support base above the ,000 support zone. BTC started a decent increase above the ,200 and ,500 resistance levels.
It opened the doors for more gains above ,000 and the 100 hourly Simple moving average. Finally, the price tested the ,800 zone. A high was formed near ,800 before there was a minor decline. The price declined below the ,200 level.
Bitcoin tested the 23.6% Fib retracement level of the upward move from the ,518 swing low to the ,800 high. There is also a key bullish trend line forming with support near ,500 on the hourly chart of the BTC/USD pair.
The price is now trading above ,500 and the 100 hourly Simple moving average. Immediate resistance is near the ,500 level. The next key resistance could be ,800, above which the price could rise and test ,500.
Source: BTCUSD on TradingView.com
A clear move above the ,500 resistance could send the price toward the ,250 resistance. The next resistance is now forming near the ,000 level. A close above the ,000 level could push the price further higher. The next major resistance sits at ,500.
Another Drop In BTC?
If Bitcoin fails to rise above the ,800 resistance zone, it could start another decline. Immediate support on the downside is near the ,750 level.
The next major support is ,500 and the trend line. If there is a close below ,500, the price could gain bearish momentum. In the stated case, the price could dive toward the ,650 support or the 50% Fib retracement level of the upward move from the ,518 swing low to the ,800 high in the near term.
Technical indicators:
Hourly MACD – The MACD is now gaining pace in the bullish zone.
Hourly RSI (Relative Strength Index) – The RSI for BTC/USD is now above the 50 level.
Major Support Levels – ,500, followed by ,650.
Major Resistance Levels – ,800, ,500, and ,000.