 Based on current metrics, the Bitcoin blockchain is set to undergo another difficulty adjustment before the halving, with an anticipated increase of 1.2% to 2.16% around April 11, 2024. Following this adjustment, there will be 1,344 blocks remaining until the reward is halved. Estimated Increase in Difficulty Precedes Halving In April, bitcoin (BTC) miners face […]
Bitcoin News
Fantom Supply On Exchanges See Drastic Increase, A Cause For Alarm?
The Fantom (FTM) supply on exchanges has been rising in recent times, leading to speculations for what this might mean for the price of the cryptocurrency. Going by trends in the crypto market of when the exchange balances of a particular coin goes up, there might be some pain ahead for FTM investors.
Fantom Supply On Exchanges Rise By 16 Million
The Fantom price had increased over the last month to reach a new three-year high above .2. However, this rally was only short-lived and the altcoin has begun to eliminate its gains from the month of March gradually in the past week.
One culprit for this decline in price is the high level of selling that have been taken place among FTM holders, majority of which have been holding their coins for a rather long time. As a result, the available supply of Fantom on centralized exchanges continued to balloon as investors rush to sell off their tokens and capitalize on gains.
Data from the on-chain tracking website Santiment shows that in the last week of March, there was a considerable number of FTM flowing into centralized exchanges. This saw their available balance go from around 654 million to over 670 million in the space of a week, with over 16 million flowing into exchanges.
This inflow trend coincides with the drop in the Fantom price from above .1 to .84, suggesting that it is indeed the selling pressure from these FTM investors that is responsible for the price decline. Given this, there would have to be a reversal in this selling trend is the FTM price is to recover from here.
Bullishness On FTM Not Dead
The inflow of millions of FTM into centralized exchanges is bearish, but this could only last for the short term. As a rule of crypto, eventually, these sellers will run out of coins to sell, leaving room for demand to catch up with the available supply. At this point, the FTM price will begin to see a reversal in the trend.
There is also the fact that adoption has been increasing on the Fantom chain as founder Andre Conje has been actively talking about it on X (formerly Twitter). Santiment’s data shows that the FTM holder base also grew alongside the price in March. In the week of March 17 and 28 alone, the chain’s holder BASE jumped from 109,000 to over 111,000.
This shows that while the trends are bearish right now, there could be a change soon as the price could resume another leg up. The Fantom price has also established support at .8 which could serve as the bounce point for another rally.
Presently, the FTM price is sitting at .84, with a 5.48% and 18.2% decline on the daily and weekly charts, respectively. Its market cap is at .37 billion, making it the 51st largest cryptocurrency in the space.
Bitcoin Cash Demonstrates Resilience With Price Increase Post-Halving
 Bitcoin Cash (BCH) experienced a notable fluctuation in its value surrounding its most recent block reward halving, initially dropping to 5 just before the halving but later recovering to around 6, marking an 11% increase for the day and nearly 20% for the week. The halving event, which reduced the reward for Bitcoin Cash miners […]
Bitcoin News
BNB Price Rally In Jeopardy? Decoding Key Hurdles To Fresh Increase
BNB price is attempting a fresh increase from the 5 zone. The price could gain bullish momentum if it clears the 5 and 0 resistance levels.
- BNB price started a fresh increase after it found support near the 5 zone.
- The price is now trading above 0 and the 100 simple moving average (4 hours).
- There is a key contracting triangle forming with resistance near 5 on the 4-hour chart of the BNB/USD pair (data source from Binance).
- The pair could attempt a fresh rally if it clears the 0 resistance zone.
BNB Price Eyes Fresh Surge
After a downside correction from 0, BNB price found support near the 5 zone. A low was formed at 6.1 and the price started a fresh increase, unlike Ethereum and Bitcoin.
There was a move above the 0 and 5 resistance levels. The bulls pushed the price above the 23.6% Fib retracement level of the downward move from the 9 swing high to the 6 low. The price is now trading above 0 and the 100 simple moving average (4 hours).
Immediate resistance is near the 5 level. There is also a key contracting triangle forming with resistance near 5 on the 4-hour chart of the BNB/USD pair. It is close to the 50% Fib retracement level of the downward move from the 9 swing high to the 6 low.
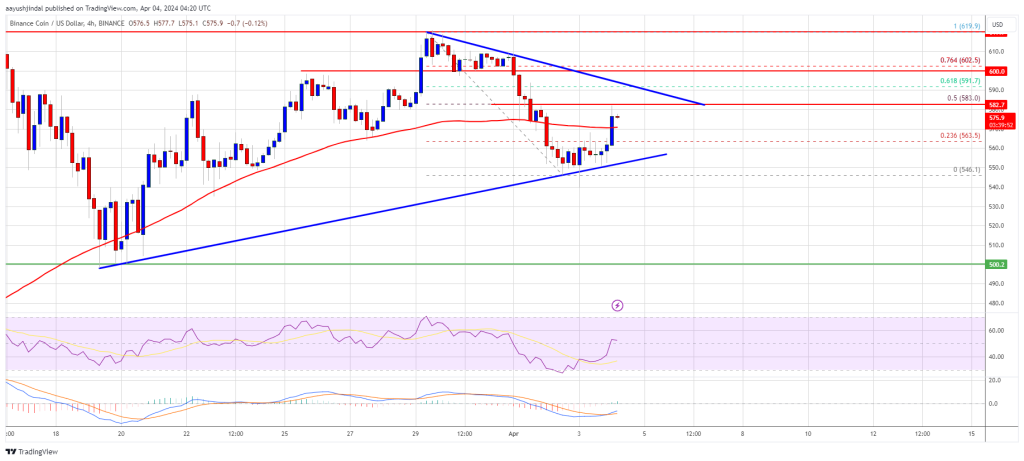
Source: BNBUSD on TradingView.com
The next resistance sits near the 0 level. A clear move above the 0 zone could send the price further higher. In the stated case, BNB price could test 0. A close above the 0 resistance might set the pace for a larger increase toward the 0 resistance. Any more gains might call for a test of the 0 level in the coming days.
Another Decline?
If BNB fails to clear the 0 resistance, it could start another decline. Initial support on the downside is near the 5 level and the trend line.
The next major support is near the 5 level. The main support sits at 2. If there is a downside break below the 2 support, the price could drop toward the 0 support. Any more losses could initiate a larger decline toward the 5 level.
Technical Indicators
4-Hours MACD – The MACD for BNB/USD is gaining pace in the bullish zone.
4-Hours RSI (Relative Strength Index) – The RSI for BNB/USD is currently above the 50 level.
Major Support Levels – 5, 5, and 2.
Major Resistance Levels – 5, 0, and 0.
Aave Proposal Aims to Safeguard Against DAI’s Rapid Market Cap Increase
 The Aave Risk Framework Committee (ARFC) has proposed adjustments to the risk parameters of the dai (DAI) stablecoin to mitigate potential risks associated with Makerdao’s aggressive expansion of the DAI credit line. The proposal, initiated by the Aave Chan Initiative (ACI) team, suggests setting the loan-to-value (LTV) ratio for DAI to 0% across all Aave […]
Bitcoin News
Ethereum Price Gearing For Another Lift-Off to $4K: Increase Isn’t Over Yet
Ethereum price is holding gains above the ,500 zone. ETH could gain bullish momentum if it clears the ,680 resistance zone in the near term.
- Ethereum retested the ,450 and is currently moving higher.
- The price is trading above ,500 and the 100-hourly Simple Moving Average.
- There was a break above a key bearish trend line with resistance at ,540 on the hourly chart of ETH/USD (data feed via Kraken).
- The pair could gain bullish momentum if it settles above the ,680 resistance zone.
Ethereum Price Eyes Fresh Increase
Ethereum price started another downside correction below the ,550 zone. ETH retested the ,450 zone before the bulls appeared, like Bitcoin. A low was formed near ,459 and the price recently climbed higher.
There was a move above the ,520 resistance zone. The bulls pushed the price above the 50% Fib retracement level of the downward move from the ,680 swing high to the ,459 low. There was also a break above a key bearish trend line with resistance at ,540 on the hourly chart of ETH/USD.
Ethereum is now trading above ,520 and the 100-hourly Simple Moving Average. On the upside, immediate resistance is near the ,600 level. The first major resistance is near the ,630 level. It is near the 76.4% Fib retracement level of the downward move from the ,680 swing high to the ,459 low.
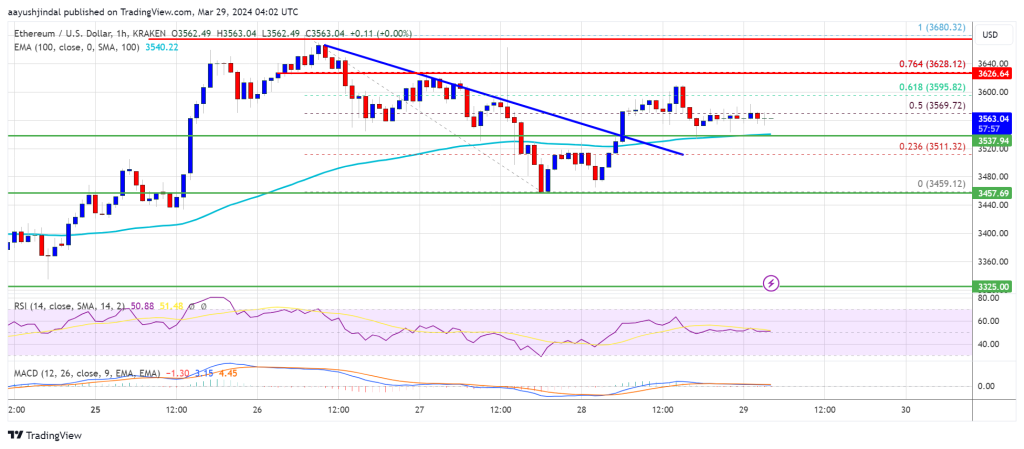
Source: ETHUSD on TradingView.com
The next key resistance sits at ,680, above which the price might gain bullish momentum. In the stated case, Ether could rally toward the ,800 level. If there is a move above the ,880 resistance, Ethereum could even climb toward the ,920 resistance. Any more gains might call for a test of ,000.
Another Decline In ETH?
If Ethereum fails to clear the ,630 resistance, it could start another decline. Initial support on the downside is near the ,540 level.
The first major support is near the ,480 zone. The next key support could be the ,450 zone. A clear move below the ,450 support might send the price toward ,325. Any more losses might send the price toward the ,250 level.
Technical Indicators
Hourly MACD – The MACD for ETH/USD is losing momentum in the bullish zone.
Hourly RSI – The RSI for ETH/USD is now above the 50 level.
Major Support Level – ,450
Major Resistance Level – ,680
Bitcoin Price At Risk of More Downsides Before Fresh Increase To $70K
Bitcoin price struggled to recover above the ,800 resistance. BTC is now moving lower and there is a risk of more downsides below the ,000 support.
- Bitcoin price is struggling to start a fresh increase above the ,000 zone.
- The price is trading below ,000 and the 100 hourly Simple moving average.
- There is a connecting bearish trend line forming with resistance at ,800 on the hourly chart of the BTC/USD pair (data feed from Kraken).
- The pair could gain bullish momentum if it clears the ,000 resistance zone in the near term.
Bitcoin Price Faces Resistance
Bitcoin price attempted a fresh increase above the ,500 zone. BTC climbed above the ,200 and ,000 levels. However, the bears were active near the ,000 zone.
A high was formed at ,898 and the price is now moving lower. There was a move below the ,500 support zone. The price declined below the 50% Fib retracement level of the recovery wave from the ,555 swing low to the ,898 high.
Bitcoin is now trading below ,000 and the 100 hourly Simple moving average. It is testing the 76.4% Fib retracement level of the recovery wave from the ,555 swing low to the ,898 high.
There is also a connecting bearish trend line forming with resistance at ,800 on the hourly chart of the BTC/USD pair. Immediate resistance is near the ,750 level. The next key resistance could be ,800 or the trend line, above which the price could rise toward the ,800 resistance zone.
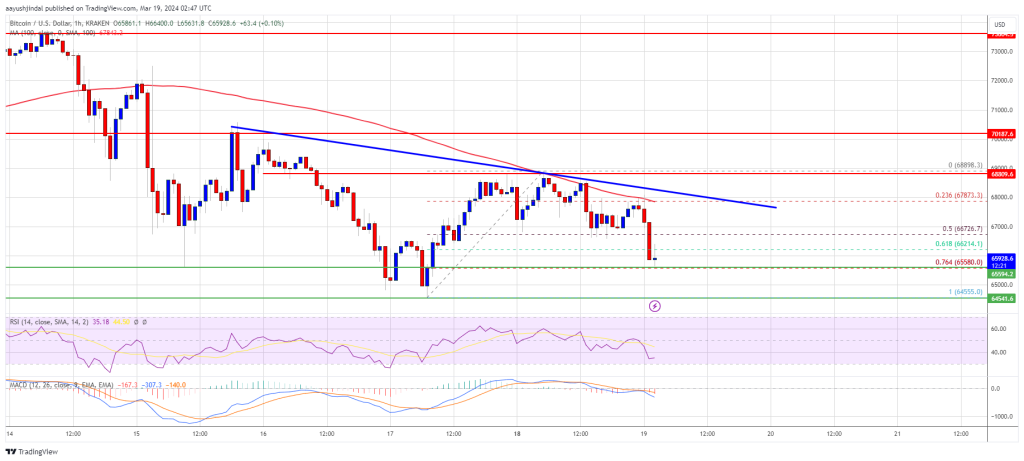
Source: BTCUSD on TradingView.com
If there is a clear move above the ,800 resistance zone, the price could even attempt a move above the ,000 resistance zone. Any more gains might send the price toward the ,200 level.
More Losses In BTC?
If Bitcoin fails to rise above the ,800 resistance zone, it could start another decline. Immediate support on the downside is near the ,550 level.
The first major support is ,000. The main support sits at ,500. If there is a close below ,500, the price could start a drop toward the ,500 level. Any more losses might send the price toward the ,000 support zone.
Technical indicators:
Hourly MACD – The MACD is now gaining pace in the bearish zone.
Hourly RSI (Relative Strength Index) – The RSI for BTC/USD is now below the 50 level.
Major Support Levels – ,500, followed by ,000.
Major Resistance Levels – ,800, ,800, and ,000.
Stablecoin Sector Expands by $4.95B in 12 Days, USDE Sees 376% Supply Increase, Tether Hits $103B
 In the past 12 days, the stablecoin sector has experienced a growth of .95 billion, reaching a new 2024 high of 9.03 billion in market valuation. Among various dollar-tied tokens that have seen their supply numbers go up over the last 30 days, Ethena’s USDE stands out with a 376% increase in its supply during […]
Bitcoin News
Ethereum Price Takes Hit, But This Support Could Spark Fresh Increase
Ethereum price is declining from the ,080 zone. ETH is now approaching a major support at ,500 where the bulls might take a stand.
- Ethereum started a downside correction from the ,080 zone.
- The price is trading below ,800 and the 100-hourly Simple Moving Average.
- There is a key bearish trend line forming with resistance at ,850 on the hourly chart of ETH/USD (data feed via Kraken).
- The pair could resume its increase if it clears the ,850 resistance zone.
Ethereum Price Dips
Ethereum price failed to stay above the ,000 resistance zone and started a downside correction, like Bitcoin. ETH declined below the ,920 and ,850 support levels to enter a short-term bearish zone.
It even spiked below the ,680 support zone. A low was formed at ,625 and the price is now consolidating losses. It seems like there is a key bearish trend line forming with resistance at ,850 on the hourly chart of ETH/USD.
Ethereum price is now trading below ,800 and the 100-hourly Simple Moving Average. On the upside, immediate resistance is near the ,740 level or the 23.6% Fib retracement level of the recent decline from the ,083 swing high to the ,625 low.
The first major resistance is near the ,850 level and the trend line. It is close to the 50% Fib retracement level of the recent decline from the ,083 swing high to the ,625 low.
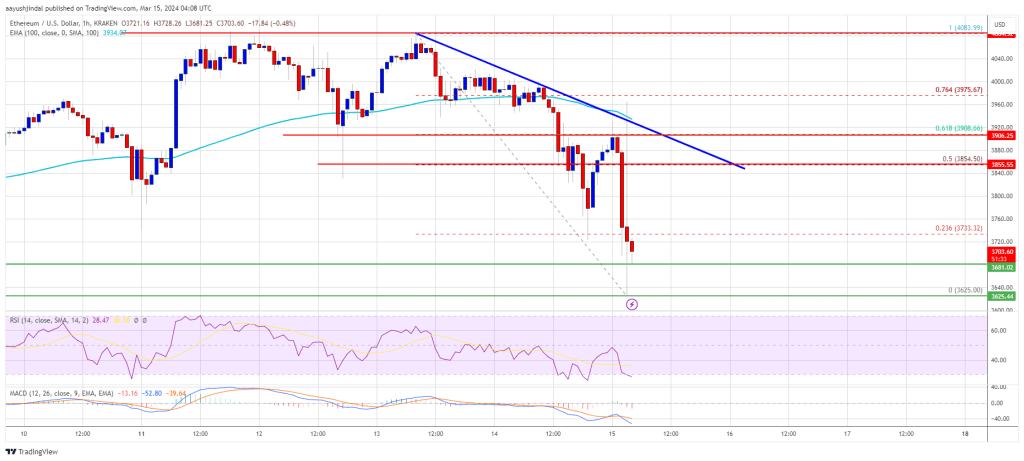
Source: ETHUSD on TradingView.com
The next major resistance is near ,880, above which the price might gain bullish momentum. In the stated case, Ether could rally toward the ,000 level. If there is a move above the ,000 resistance, Ethereum could even rise toward the ,080 resistance. Any more gains might call for a test of ,150.
More Losses In ETH?
If Ethereum fails to clear the ,850 resistance, it could continue to move down. Initial support on the downside is near the ,680 level.
The first major support is near the ,600 zone. The next key support could be the ,500 zone. A clear move below the ,500 support might send the price toward ,350. Any more losses might send the price toward the ,250 level.
Technical Indicators
Hourly MACD – The MACD for ETH/USD is gaining momentum in the bearish zone.
Hourly RSI – The RSI for ETH/USD is now below the 50 level.
Major Support Level – ,600
Major Resistance Level – ,850
Ethereum Price Faces Many Hurdles, Downside Thrust Before Fresh Increase?
Ethereum price is struggling above the ,000 zone. ETH is slowly moving lower and there is a risk of a downside thrust toward the ,850 support.
- Ethereum traded to a new multi-month high above ,080 before correcting lower.
- The price is trading below ,000 and the 100-hourly Simple Moving Average.
- There is a connecting bullish trend line forming with support at ,965 on the hourly chart of ETH/USD (data feed via Kraken).
- The pair could resume its increase if it clears the ,025 resistance zone.
Ethereum Price Holds Support
Ethereum price extended its increase above the ,050 level, like Bitcoin. ETH traded to a new multi-month high above ,080 before there was a downside correction.
The price declined below the ,000 level. It seems like Ether bulls are struggling to keep the price above ,000. There was a move below the 23.6% Fib retracement level of the upward move from the ,830 swing low to the ,083 high.
Ethereum price is now trading below ,980 and the 100-hourly Simple Moving Average. However, the bulls are active near the ,950 zone. There is also a connecting bullish trend line forming with support at ,965 on the hourly chart of ETH/USD. The trend line is close to the 50% Fib retracement level of the upward move from the ,830 swing low to the ,083 high.
If the pair stays above the ,950 level, it could attempt another increase. Immediate resistance on the upside is near the ,025 level. The first major resistance is near the ,050 level. The next major resistance is near ,085, above which the price might gain bullish momentum.
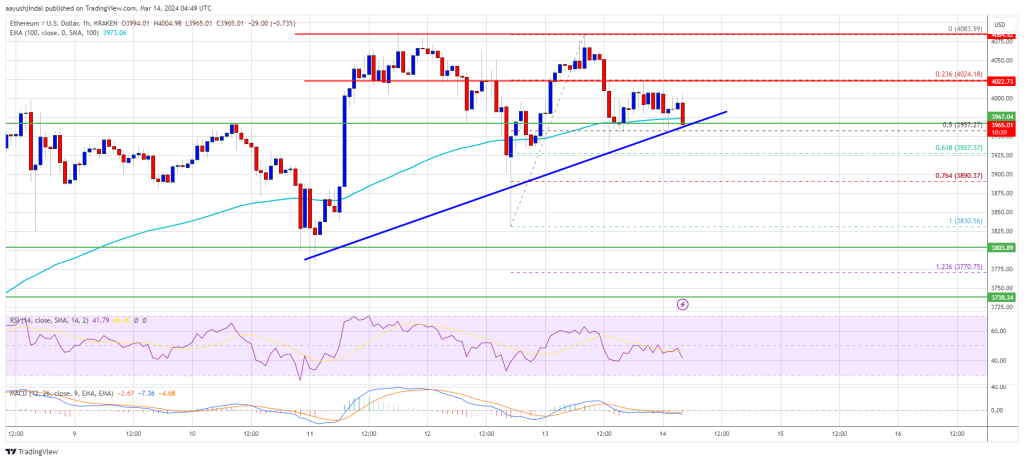
Source: ETHUSD on TradingView.com
In the stated case, Ether could rally toward the ,150 level. If there is a move above the ,150 resistance, Ethereum could even rise toward the ,250 resistance. Any more gains might call for a test of ,320.
Downside Break In ETH?
If Ethereum fails to clear the ,025 resistance, it could start a downside correction. Initial support on the downside is near the ,950 level.
The first major support is near the ,880 zone. The next key support could be the ,830 zone. A clear move below the ,830 support might send the price toward ,750. Any more losses might send the price toward the ,650 level.
Technical Indicators
Hourly MACD – The MACD for ETH/USD is losing momentum in the bullish zone.
Hourly RSI – The RSI for ETH/USD is now below the 50 level.
Major Support Level – ,950
Major Resistance Level – ,025