 The South African retail giant, Pick n Pay, has reported a significant increase in the value of monthly cryptocurrency payments, rising from approximately ,350 to ,000. The regions of Gauteng, KwaZulu-Natal, and the Western Cape in South Africa account for the lion’s share of Pick n Pay’s crypto transactions. Retailer Sees More Crypto Transactions in […]
Bitcoin News
XRP Price Dips To Support, Can It Bounce Back And Restart Increase?
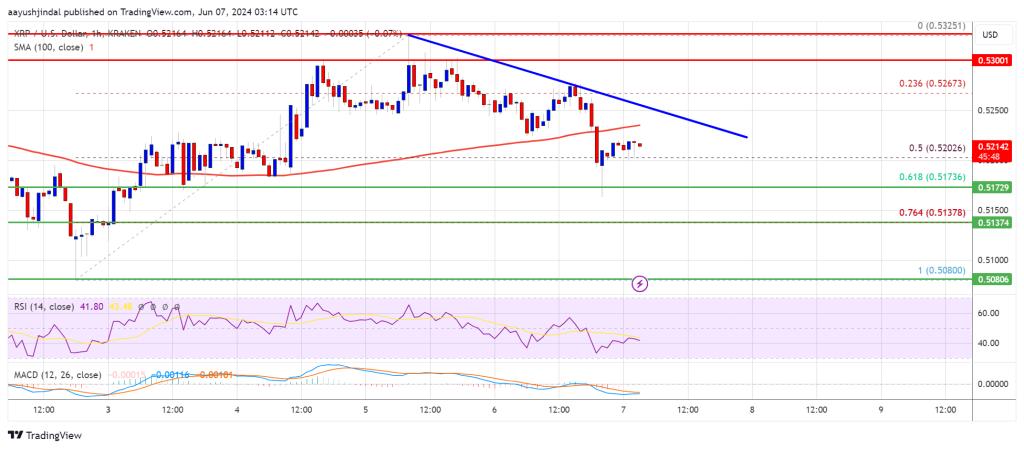
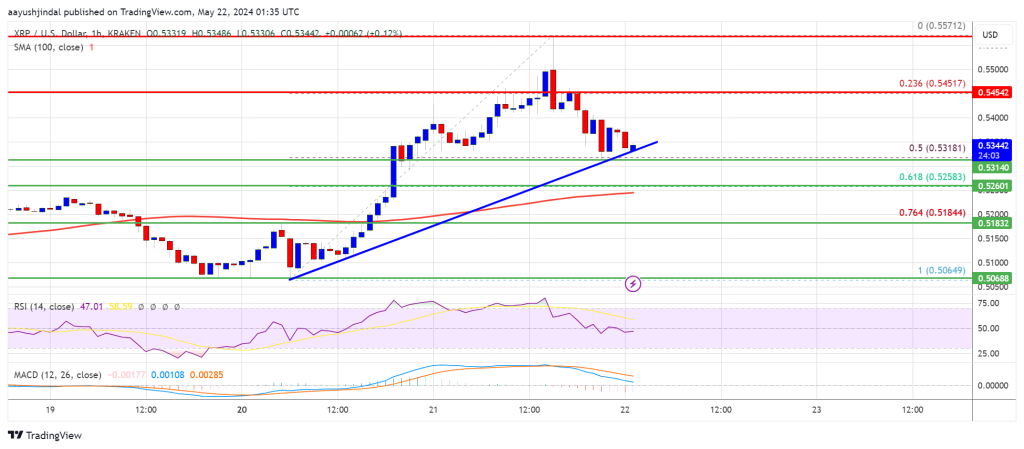
XRP price started a fresh decline from the .5320 resistance zone. It is now testing the .5180 support and might even test the .5120 support zone.
- XRP failed near .5320 and started a downside correction.
- The price is now trading below .5250 and the 100-hourly Simple Moving Average.
- There is a connecting bearish trend line forming with resistance near .5250 on the hourly chart of the XRP/USD pair (data source from Kraken).
- The pair could dip further if it stays below the .5250 resistance zone.
XRP Price Dips Again
XRP price extended its increase above the .5265 level like Bitcoin and Ethereum. The price even spiked above the .5300 level before the bears appeared.
A high was formed at .5325 and the price started a downside correction. There was a move below the .5250 level. It traded below the 50% Fib retracement level of the upward wave from the .5080 swing low to the .5325 high.
The price is now trading below .5250 and the 100-hourly Simple Moving Average. However, the bulls are active near the 61.8% Fib retracement level of the upward wave from the .5080 swing low to the .5325 high.
On the upside, the price is facing resistance near the .5250 level. There is also a connecting bearish trend line forming with resistance near .5250 on the hourly chart of the XRP/USD pair. The first key resistance is near .5300. The next major resistance is near the .5320 level. A close above the .5320 resistance zone could send the price higher. The next key resistance is near .5450.
If there is a close above the .5450 resistance level, there could be a steady increase toward the .5520 resistance. Any more gains might send the price toward the .5650 resistance.
More Losses?
If XRP fails to clear the .5250 resistance zone, it could continue to move down. Initial support on the downside is near the .5165 level.
The next major support is at .5120. If there is a downside break and a close below the .5120 level, the price might accelerate lower. In the stated case, the price could decline and retest the .5020 support in the near term.
Technical Indicators
Hourly MACD – The MACD for XRP/USD is now losing pace in the bearish zone.
Hourly RSI (Relative Strength Index) – The RSI for XRP/USD is now below the 50 level.
Major Support Levels – .5165 and .5120.
Major Resistance Levels – .5250 and .5320.
Can Solana (SOL) Overcome Key Resistance and Ignite a Fresh Increase?
Solana declined again and tested the 0 support zone. SOL price is consolidating and might recover if it clears the 6 resistance zone.
- SOL price corrected lower and tested the 0 support zone against the US Dollar.
- The price is now trading below 8 and the 100-hourly simple moving average.
- There is a connecting bearish trend line forming with resistance at 5 on the hourly chart of the SOL/USD pair (data source from Kraken).
- The pair could clear the 6 resistance unless it fails to stay above 0.
Solana Price Eyes Recovery
Solana price remained in a short-term bearish zone like Bitcoin and Ethereum. SOL tested the 0 support zone and now consolidating losses. It is stuck below the 5 level.
There was a minor move above the 23.6% Fib retracement level of the downward move from the 0 swing high to the 1.50 low. Solana price is now trading below 6 and the 100-hourly simple moving average. Immediate resistance is near the 5 level.
There is also a connecting bearish trend line forming with resistance at 5 on the hourly chart of the SOL/USD pair. The next major resistance is near the 6 level. A successful close above the 6 resistance could set the pace for another major increase.
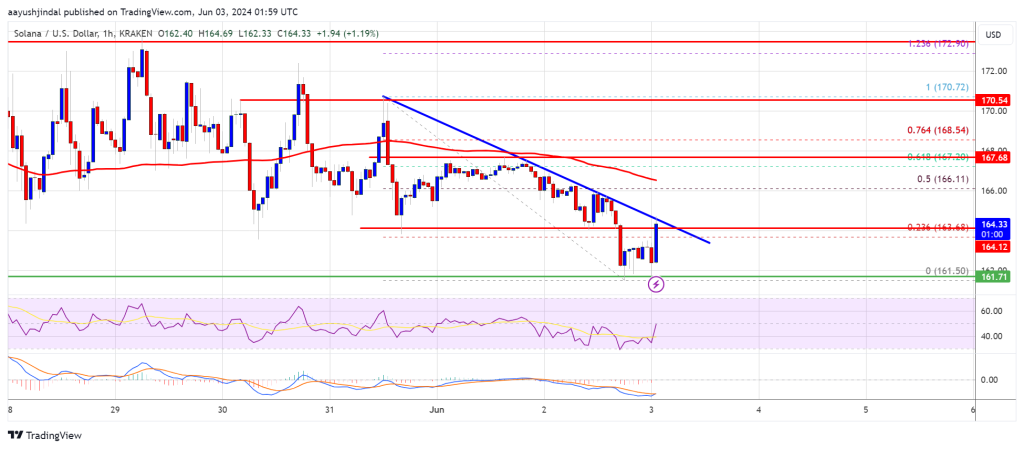
The next key resistance is near 8 or the 61.8% Fib retracement level of the downward move from the 0 swing high to the 1.50 low. Any more gains might send the price toward the 2 level.
More Losses in SOL?
If SOL fails to rally above the 6 resistance, it could start another decline. Initial support on the downside is near the 2 level.
The first major support is near the 0 level, below which the price could test 5. If there is a close below the 5 support, the price could decline toward the 0 support in the near term.
Technical Indicators
Hourly MACD – The MACD for SOL/USD is losing pace in the bearish zone.
Hourly Hours RSI (Relative Strength Index) – The RSI for SOL/USD is below the 50 level.
Major Support Levels – 2, and 0.
Major Resistance Levels – 6, 8, and 2.
Bitcoin Price Struggles: Can the Leading Cryptocurrency Start Fresh Increase?
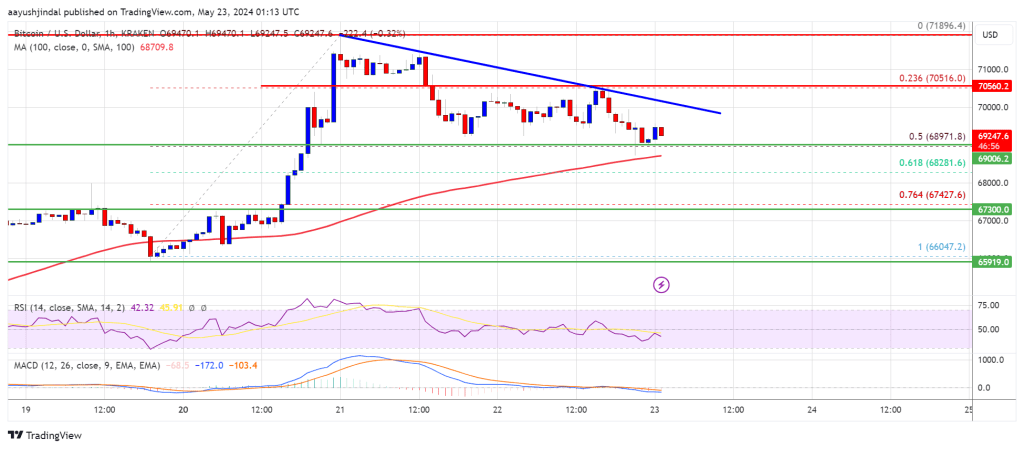
Bitcoin price extended its decline below the ,000 level. BTC is now slowly moving lower toward the ,250 support zone in the near term.
- Bitcoin extended its downside correction below the ,000 zone.
- The price is trading below ,500 and the 100 hourly Simple moving average.
- There is a key bearish trend line forming with resistance at ,900 on the hourly chart of the BTC/USD pair (data feed from Kraken).
- The pair could continue to move down unless there is a close above the ,500 level.
Bitcoin Price Dips Further
Bitcoin price extended its downside correction below the ,000 level. BTC bears were able to push the price below the ,000 support. Finally, the price tested the ,000 zone.
A low has formed at ,100 and the price is now consolidating losses. It recovered above the ,5000 level and the 23.6% Fib retracement level of the downward wave from the ,600 swing high to the ,100 low, with a bearish angle.
Bitcoin is now trading below ,500 and the 100 hourly Simple moving average. On the upside, the price is facing resistance near the ,000 level. There is also a key bearish trend line forming with resistance at ,900 on the hourly chart of the BTC/USD pair.
The first major resistance could be ,800 or the 50% Fib retracement level of the downward wave from the ,600 swing high to the ,100 low.
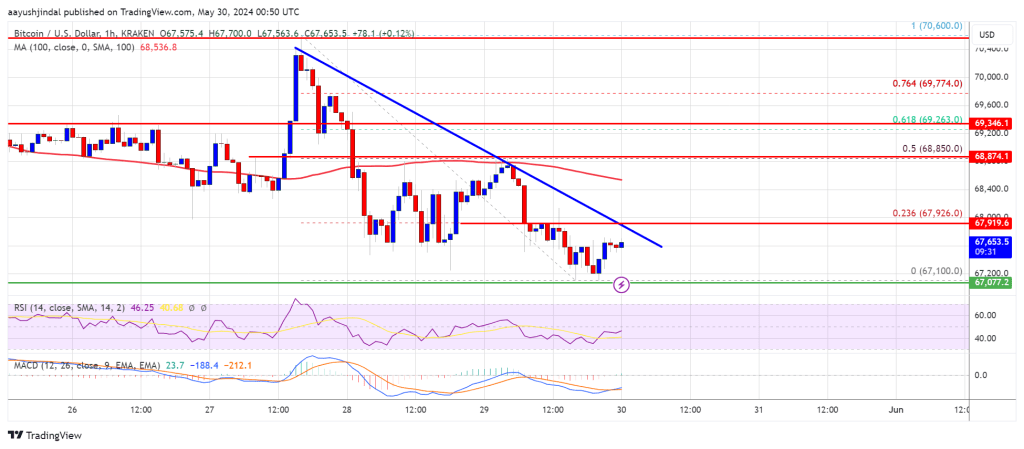
The next key resistance could be ,250. A clear move above the ,250 resistance might send the price higher. In the stated case, the price could rise and test the ,000 resistance. Any more gains might send BTC toward the ,600 resistance.
More Losses In BTC?
If Bitcoin fails to climb above the ,000 resistance zone, it could continue to move down. Immediate support on the downside is near the ,250 level.
The first major support is ,000. The next support is now forming near ,250. Any more losses might send the price toward the ,000 support zone in the near term.
Technical indicators:
Hourly MACD – The MACD is now losing pace in the bearish zone.
Hourly RSI (Relative Strength Index) – The RSI for BTC/USD is now above the 50 level.
Major Support Levels – ,100, followed by ,250.
Major Resistance Levels – ,000, and ,800.
Can Ethereum Price Maintain This Support and Spark a New Increase?
Ethereum price started a downside correction below the ,880 support. ETH is now testing the ,760 support and might aim for a fresh increase.
- Ethereum started another downside correction below the ,880 zone.
- The price is trading above ,750 and the 100-hourly Simple Moving Average.
- There is a connecting bearish trend line forming with resistance at ,880 on the hourly chart of ETH/USD (data feed via Kraken).
- The pair could restart its increase unless there is a move below the ,760 support.
Ethereum Price Dips To Support
Ethereum price failed to test the ,000 resistance zone and started a downside correction, like Bitcoin. ETH dipped below the ,920 and ,880 support levels.
There was also a spike below the 50% Fib retracement level of the upward move from the ,631 swing low to the ,972 high. Finally, the price dipped below the ,800 level. However, the bulls were active near the ,760 support zone.
The price stayed above the 61.8% Fib retracement level of the upward move from the ,631 swing low to the ,972 high. Ethereum price is now trading above ,750 and the 100-hourly Simple Moving Average.
Immediate resistance is near the ,880 level. There is also a connecting bearish trend line forming with resistance at ,880 on the hourly chart of ETH/USD. The first major resistance is near the ,920 level. An upside break above the ,920 resistance might send the price higher.
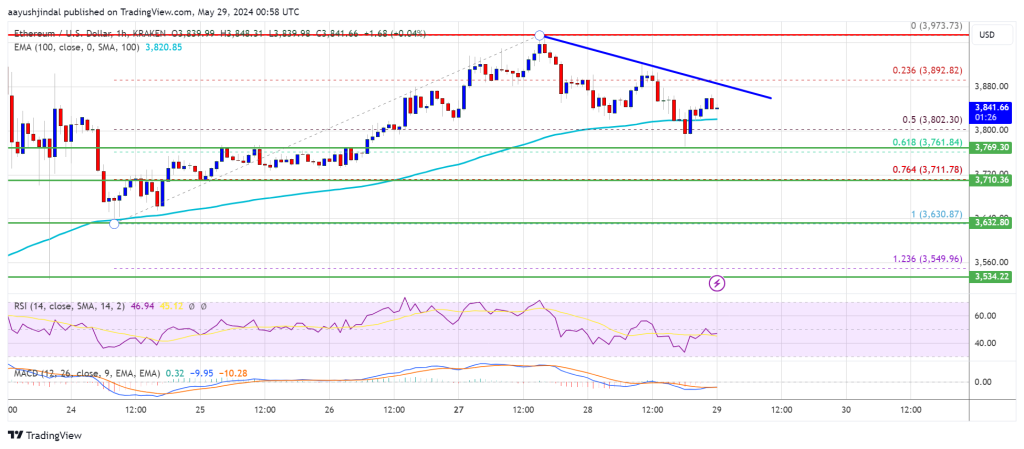
The next key resistance sits at ,950, above which the price might gain traction and rise toward the ,000 level. If there is a clear move above the ,000 level, the price might rise and test the ,080 resistance. Any more gains could send Ether toward the ,150 resistance zone.
More Losses In ETH?
If Ethereum fails to clear the ,880 resistance, it could continue to move down. Initial support on the downside is near the ,800 level.
The next major support is near the ,760 zone. A clear move below the ,760 support might push the price toward ,720. Any more losses might send the price toward the ,630 level in the near term.
Technical Indicators
Hourly MACD – The MACD for ETH/USD is losing momentum in the bearish zone.
Hourly RSI – The RSI for ETH/USD is now below the 50 zone.
Major Support Level – ,760
Major Resistance Level – ,880
Bitcoin Price Hits Crucial Support: Will Bulls Ignite a Fresh Increase?
Bitcoin price started a downside correction below the ,000 level. BTC is now testing the ,800 support and might attempt a fresh increase.
- Bitcoin extended its decline below the ,000 support zone.
- The price is trading above ,000 and the 100 hourly Simple moving average.
- There is a connecting bearish trend line forming with resistance at ,000 on the hourly chart of the BTC/USD pair (data feed from Kraken).
- The pair could start another increase unless there is a close below ,800.
Bitcoin Price Revisits Support
Bitcoin price started a downside correction after it struggled above the ,500 level. A new weekly high was formed at ,896 and the price recently started a downside correction.
The price declined below the ,000 level and tested the 50% Fib retracement level of the upward wave from the ,046 swing low to the ,896 high. There was also a spike below the ,800 support zone. The bulls are currently active near the ,800 zone.
Bitcoin price is now trading above ,000 and the 100 hourly Simple moving average. The price is now facing resistance near the ,650 level. The first major resistance could be ,000. There is also a connecting bearish trend line forming with resistance at ,000 on the hourly chart of the BTC/USD pair.
The next key resistance could be ,500. A clear move above the ,500 resistance might send the price higher. In the stated case, the price could rise and test the ,200 resistance.
If the bulls push the price further higher, there could be a move toward the ,800 resistance zone. Any more gains might send BTC toward the ,500 resistance.
Downside Break In BTC?
If Bitcoin fails to climb above the ,000 resistance zone, it could continue to move down. Immediate support on the downside is near the ,000 level.
The first major support is ,800. The next support is now forming near ,420 or the 76.4% Fib retracement level of the upward wave from the ,046 swing low to the ,896 high. Any more losses might send the price toward the ,000 support zone in the near term.
Technical indicators:
Hourly MACD – The MACD is now losing pace in the bearish zone.
Hourly RSI (Relative Strength Index) – The RSI for BTC/USD is now below the 50 level.
Major Support Levels – ,000, followed by ,800.
Major Resistance Levels – ,000, ,500, and ,200.
Will XRP Price Hold 100 SMA and Trigger a Fresh Increase?
XRP price extended its increase above the .5450 resistance. The price is now correcting gains and might remain strong above the 100-hourly SMA.
- XRP extended its increase above the .5450 resistance zone.
- The price is now trading above .5250 and the 100-hourly Simple Moving Average.
- There is a key bullish trend line forming with support at .5330 on the hourly chart of the XRP/USD pair (data source from Kraken).
- The pair is correcting gains, but there could be a fresh increase unless there is a close below the 100-hourly SMA.
XRP Price Holds Ground
After a close above the .520 level, XRP price remained in a positive zone, like Bitcoin and Ethereum. It cleared the .5320 and .5450 resistance levels. There was also a spike above the .550 level.
A new weekly high was formed at .5571, and the price is now correcting gains. There was a move below the .5450 level. The price dipped below the 23.6% Fib retracement level of the upward wave from the .5065 swing low to the .5571 high.
It is now trading above .530 and the 100-hourly Simple Moving Average. There is also a key bullish trend line forming with support at .5330 on the hourly chart of the XRP/USD pair.
Immediate resistance is near the .5380 level. The first key resistance is near .5450. A close above the .5450 resistance zone could send the price higher. The next key resistance is near .5570. If the bulls push the price above the .5570 resistance level, there could be a steady increase toward the .5650 resistance. Any more gains might send the price toward the .5720 resistance.
More Losses?
If XRP fails to clear the .5450 resistance zone, it could continue to move down. Initial support on the downside is near the .5330 level and the trend line. It is close to the 50% Fib retracement level of the upward wave from the .5065 swing low to the .5571 high.
The next major support is at .5250. The main support is now near .5185. If there is a downside break and a close below the .5185 level, the price might accelerate lower. In the stated case, the price could drop and test the .5065 support in the near term.
Technical Indicators
Hourly MACD – The MACD for XRP/USD is now losing pace in the bullish zone.
Hourly RSI (Relative Strength Index) – The RSI for XRP/USD is now below the 50 level.
Major Support Levels – .5330 and .5185.
Major Resistance Levels – .5450 and .5570.
Veteran Trader Peter Brandt Says Peter Schiff Criticizes Bitcoin to Attract Attention, Increase Following
 Veteran trader Peter Brandt has accused economist and gold advocate Peter Schiff of leveraging his criticisms of bitcoin to garner attention and increase his social media following. However, Schiff countered, asserting that he is simply offering his candid perspective on the investment risks associated with bitcoin. Peter Schiff’s Bets on Dead Horses Veteran trader Peter […]
Bitcoin News
Value Locked in Defi Nears $100B Range Again After $11.89B Increase in 35 Days
 Over the past 35 days, the total value locked in decentralized finance (defi) protocols has expanded by .89 billion, recovering from a low of just over billion on April 13. Although it has not yet reached the 0 billion mark, the value locked in defi is approaching that milestone after hovering just below it. […]
Bitcoin News
Cardano Whales Return To The Table, Increase Massive Holdings By 10%
Cardano (ADA) whales are back in the picture, with recent data suggesting their confidence in the crypto token may have been revived. If so, this will be massive for ADA, which could experience significant price surges soon enough based on this development.
Cardano Whales Add To Their Holdings
The market intelligence platform IntoTheBlock recently revealed in an X (formerly Twitter) post that Cardano whales (who hold between 100 million and 1 billion ADA) have now added 11% to their balances over the past 30 days. These investors now hold 6.71% of Cardano’s total supply.
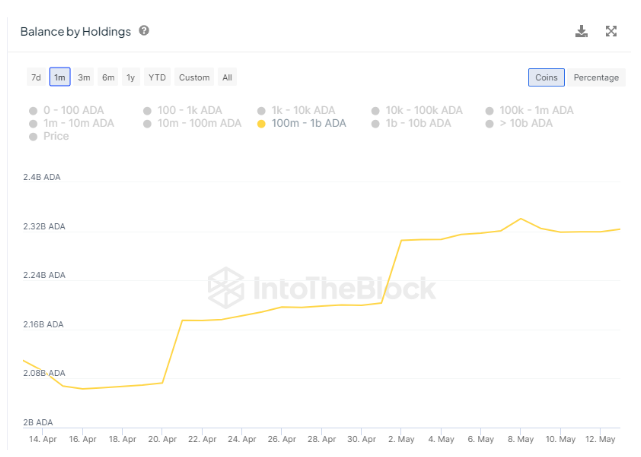
This represents a bullish development for Cardano since whale accumulation usually suggests that these investors are positioning for a potential price surge. These whales also contribute to the price surge since buys of such magnitude could trigger a rally in the price of any crypto token.
Besides the whales, retail investors are also heavily invested in Cardano. Data from IntoTheBlock shows that the bid-ask volume imbalance is bullish for ADA. Furthermore, the ‘In The Money’ metric has also turned bullish for Cardano, meaning that most of these investors are currently in profit.
Generally, the confidence in the Cardano ecosystem is growing once again. Data from DeFiLlama shows that the Total Value Locked (TVL) on the network has increased by over 5% in the last seven days. Lately, there has also been a significant increase in Cardano’s trading volume, meaning users are actively trading on the network.
Cardano’s Rally Is Imminent
Crypto analyst World of Charts suggested that Cardano might soon experience a significant rally, noting that the crypto token’s breakout was already confirmed and moving toward the projected price targets. The analyst had previously predicted that a successful breakout would take Cardano’s price to in the coming weeks.
Crypto analyst Trend Rider also confirmed that Cardano is already witnessing a bullish reversal, highlighting the bounce the crypto token made after flashing a bullish signal on the daily chart. In the short term, the analyst expects ADA to climb back above .5 and added that Cardano will need to hold above .51 on the weekly to end the price correction and confirm a bullish continuation.
Crypto analyst Dan Gambardello, the founder of Crypto Capital Venture, also provided insights into Cardano’s future trajectory. He noted that Cardano is currently breaking its 20-day moving average (MA), which the analyst claimed is a very “nice sign” for ADA.
Gambardello pointed out on Cardano’s daily chart that the 50-day MA has crossed the 200-day MA, which likely means that the bottom is already in, and this is the lowest Cardano will go. This occurrence is referred to as a golden cross and is a bullish signal, indicating the beginning of an upward trend.
Featured image from Pexels, chart from TradingView