 In a recent editorial, economist Peter St Onge explores the potential of a hidden economic recession, suggesting that official figures might not reveal the full extent of the decline. St Onge raises concerns about the accuracy of U.S. inflation data and its implications for measuring true economic growth. Peter St Onge, Official Figures May Understate […]
Bitcoin News
The Hidden Forces Behind Bitcoin Price: Latest Insights From On-Chain Data
Leading on-chain analyst James Check, popularly known as Checkmatey, has recently delved into the intricacies of Bitcoin’s market dynamics, offering a detailed on-chain data analysis that sheds light on the forces driving Bitcoin prices. His latest insights highlight a period he describes as “Quiet and Trending,” suggesting a robust underpinning despite significant sell-side pressures and shifts in volatility.
Bitcoin Follows The Stair-Stepping Rally-Consolidation-Rally Pattern
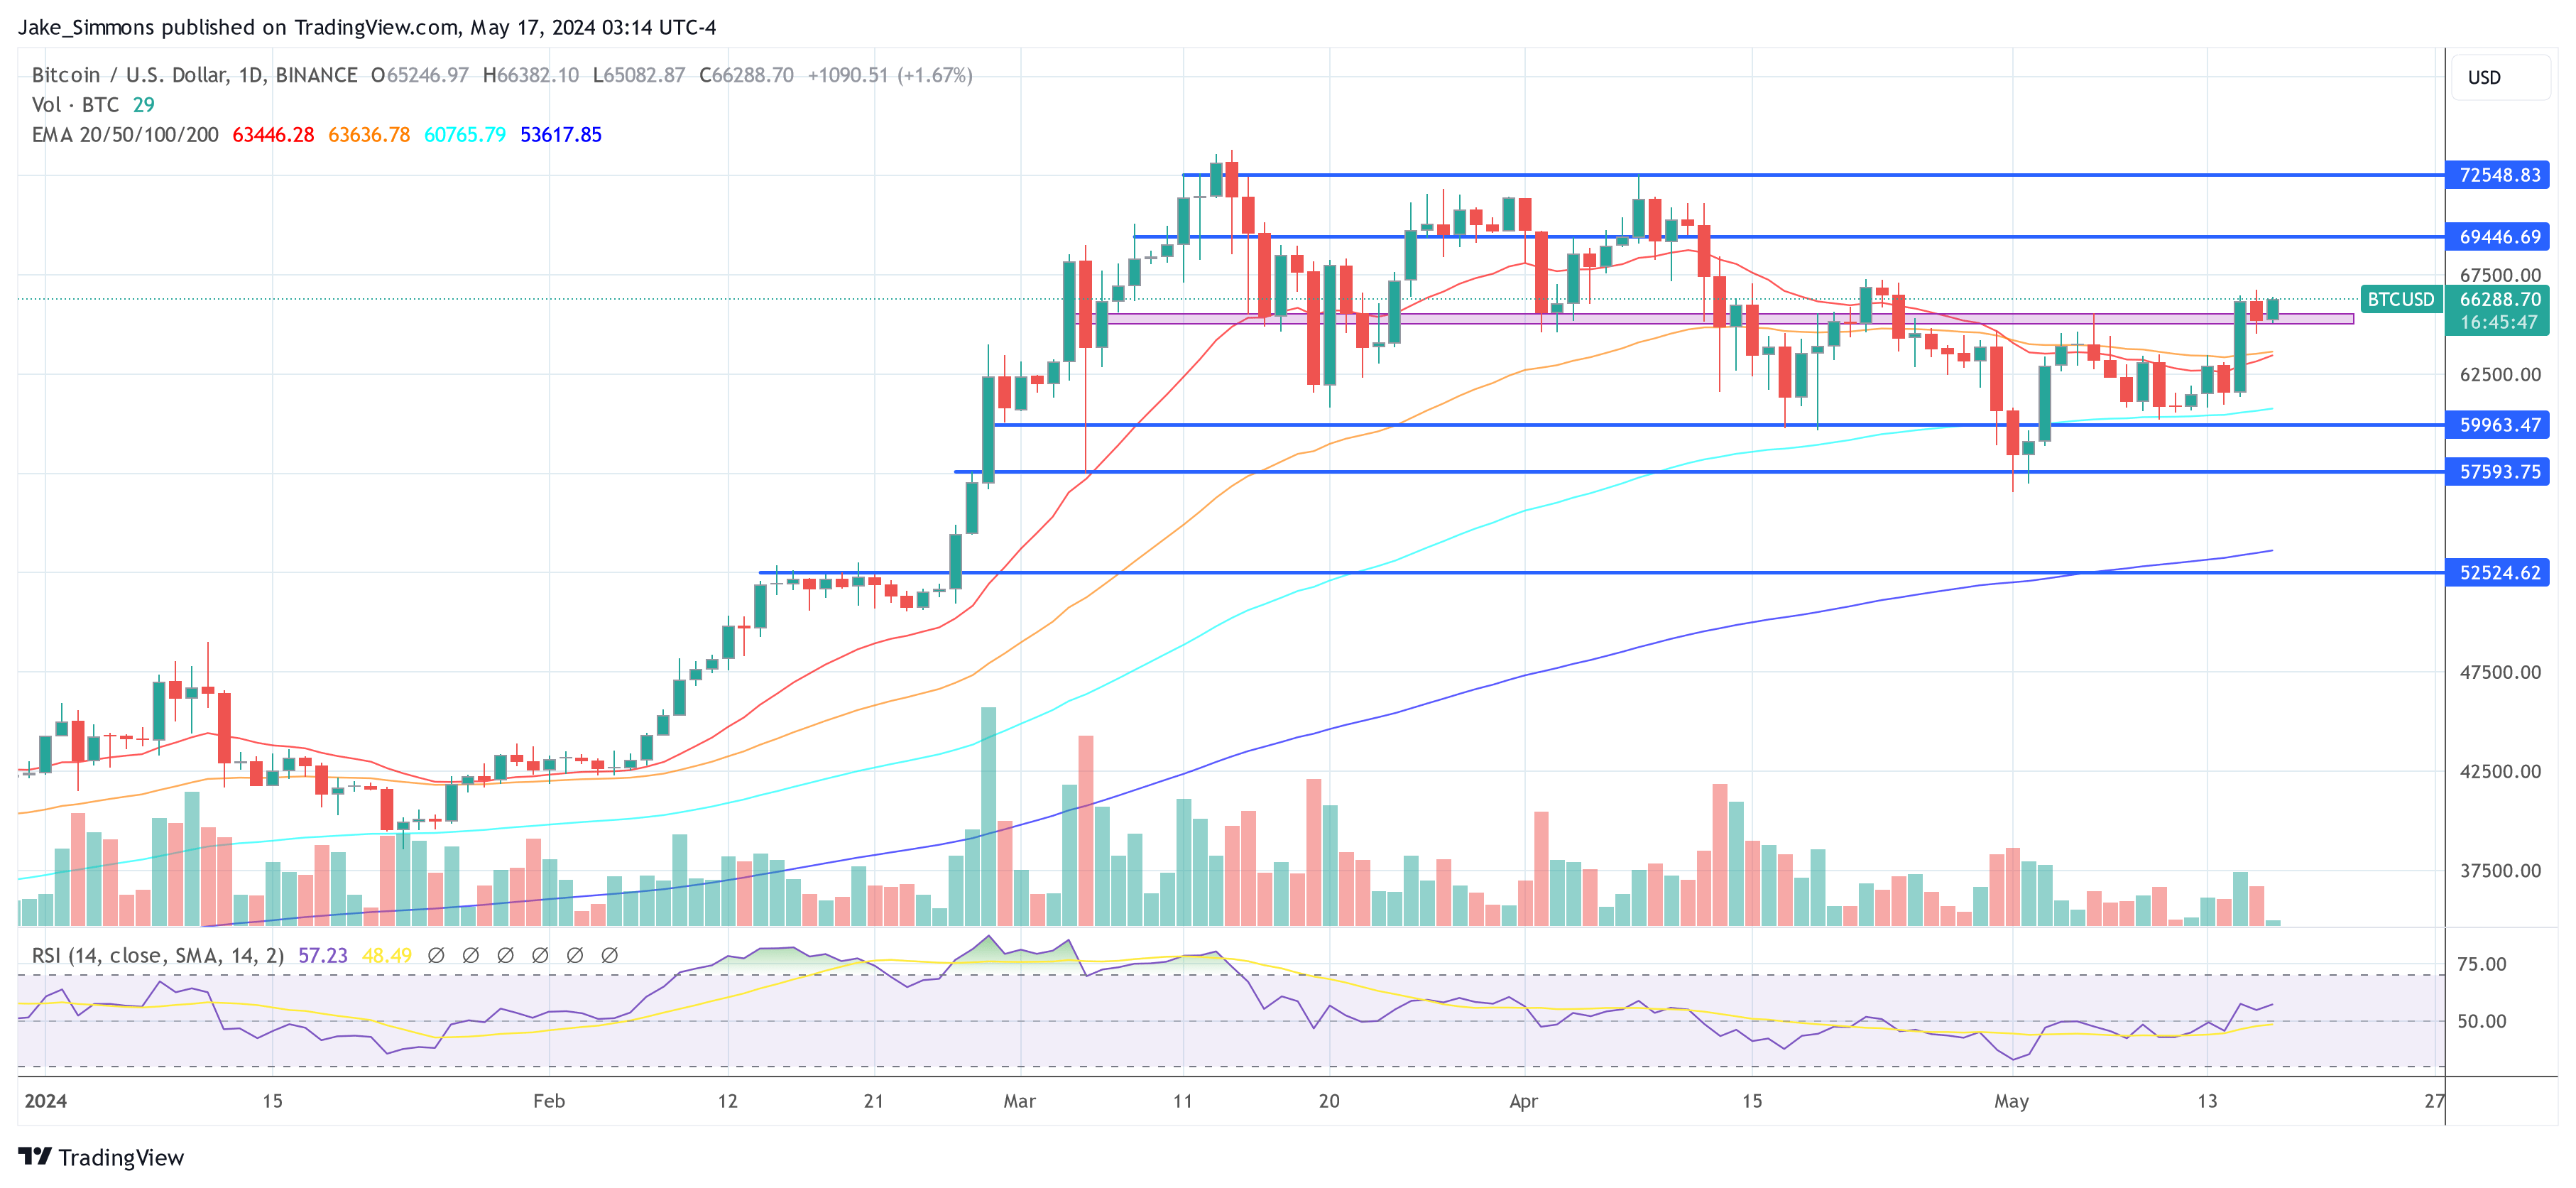
Since December, Bitcoin has experienced substantial sell-side pressure, with over 1.5 million BTC being sold. “Around 30% of this came out of GBTC, but the rest of it was good old fashioned profit taking,” Check explains.
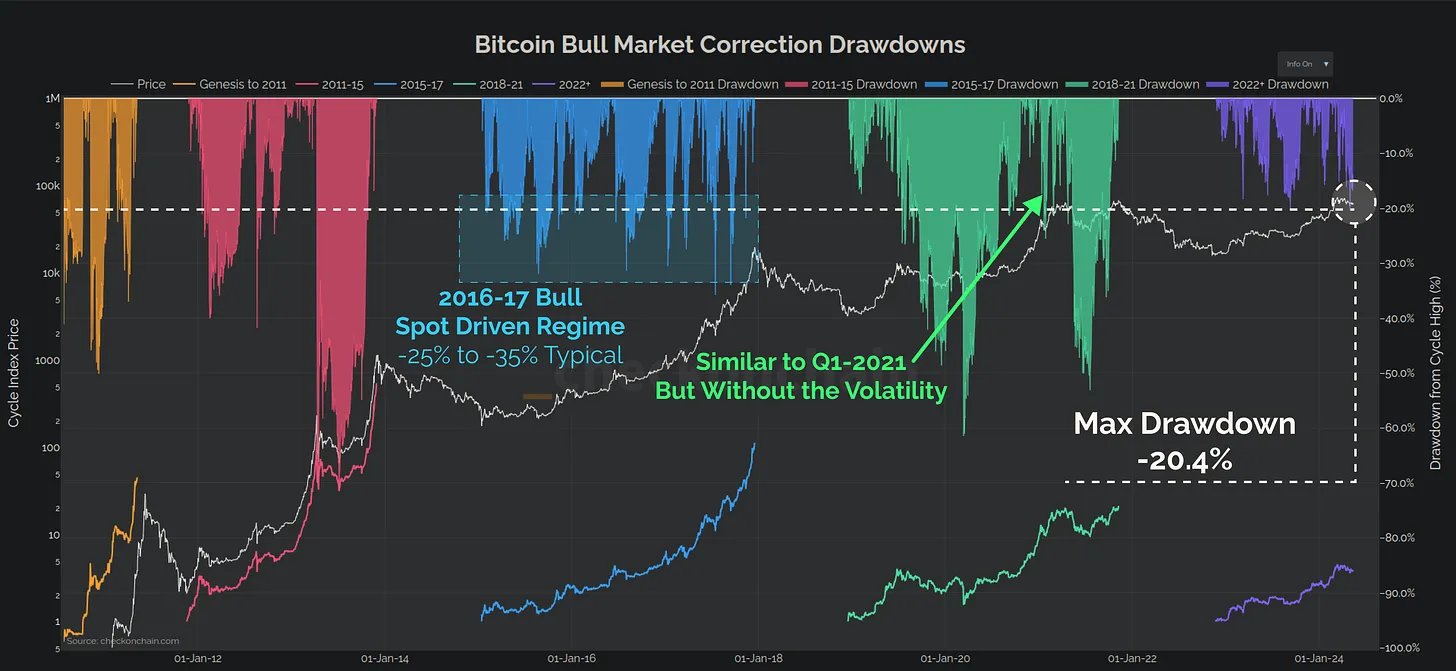
Despite such substantial market sales, Bitcoin has demonstrated resilience with a relatively modest price correction of just -20%. This suggests that the foundational support levels for Bitcoin are stronger than what surface-level market movements might imply.
A striking aspect of Check’s analysis is the transformation in Bitcoin’s volatility profile. “The overall realized volatility profile for Bitcoin is half what it was in 2021, and 3x smaller than 2017,” states Check. This trend indicates a growing maturity within the Bitcoin market, reflecting its evolution into a more stable asset over time compared to its early years.
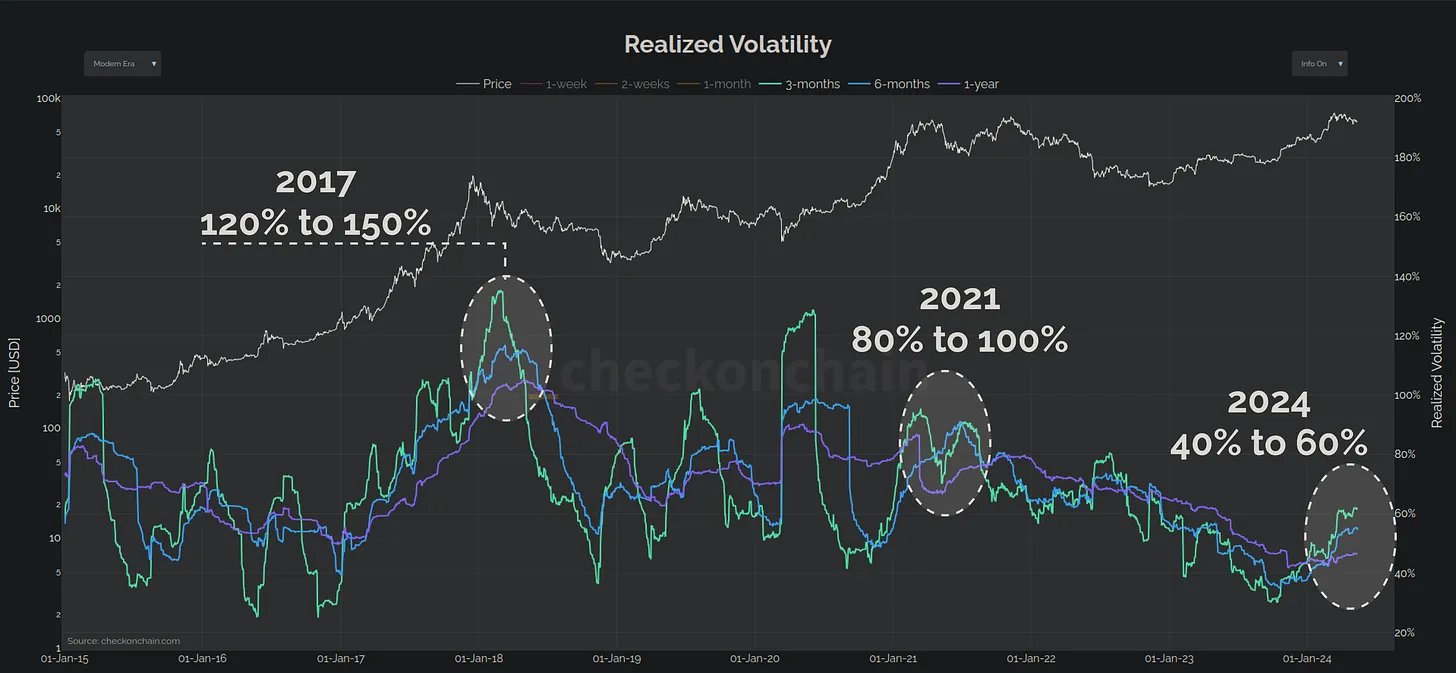
Check counters the typical narrative surrounding Bitcoin’s volatility: “What a lot of people forget however is that Bitcoin is volatile to the upside. Volatility to the upside is good!” He posits that the current increment in volatility is moderate and suggests that the market is still in the early phases of a bull run, rather than nearing its end.
A critical tool in Check’s analysis is the Short-Term Holder MVRV (STH-MVRV) Ratio, which he uses to gauge market sentiment and phases. According to Check, this ratio consistently finds support at 1.0 and resistance at 1.4 during stable uptrends. Stability is maintained as long as the ratio remains within these bounds. “Only when it breaks above this ceiling do things become unstable,” Check notes, which could signal a transition to bearish conditions.
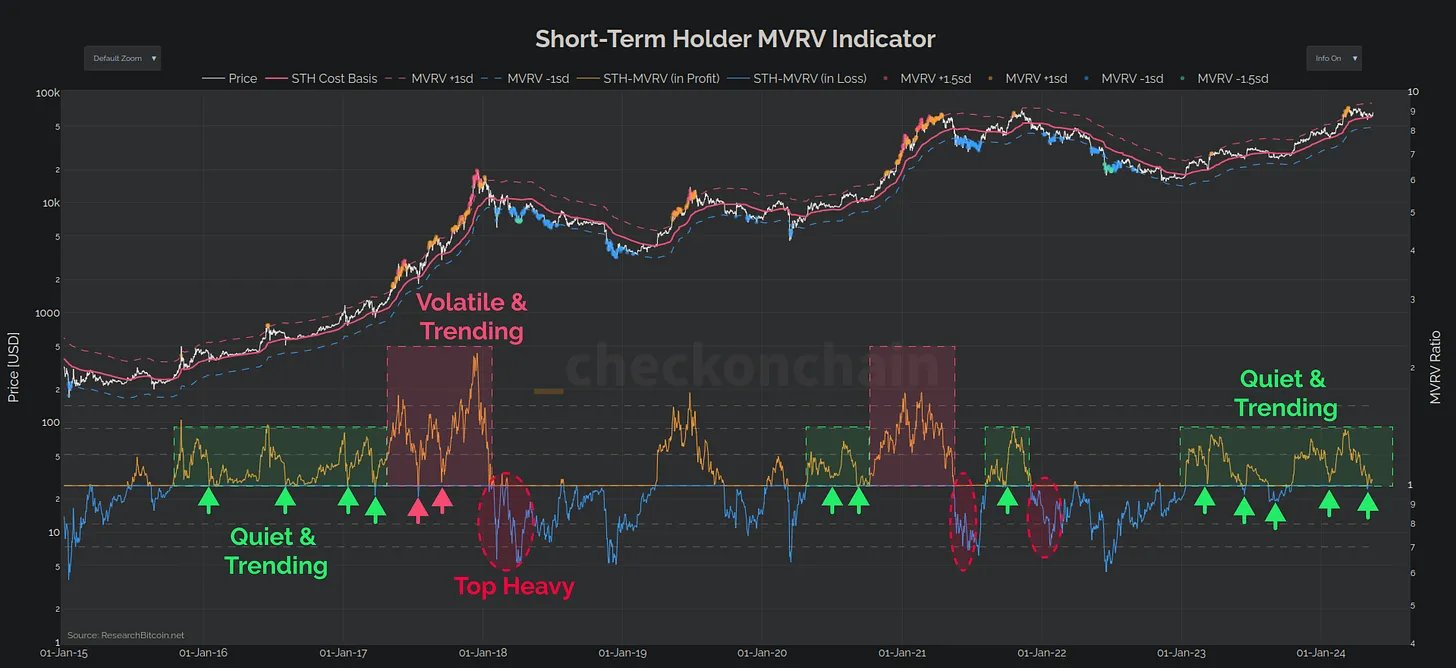
Despite the sell-off that brought Bitcoin down to k, Check observes that this has not significantly dented the profitability of short-term holders. “The magnitude of Unrealised Loss was very much in line with bull market corrections, calming fears of a top-heavy market.”
He further highlights that several of the local top buyers panic sold their Bitcoin at the lows, an action he interprets as beneficial for the correction phase, serving to stabilize the market by shaking out weak hands.
Expanding his analysis, Check refutes the criticism that Bitcoin’s volatility makes it a less viable asset. He points to a chart comparison of Bitcoin’s 30-day volatility against top-performing US stocks, showing that Bitcoin’s volatility is well within a manageable range.
Furthermore, he discusses the lower realized volatility of the SPY index, attributing it to the “out sized performance of the Magnificent-7,” which is counterbalanced by the poorer performance of the other components.
By highlighting the structural aspects of the current “Quiet and Trending” market phase, Check offers a refined perspective on how Bitcoin is navigating its maturation pathway, balancing between its speculative origins and its potential as a mainstream financial asset.
He concludes, “Overall, the Bitcoin uptrend in 2023-24 looks fairly structured, following stair-stepping rally-consolidation-rally pattern. However, as the charts above show, volatility tends to pick up during a consolidation, and that can lead to instability.”
At press time, BTC traded at ,288.
Is Trader Joe (JOE) A Hidden Gem Poised to Outperform Uniswap (UNI)?
In decentralized finance (DeFi) and trading, Uniswap has long reigned as a dominant force. However, a recent analysis by Lark Davis, a Bitcoin (BTC) investor, seems to suggest Trader Joe, a decentralized exchange (DEX) on Avalanche–a highly scalable blockchain and Ethereum’s competitor, could eventually emerge as a formidable competitor, even overtaking Uniswap.
Is Trader Joe Undervalued Relative To Uniswap?
In a post on X on December 12, Davis noted a discrepancy in the relative valuation between JOE and UNI, which serve as governance tokens of Uniswap and Trader Joe. Specifically, the investors noted that Trader Joe’s handles around 0 million daily trading volume on Avalanche alone.
On the other hand, Uniswap processes approximately .6 billion in daily volume across the Ethereum mainnet and Arbitrum, the largest layer-2 platform by total value locked (TVL) by Ethereum.
Davis further noted that despite this “small” difference in trading volume, Trader Joe’s has a market capitalization of only 8 million. Meanwhile, Uniswap has a market cap of .6 billion, according to CoinMarketCap data.
Even with relatively narrow average trading volume, the huge difference in market capitalization suggests that JOE is significantly undervalued relative to UNI. Accordingly, this gap will likely be narrowed in the future, with JOE appreciating versus UNI, possibly benefiting holders.
JOE Yields Versus UNI’s Governance: Which Token Has An Edge?
Davis also pointed out JOE’s potential, saying the token rewards holders with USDC yields. This is different from UNI, where holders can vote on proposals and nothing else. In the investor’s preview, besides the undervaluation, this feature could further enhance JOE’s appeal, even contributing to its upside potential.
As the crypto market recovers, Avalanche might also present additional advantages to traders and, therefore, Trader Joe. The modern blockchain is scalable and has relatively low fees regardless of network activity. With crypto prices expanding, Ethereum gas fees have been rising in tandem, discouraging mainnet transfers. This has rerouted activity to layer-2s like Arbitrum and competing platforms, including Avalanche.
When writing on December 12, DeFiLlama data shows that Trader Joe has a TVL of 9 million, of which most assets are tied to Avalanche. Only million is on Ethereum. JOE has been on an uptrend, rising 170% from October 2023 lows. The token is cooling off, looking at price action on the daily chart.
The Hidden Signals: Bitcoin’s On-Chain Data Points To Bullish Outlook, But There’s A Catch
Santiment, a leading blockchain intelligence platform, has recently provided insights pointing to a favorable short-term scenario for Bitcoin (BTC). However, according to other signals that seem ‘hidden,’ there’s a catch.
These on-chain metrics can serve as the north star for investors looking to strategize their next steps. However, according to another metric, though recent revelations by Santiment might hint at continued positive momentum for Bitcoin, there’s also a possible contrary move that could play out.
Bitcoin Sentiments Bullish On-Chain Indications
Santiment’s recent post revealed a positive narrative for BTC’s immediate future. One of the key metrics supporting this bullish outlook is the significant number of active Bitcoin addresses.
It is worth noting that an increase in active addresses can indicate enhanced adoption, investor interest, and overall network health. Furthermore, a surge in previously dormant tokens moving actively hints at a renewed trader interest.
According to Santiment, such activity has often coincided with bullish trends, making this an essential metric to monitor.
If you’re concerned about a #crypto retrace, note that #Bitcoin still maintains a high pace of active addresses. Additionally, the top market cap asset is seeing a high level of dormant tokens now moving, typically synonymous with #bullish conditions. https://t.co/bvjDL2Shga pic.twitter.com/NvxKkQpkg8
— Santiment (@santimentfeed) October 26, 2023
Given these disclosed metrics by Santiment, Bitcoin may still have more rallies to squeeze out. However, to add another layer of intrigue to the current market scenario is the behavior surrounding meme coins, especially PEPE.
According to Onchain Capital co-founder and Crypto Banter host, Ran Neuner, meme coins, with their viral nature and swift price movements, sometimes act as a barometer for market sentiment, albeit unconventional.
PEPE’s Performance: A Market Temperature Check?
While Santiment’s report offers optimism, some market observers utilize unique indicators to sense potential market shifts. PEPE, a meme coin, has recently caught the attention of several prominent crypto figures.
Ran Neuner recently mentioned that PEPE might act as an indicator of an overheated market. The logic? When traders and investors flock to such tokens, and they see significant price pumps, it might be a sign of excessive optimism in the market. An event to walk with caution.
If you want to know when a pull back is coming, just watch $PEPE. It’s literally an index for when the market is getting overheated. When people are confident enough to go there and it pumps, that’s your sign to exit. Works every time. pic.twitter.com/vMcqiddHwp
— Ran Neuner (@cryptomanran) October 26, 2023
Notably, PEPE has surged by more than 80% in the past week. The meme coin has soared from a low of .00000650 seen last Friday, to as high as .00000118 at the time of writing. Following the recent increase in price, PEPE is currently down 1.1% in the past 24 hours.
Furthermore, in what seems to complement Neuner’s proposed indicator, Bitcoin has seen quite a notable retrace from its recent spike above ,000. The asset currently trades at ,620, at the time of writing down by 1.1% in the past hour.
Featured image from ShutterStock, Chart from TradingView
Bitcoin’s Hidden Threat? Miner Revenue Sent To Exchanges Surges Over 300%
The world’s flagship crypto, Bitcoin (BTC), is showing some signs of tension. While external events frequently steer its course, the latest headwinds arise from within its mining community, as recent data suggests mounting selling pressure from Bitcoin miners.
Miles Deutscher, a seasoned crypto analyst, has been vocal about this emerging trend, casting light on what might be a significant underlying issue in the Bitcoin realm. Given the innate mechanics of Bitcoin, miners play a pivotal role not just in transaction verification but also in the coin’s overall market dynamics.
Selling Pressure Amplified By Miners
There’s currently an escalating concern in the Bitcoin community. Miners, the entities ensuring Bitcoin’s transactional integrity and security, appear to be offloading their holdings at an unprecedented rate.
Glassnode, renowned for its report on blockchain data analytics, has revealed that miner revenue sent to exchanges has skyrocketed, marking a new all-time high of 315%.
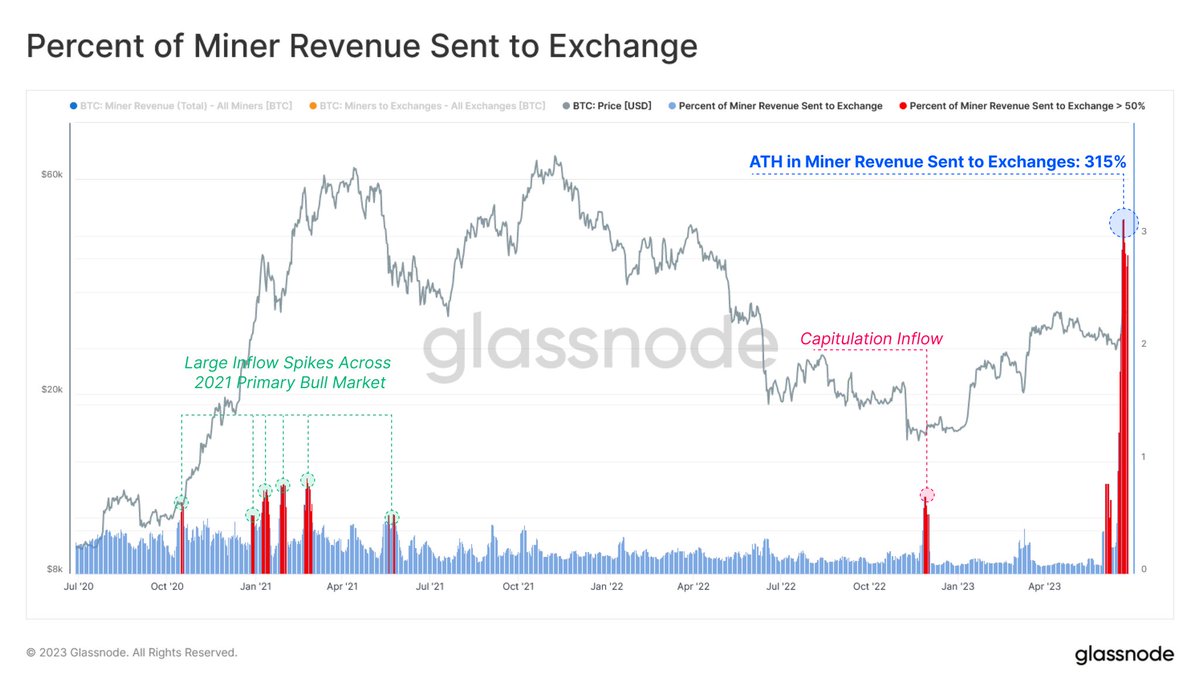
Such statistics beckon inquiries. Deutscher’s analysis points toward several factors that could be prompting this sell-off converging to produce this scenario. According to Deutscher, Bitcoin’s all-time high hash rates, peak mining difficulty levels, and escalating operational costs have squeezed miners.
One of #Bitcoin‘s biggest supply headwinds right now (that no one is taking about) is the increasing miner sell pressure.
ATH hash rates, peak difficulty + rapidly rising energy prices have combined to heavily affect mining profitability.
With rewards set to be cut in half via… pic.twitter.com/HlL2nuendj
— Miles Deutscher (@milesdeutscher) September 28, 2023
With the profitability of mining endeavors getting pinched and the next halving event looming on the horizon, it’s plausible that miners seek to liquidate their BTC holdings. Deutscher explained such sales are essential for these miners to maintain operational fluidity and ensure their ventures remain viable.
Implications For The Broader Bitcoin Market
With Bitcoin being decentralized, every actor, from individual hodlers to large-scale miners, plays a part in its market dynamics. As miners dispatch more BTC holdings to exchanges, they inadvertently ramp the selling pressure. If it persists, such a trend can exert a downward force on Bitcoin’s price.
However, it’s worth noting that this is just one piece of a vast jigsaw. While miners’ selling pressures are influential, other macro factors, such as approving a spot BTC Exchange Traded Fund (ETF), regulatory landscape, and market sentiment, will influence Bitcoin’s journey ahead.
Meanwhile, Bitcoin has seen a slight bullish trajectory of 2.2% over the past day. The asset currently trades for ,828 at the time of writing, with a 24-hour trading volume of .2 billion and a market cap of 3.9 billion.
Featured image from Unsplash, Chart from TradingView
DOJ Action Against Binance: A Hidden Blessing For Bitcoin And Crypto Markets?
The looming prospect of a U.S. Department of Justice (DOJ) action against Binance, the largest crypto exchange, may hold a silver lining for Bitcoin and the broader markets. Even if this sounds crazy at first, there are good arguments for it.
Rumors have been swirling for weeks about a potential DOJ action against Binance, a threat that has cast a long shadow over the markets, leading to increased volatility and uncertainty among investors. Yesterday’s report by Semafor has rekindled the rumor, but also gave it a new perspective, hinting that these developments may be a blessing in disguise for Bitcoin and crypto markets.
According to the Semafor report, the DOJ is contemplating fraud charges against Binance but is also weighing the potential repercussions to consumers and the crypto market at large. Citing sources familiar with the matter, the report suggests that federal prosecutors are concerned that an indictment could trigger a “bank run” similar to the calamitous fate that befell the now-bankrupt FTX platform.
This fear arises from the concern that a potential indictment could lead to a rapid withdrawal of funds, causing consumers to lose their money and potentially trigger a wider panic in the Bitcoin and crypto markets. To circumvent such a catastrophe, the prosecutors are exploring other options like levying fines or establishing deferred or non-prosecution agreements.
What Does This Mean For Bitcoin And Crypto Markets?
Interestingly, some crypto market analysts and commentators view this ongoing saga as a potential boon. Macro analyst Alex Kruger, in a recent Twitter post, speculated, “Too Big to Jail? Call me crazy but this seems bullish if true.” This statement captures the sentiment that if Binance is considered too important to be hit with crippling charges, the DOJ could explore less harmful alternatives.
A similar view is held by renowned analyst Pentoshi, who said, “It doesn’t mean they won’t drop the hammer either. I think calling it “bullish” is a bit extreme since they are considering dropping the hammer. And if not billions in fines and CZ likely gone. But I def don’t think it’d as bearish as headlines first said at all. Bullish would be no DoJ involvement.”
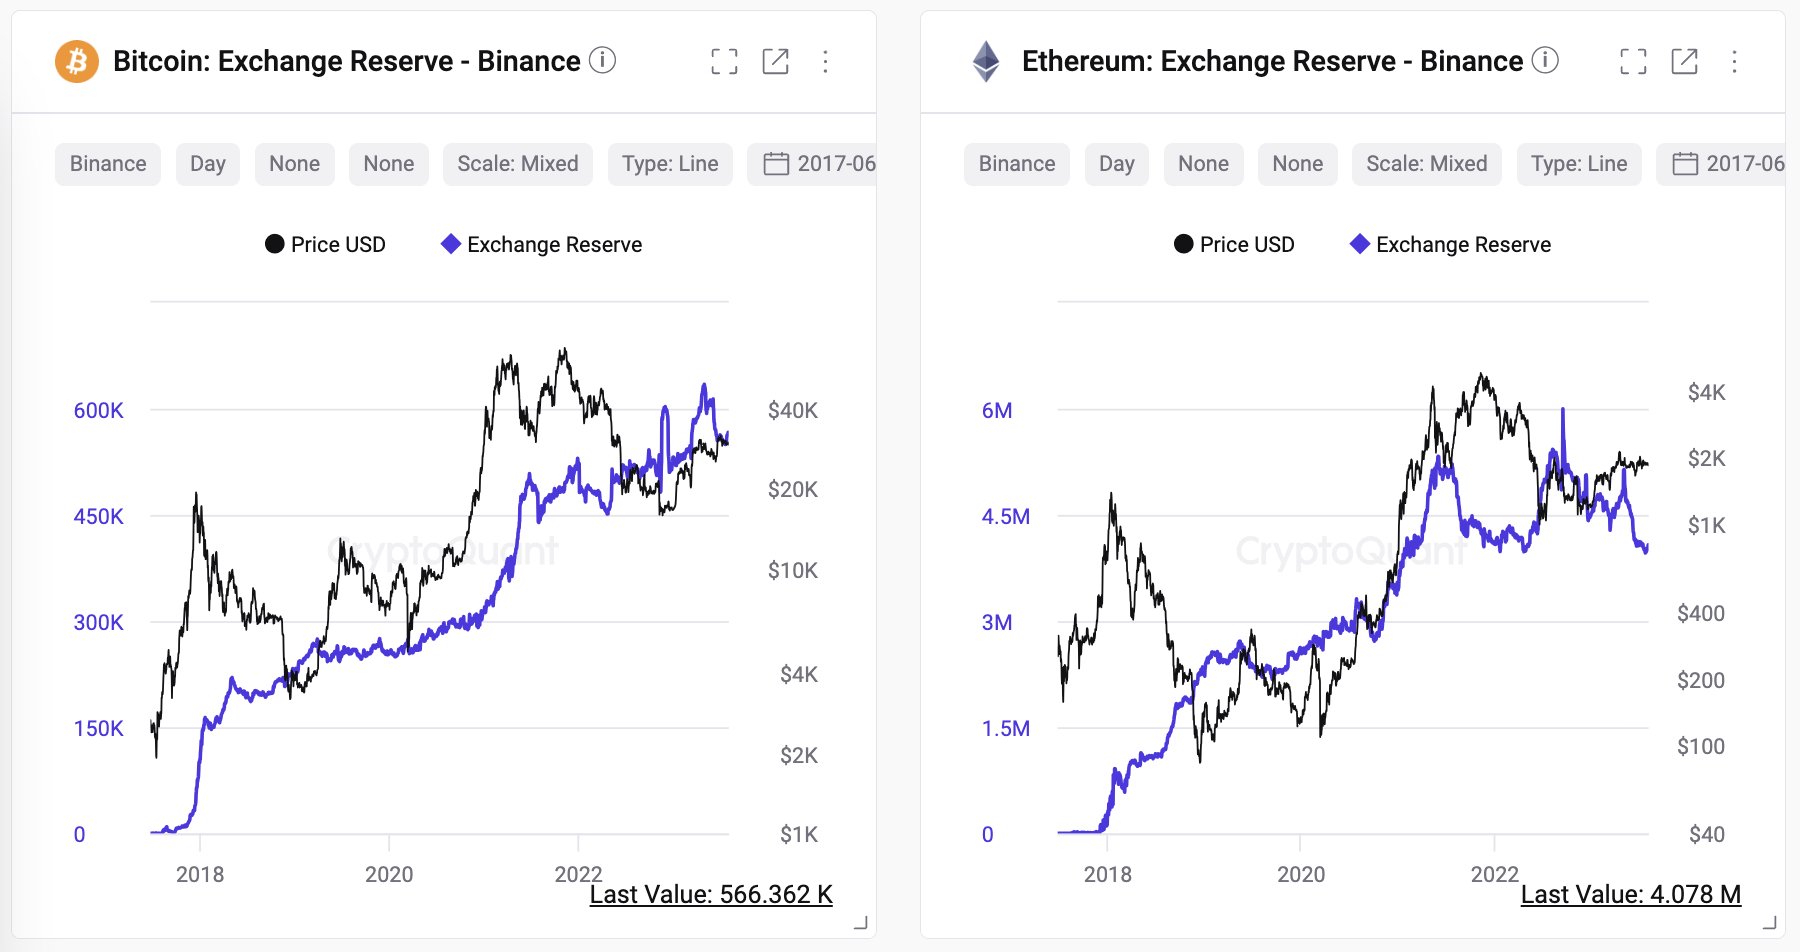
The prospect of the DOJ acting against Binance could also provide a much-needed clarity to the market. If Binance were indeed vulnerable to a bank run, it would quickly become apparent whether the exchange holds sufficient reserves.
However, so far, Binance has impressively weathered previous “stress tests”, as highlighted by CEO “CZ” in a Twitter post in mid-December last year after the Mazars audit rumors, stating, “We saw some withdrawals today (net .14b ish). We have seen this before. Some days we have net withdrawals; some days we have net deposits. Business as usual for us.”
This sentiment is echoed by CryptoQuant CEO Ki Young-Ju who shared data supporting the strength of Binance’s user balances despite constant rumors of insolvency. He stated:
I’ve heard about the ‘bank run/insolvency risk on Binance’ a hundred times for years, but their user balances always tell a different story.
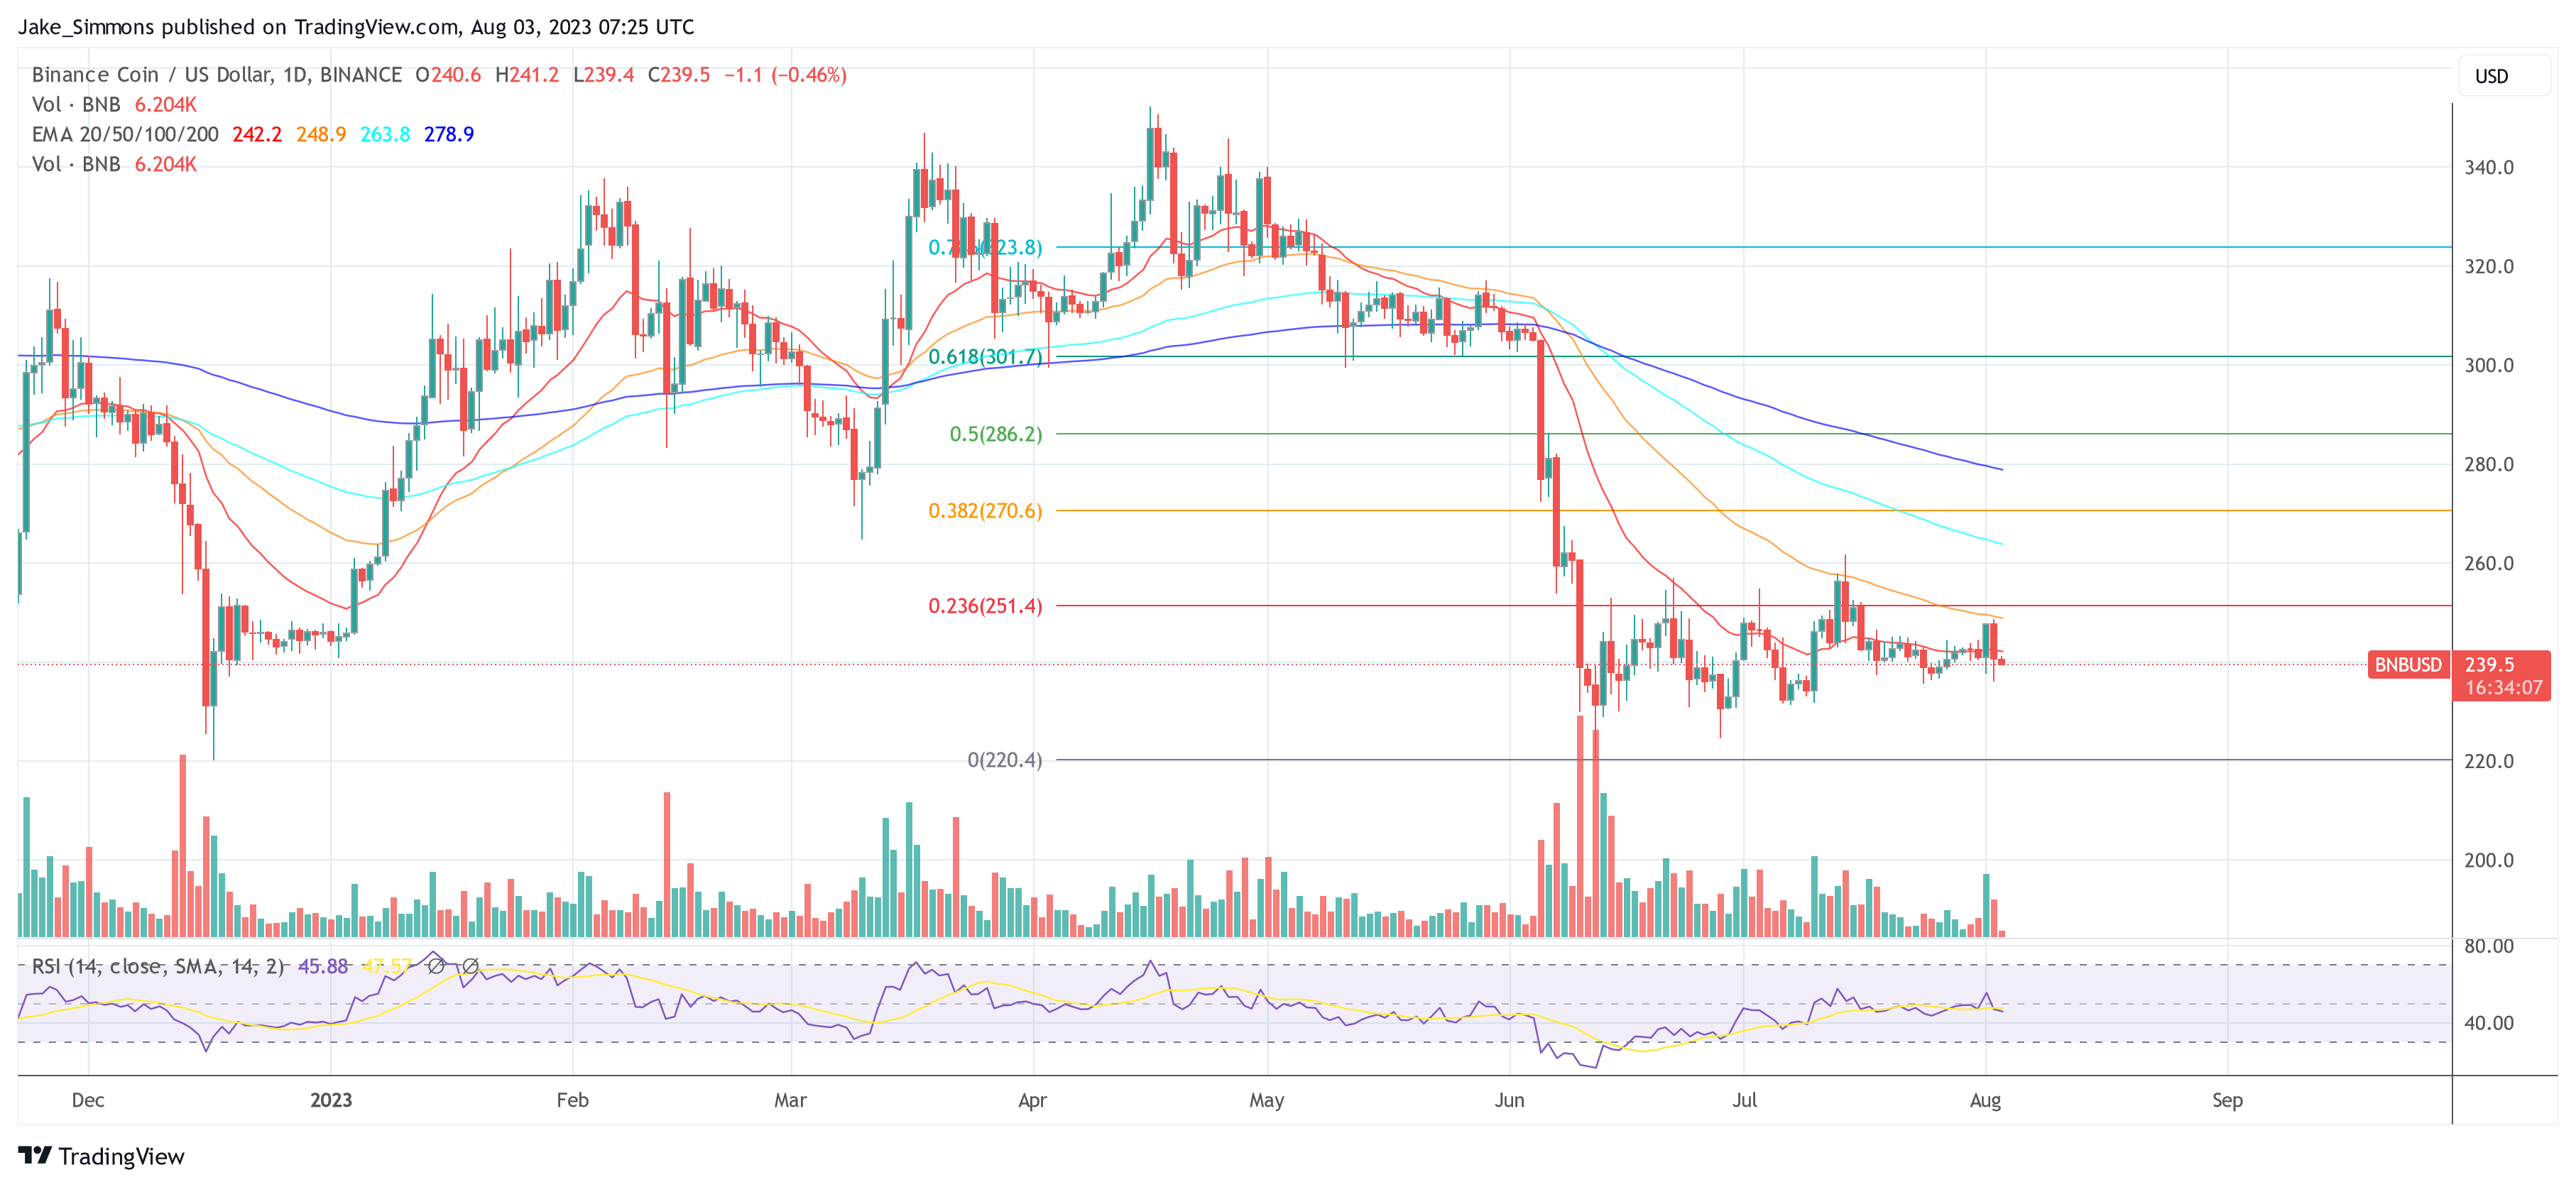
At press time, the BNB price stood at 9.5.
Hidden Treasure: Every Modern Copy of macOS Contains a Copy of Bitcoin’s White Paper

On April 5, 2023, the independent blogger Andy Baio published a post on his Waxy Blog that explained every version of macOS from Mojave 10.14.0 to the current version hosts a copy of Satoshi Nakamoto’s seminal Bitcoin white paper. Mac users can type a simple command in the terminal, and all nine pages describing Nakamoto’s invention will appear in a PDF version in the built-in image viewer, Preview.
Blogger Discovers Bitcoin White Paper Hidden on Every macOS 10.15 or Later
While celebrating Satoshi Nakamoto’s alleged April 5th birthday, bitcoin supporters discovered that many Macintosh computers running the macOS operating system contain a complete version of the seminal Bitcoin white paper.
The initial discovery was revealed in a blog post called “The Bitcoin White Paper Is Hidden in Every Modern Copy of macOS” on Andy Baio’s Waxy Blog. The independent blogger found the hidden file while fixing his printer and confirmed his findings by consulting “over a dozen Mac-using friends to confirm.”
After typing the command in the terminal and using a Mac with macOS 10.15 or later, the Bitcoin PDF should open in Preview, according to Baio’s explanation. The blogger also provides instructions on how to access the file via the operating system’s library folder for those who are not familiar with the macOS terminal.
“Of all the documents in the world, why was the Bitcoin white paper chosen?” Baio asked in his blog post. Baio also discovered that the Bitcoin white paper had been previously found and written about in the Apple community discussions forum.
However, the news never made it to the bitcoin community over the last five years. After Baio published his blog post, the news went viral on social media. No one knows exactly why Apple has hidden the Bitcoin white paper in the operating system, but it has pleased the crypto community. Bitcoin.com News further verified that the white paper file was located on two Macs that our news desk tested.
What are your thoughts on Apple including a copy of the Bitcoin white paper in every modern copy of macOS? Do you think it was a deliberate move or just a coincidence? Let us know in the comments section below.
Reddit User Discovers 7zip File Possibly Linked to Julian Assange Hidden in Bitcoin Blockchain
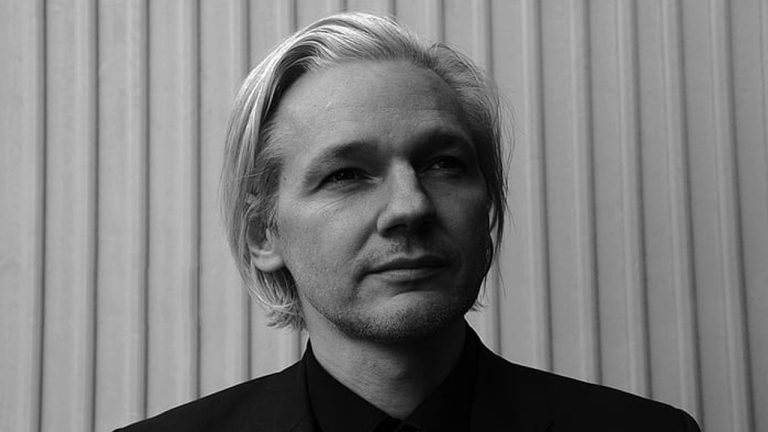
According to a post on the Reddit community r/bitcoin, an old file was discovered that may be linked to Julian Assange, the whistleblower and founder of Wikileaks. The encrypted 7zip file is in the output script from a transaction that took place on Jan. 5, 2017, and was mined at block height 446,713.
Speculation Surrounds Purpose of 7zip File Called ‘Julianassange.Txt’ Found in Bitcoin Blockchain
Amid the thousands of inscriptions added to the Bitcoin blockchain via Ordinals, a 7zip file possibly linked to Wikileaks founder Julian Assange was recently discovered. A Reddit user under the name “u/sprxzk34620” informed the r/bitcoin subreddit of the discovery. The post stated, “An encrypted 7zip file possibly related to Julian Assange is hidden in the Bitcoin blockchain.” The author also noted that the file could be obtained by splicing the pubkhash seg of all the output scripts from a specific transaction.
“The encrypted 7zip file contains a file named ‘Julianassange.txt,’ but attempts to crack the file have failed,” added the Reddit user. Commenters on the Reddit post asked why Assange would add this to the Bitcoin blockchain and some referred to speculation that he created a “dead man’s switch.” “It could be an encrypted link to the switch or files exposing secrets,” wrote one person. Others were doubtful and stated that a zip file named “Julianassange.txt” sounds like a hoax.
Coincidentally, the Jan. 5, 2017 transaction with the 7zip file occurred five days before Assange read the Bitcoin blockchain hash from block height 447,506 in a recorded video. At the time, many believed that the whistleblower used this tactic to prove he was alive. Despite being alive, Assange stated that he was not okay while he was confined in the Ecuadorian embassy in London.
“Don’t take some cryptographic proof as evidence that I am okay,” he emphasized at the time. “I’m not. I have been held here for eight years. I haven’t been okay the entire time.” Since then, Assange’s Ecuadorian asylum was revoked and he was arrested on April 11, 2019, when police raided the embassy. The contents of the 7zip file are unknown until someone successfully cracks it, as it may not belong to or be associated with Assange at all.
The Reddit post written by u/sprxzk34620 ended with a heated discussion about whether adding arbitrary data to the Bitcoin blockchain through Ordinals was a legitimate practice, as it has sparked controversy among some bitcoin advocates. “If everyone is going to post stupid cat JPEGs on the blockchain, I can keep buying new hard drives for my node … F*** that sh**. Keep it compact folks,” one Redditor stressed.
What do you think the contents of the encrypted 7zip file could reveal? Let us know your thoughts about this subject in the comments section below.
Why Hidden Bitcoin Bulls Could Be Ready To Charge
Bitcoin price is attempting its first major recovery since plunging below ,000 per BTC during the recent crypto market contagion. A hidden bullish divergence could indicate that although the selloff was extreme, bulls have been lying in the wait and will soon begin to charge.
Here is closer look at the potential bullish continuation signal on BTCUSD weekly price charts.
Crypto Bulls Lie In Wait, Soon Could Be Ready To Charge
Bitcoin became a household name in late 2017 after reaching nearly ,000 per coin and sent the entire crypto market on a historical bull run. After a long bear market, prices were expected to appreciate significantly.
The now infamous stock-to-flow model projected the top cryptocurrency to have reached well over 0,000 per BTC by now. Yet instead, prices retraced back to 2017 levels. Many altcoins corrected back to prices from 2013.
Related Reading | How Weekly RSI Could Suggest The Bitcoin Bottom Is In
Although the selloff took more than 74% out of the price of Bitcoin, patient bulls may have been waiting and planning their next move. A hidden bullish divergence on BTCUSD weekly RSI has formed from the Black Thursday low that took the leading cryptocurrency to under ,000 per coin.
The plunge back then acted as a spring resulting in the 2020 bull run and new all-time highs throughout 2021. With a potential continuation signal on the weekly RSI, is Bitcoin ready to pick up where it left off?
The weekly RSI reached the most oversold conditions ever | Source: BTCUSD on TradingView.com
Does This Bitcoin RSI Hidden Bullish Divergence Signal “Continuation?”
The weekly Relative Strength Index is exhibiting a potential hidden bullish divergence. In the example above, it demonstrates that an indicator makes a lower low, while price action makes a higher low. This type of behavior is typically indicative of continuation in the primary trend – which for Bitcoin has almost always been up.
The same weekly RSI has also reached the most oversold conditions in the cryptocurrency’s short price history. Even better for bulls, the RSI has risen back out of oversold territory and above a reading of 30. The chart above also depicts the RSI potentially breaching the RSI-based moving average.
Related Reading | Bitcoin Weekly RSI Sets Record For Most Oversold In History, What Comes Next?
If Bitcoin is to continue its bull run and pick up where it left off, the first major zone to reclaim is ,000. If BTCUSD can reenter the multi-year trading range, bulls could take a shot at the other side of the range near 2021 all-time highs.
But it all depends on this bullish divergence confirming, which is only something we’ll truly know in hindsight.
Weekly #Bitcoin RSI analysis could suggest a bottom is in. What do you think? pic.twitter.com/JSdUlbCo3j
— Tony "The Bull" Spilotro (@tonyspilotroBTC) July 19, 2022
Follow @TonySpilotroBTC on Twitter or join the TonyTradesBTC Telegram for exclusive daily market insights and technical analysis education. Please note: Content is educational and should not be considered investment advice.
Featured image from iStockPhoto, Charts from TradingView.com
NewsBTC
The Hidden Bitcoin Trend Line That Could Save The Bull Run
Today, Bitcoin price sank below ,000 for the first time since September – a price more than 50% lower than what the market was anticipating this time of year.
While the downside has been impossible to ignore, the latest sweep of lows has resulted in a touch of a trend line dating back to the bear market bottom that could keep the bull market intact a bit longer.
Technical Analysis And Framing The Importance Of Trend Lines
When it comes to technical analysis in Bitcoin, trend lines always matter. When such lines hold, it is a sign to the market that it is time to reverse. When they give way, the resulting breakdown and panic is usually dramatic.
For example, losing the horizontal support line of ,000 in late 2018 immediately resulted in a plunge to ,000. Once there, the bear market bottom was put in.
Related Reading | 2022: The Year The Secular Bitcoin Bull Run Could End
It was beginning at that initial bounce that restored hope in Bitcoin, that yet another trend line started. Rather than a trend line drawn across price peaks or troughs, this trend line is drawn across extreme oversold readings on the daily Relative Strength Index.
A long-term RSI trend line could cause a bounce | Source: BTCUSD on TradingView.com
Now Or Never: Bitcoin Bull Run RSI Trend Line Must Hold
As Bitcoin price swept below ,000 on BTCUSD daily charts, the Relative Strength Index tapped a long-term trend line. The line itself has withstood the bear market bottom, Black Thursday, and the 2021 selloff down to K.
Does this latest move down have enough momentum to break through the support line? Or will it hold once again? The reading alone on the RSI suggests conditions are highly oversold – the fourth most extreme since the bear market bottom.
Fourth time is the charm? | Source: BTCUSD on TradingView.com
During the last bull market, there were four total touches of the daily RSI trend line. The fourth was the final touch before the peak of the bull market (green dotted line).
Related Reading | Blast From The Past Bitcoin Fractal Could Suggest A Record Reversal Is Near
The same trend line, once breached, is what led to Bitcoin falling sharply from K to under ,000 in less than one month in early 2018 and kicked off the bear market (red dotted line).
Bitcoin is once again at the trend line. Will the fourth tap prepare the market for liftoff, or will the line break down and a new bear phase begin? It could be now or never for Bitcoin bulls.
Follow @TonySpilotroBTC on Twitter or join the TonyTradesBTC Telegram for exclusive daily market insights and technical analysis education. Please note: Content is educational and should not be considered investment advice.
Featured image from iStockPhoto, Charts from TradingView.com
NewsBTC