 Bitcoin’s price fell beneath the ,000 mark on Monday, declining over 6% against the U.S. dollar. At 1:30 p.m. EDT on June 24, the currency’s price hit an intraday low of ,809 per coin. Bitcoin Struggles Against Bearish Market, Slides to Near K Level This Monday proved tumultuous for bitcoin (BTC), as its price dipped […]
Bitcoin News
Worldcoin to Establish Latam Hub in Argentina Despite Heavy Scrutiny
 Worldcoin, the biometric identification project, has announced a new expansion process in Argentina, where it reportedly will seek to open 50 new locations with eye-scanning hardware. The announcement comes after Buenos Aires indicted Tools For Humanity, the company behind Worldcoin, for including abusive clauses in its service agreements, and a meeting between Worldcoin executives with […]
Bitcoin News
GBTC’s Heavy Withdrawals Result in Net $11.3M Outflow in US Bitcoin ETFs
 The U.S. spot bitcoin exchange-traded funds (ETFs) witnessed an outflow of .3 million during Thursday’s trading sessions, following an inflow of .5 million on Wednesday. Although the majority of funds experienced inflows on Thursday, significant outflows from Grayscale’s Bitcoin Trust (GBTC) eclipsed these gains. Grayscale’s Losses Contrast With Gains On Thursday, GBTC experienced outflows that […]
Bitcoin News
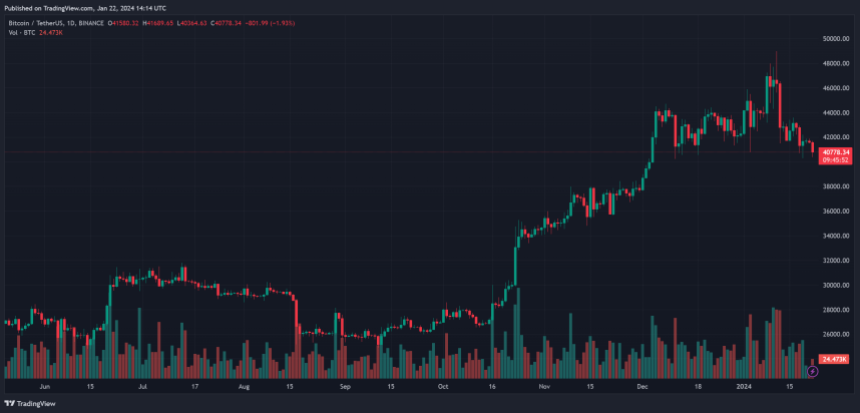
Bitcoin Price “Mad Heavy,” Why A Detour To $30,000 Might Be Imminent
The Bitcoin price took a downside turn over the weekend and seems ready to re-test critical support levels. The downside price action was triggered by a spike in selling pressure following the approval of Bitcoin spot Exchange Traded Funds (ETFs) in the US.
As of this writing, the Bitcoin price trades at ,900 with a 2% loss in the past 24 hours. Over the last week, these losses doubled, with other assets in the crypto top 10 by market underperforming, except for Dogecoin (DOGE), which still records a 4% profit in the same period.
Bitcoin Price Loses Steam, How Low Can BTC Go?
Via the social media platform X, the founder and former CEO of crypto exchange BitMEX, Arthur Hayes, shared a forecast for the Bitcoin price. According to Hayes, BTC seems poised to lose its current levels.
The crypto founder and trader claims that the low timeframe price action will likely push Bitcoin below ,000 and potentially below ,000 if bulls fail to defend the higher area around these levels.
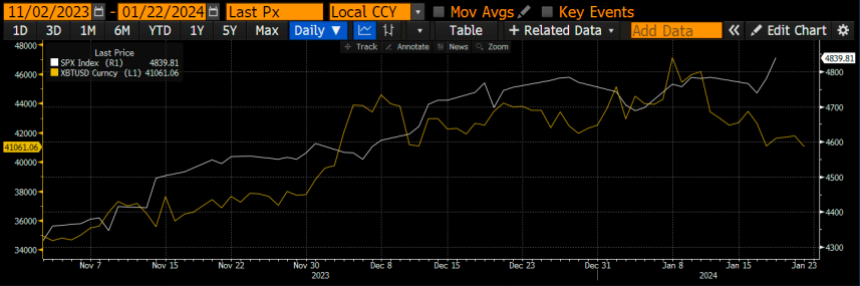
The main issue regarding the current market structure rests upon the liquidity in the Bitcoin market. As seen in the chart below and as pointed out by Hayes, the liquidity in the BTC market has been trending to the downside since the Bitcoin spot ETF was approved.
As a result, and due to the constant selling pressure from the Grayscale Bitcoin Trust (GBTC), the market has been trending to the downside and could maintain this course until the next major macroeconomic event.
On the above, the BitMEX founder stated:
Why has $SPX and $BTC stopped moving up together post US BTC ETF launch? Both are love more $ liq, which one is right about the future? $BTC is telling us that there are hiccups ahead for $ liq, next signpost is 31st Jan US Treasury refunding annc (announcement).
If Bitcoin Goes South, What Levels Could Hold The Line?
A pseudonym crypto analyst showed a cluster of buying orders stacked from the ,819 to the ,000 levels in a separate report. In other words, these levels should present opposition and seem like BTC’s biggest opportunity to bounce back, at least on low timeframes.
In that sense, the analyst stated the following, anticipating a possible short-term recovery, and showing the image below:
Some big zones starting to build up around 41K & 42K. Pretty certain we’ll at least take out that top part somewhere next week. Will see if price sustains after that.

Cover image from Unsplash, chart from Tradingview
Ethereum Price At Risk of Sharp Decline Unless ETH Clears This Heavy Resistance
Ethereum price is slowly moving lower toward the ,585 support against the US dollar. ETH must clear the ,650 resistance to start a recovery wave.
- Ethereum is struggling to stay above the ,600 support zone.
- The price is trading below ,650 and the 100-hourly Simple Moving Average.
- There is a major bearish trend line forming with resistance near ,645 on the hourly chart of ETH/USD (data feed via Kraken).
- The pair could start a fresh increase if it clears the ,650 and ,665 resistance levels.
Ethereum Price Grinds Lower
Ethereum attempted a recovery wave from the ,630 zone. ETH climbed above the ,650 resistance level but upsides were limited, like Bitcoin.
The price struggled to gain pace for a move above the ,665 resistance level. A high was formed near ,654 and the price reacted to the downside. It declined below the ,620 support and even traded close to the ,600 level. A low is formed near ,607 and the price is now consolidating losses.
Ethereum is now trading below ,650 and the 100-hourly Simple Moving Average. There is also a major bearish trend line forming with resistance near ,645 on the hourly chart of ETH/USD.
On the upside, the price might face resistance near the ,630 level. It is close to the 50% Fib retracement level of the recent decline from the ,654 swing high to the ,607 low. The next major resistance is ,650, the trend line, and the 100-hourly Simple Moving Average.
The trend line is close to the 76.4% Fib retracement level of the recent decline from the ,654 swing high to the ,607 low. A close above the ,650 resistance might send the price toward the key resistance at ,665.
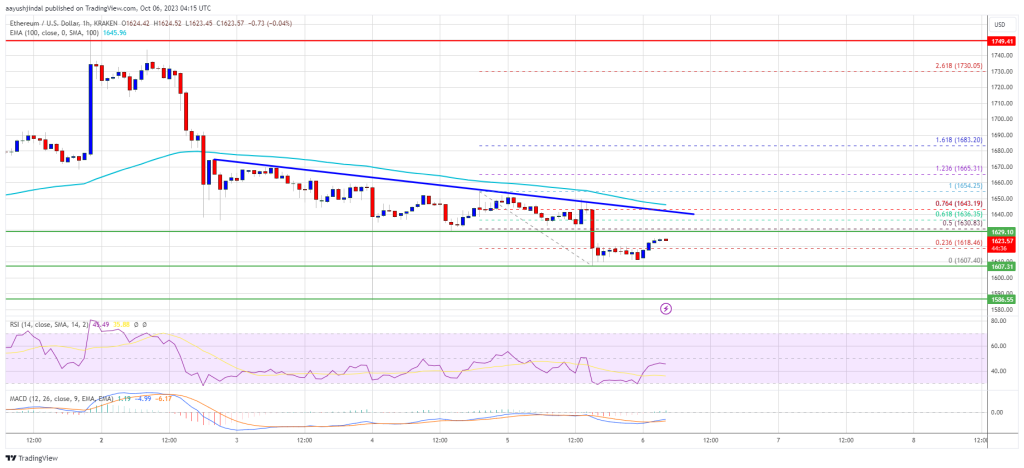
Source: ETHUSD on TradingView.com
To start a steady increase, Ether must settle above the ,650 and ,665 levels. The next key resistance might be ,720. Any more gains might open the doors for a move toward ,750.
More Losses in ETH?
If Ethereum fails to clear the ,650 resistance, it could continue to move down. Initial support on the downside is near the ,610 level. The next key support is ,600.
The first major support is now near ,585. A downside break below the ,585 support might start another strong decline. In the stated case, the price could decline toward the ,540 level. Any more losses may perhaps send Ether toward the ,500 level.
Technical Indicators
Hourly MACD – The MACD for ETH/USD is gaining momentum in the bearish zone.
Hourly RSI – The RSI for ETH/USD is now below the 50 level.
Major Support Level – ,585
Major Resistance Level – ,665
UK Online Safety Bill to Become Law Amidst Heavy Criticism From Civil Liberties Organizations

The U.K. Online Safety Bill, a piece of legislation that seeks to make the country “the safest place in the world to be online,” has been signed by both houses of parliament and will become law soon. Several civil liberties organizations and activists have criticized it due to its possible effects on online privacy and encryption.
U.K. Online Safety Bill Ready to Become Law
The U.K. Online Safety Bill, a piece of legislation that seeks to improve the safety levels of children and adults online, has been passed by both houses of the parliament and is ready to become law. In a press release, the U.K. government stated that the law will make the country “the safest place in the world to be online,” establishing new rules that messaging and social media platforms now have to comply with.
The bill, which takes a “zero-tolerance approach to protecting children and makes sure social media platforms are held responsible for the content they host” by establishing penalties of up to £18 million (.16 million) or 10% of their global annual revenue, has been praised as a milestone by government officials.
Technology Secretary Michelle Donelan stated:
The Online Safety Bill is a game-changing piece of legislation. Today, this government is taking an enormous step forward in our mission to make the U.K. the safest place in the world to be online.
New Criticism
Civil liberties organizations and freedom advocates had criticized the bill before, stating that it posed challenges to platforms affected by the so-called spy clause, which allows Ofcom, the U.K. telecom regulator, to scan the private messages of their users.
The Electronic Frontier Foundation (EFF) stated that, with these new measures, “lawmakers will damage the security people need to protect themselves from harassers, data thieves, authoritarian governments, and others” while doing it in the name of online safety.
Encryption could also be affected, even as Stephen Parkinson, the Parliamentary Under-Secretary of State for Arts and Heritage, stated that it would not be “technically feasible” to go around it. However, Donelan declared on September 7 that the conversation around encryption “could take place” if social media platforms cannot meet the requirements in the bill.
On the encryption issue, the EFF explained that “neither the government’s private statements to tech companies nor its weak public assurances are enough to protect the human rights of British people or internet users around the world.”
What do you think about the U.K. Online Safety Bill? Tell us in the comments section below.
MATIC Risks Heavy Decline If It Falls Below This Price Level, Analyst Says
MATIC, the native token of the Polygon network, has experienced both sides of the crypto market volatility in the last day, with a temporary boost followed by a steady price decline. Over the past 24 hours, the prominent altcoin has had its price bounce between .55 and .56, forming a major consolidation zone.
As many MATIC investors speculate on the token’s next movement, popular crypto analyst Ali Martinez has given an interesting prediction that implies an impending market loss.
MATIC In Danger Of 27% Price Decline
Via an X Post on Monday, Ali Martinez alerted the crypto space that the MATIC token was in a critical price zone, which could result in heavy investor losses.
Related Reading: MATIC Social Sentiment Slides To Negative Territory – What’s The Impact On Price?
Over the last seven days, MATIC has recorded both negative and positive movements, often finding support at the .53-.54 price zone.
If #Polygon loses the .54 support — guarded by 3,770 addresses holding over 70 million $MATIC — it could freefall to .40!
pic.twitter.com/040dv1Mb9P
— Ali (@ali_charts) August 28, 2023
Interestingly, Martinez predicts that if the Polygon native token lost this support level, it would likely fall as low as .40, representing a potential 27% decline from MATIC’s current price.
The analyst further emphasizes the importance of this support level, stating it is “guarded” by 3,770 wallet addresses that collectively own 70.19 million MATIC tokens.
Looking at MATIC’s daily chart, investors may have real cause to pay attention to Martinez’s prediction as the token’s price movement forms a descending channel.
Based on this pattern, MATIC could likely record little gains in the coming days, but its long-term outlook indicates the continuation of its current bearish trend. However, investors are reminded that all price predictions are speculative with no guarantees.
MATIC Daily Active Address On the Rise
On a more positive note for MATIC, the Polygon network has experienced a significant rise in its daily active addresses over the last few days based on data from market intelligence firm Santiment.
Following a steady decline in mid-August that saw this metric fall to around 182,000 on August 20, there has been a notable recovery, with the daily active address count reaching about 264,000 on Monday, August 28. This indicates an increased interest in Polygon despite MATIC’s little price movement in the last week.
Related Reading: Polygon (MATIC) At June Lows Again – Prospects For Bullish Recovery?
In other news, Polygon co-founder Sandeep Naiwal has posted an update on Polygon 2.0 detailing the benefits of MATIC’s proposed upgrade, the POL token.
According to data from CoinMarketCap, MATIC is currently trading at .55 with a 0.05% loss in the last day. However, the token’s daily trading volume is on the green side, rising by 0.52% to be valued at 8.56 million. With a market cap of .16 billion, MATIC is ranked as the 14th largest cryptocurrency.
Shiba Inu Price Analysis: Bearish Pattern Puts Heavy Load On SHIB Advance
The price of Shiba Inu (SHIB) has experienced a downward trend over the past several days. This corrective phase, marked by declining trading volumes, is shedding light on a potential weakening in bearish momentum.
Interestingly, this price action aligns with the emergence of a triangle pattern, a technical phenomenon that often holds significant implications for market trends.
In technical analysis, a triangle pattern refers to a chart pattern formed when the price moves within converging trendlines, creating a triangular shape. This pattern indicates a period of consolidation and indecision in the market, as buyers and sellers reach an equilibrium.
Typically, this pattern is associated with a temporary pause in the prevailing trend, and it often precedes a significant breakout or breakdown.
Shiba Inu Bearish Pennant Formation
According to a recent price analysis, this triangular sideways movement for SHIB comes on the heels of a substantial price drop, raising suspicions of a bearish pennant pattern taking shape.
A bearish pennant is characterized by a brief consolidation period following a sharp decline in price. During this time, the bearish momentum takes a breather, potentially prolonging the correction trendline.
A closer examination of the daily chart reveals a notable rejection from the lower trendline of the pattern. This rejection hints at the possibility of a bullish upswing within the confines of the pattern, suggesting that the SHIB price might be gearing up for a potential reversal.
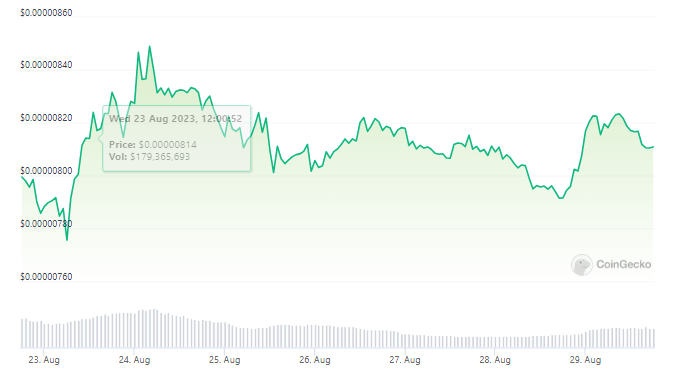
As of the latest data, the current SHIB price stands at .00000814 according to CoinGecko, indicating a 2.1% rally over the past 24 hours. In the span of seven days, SHIB has managed to accrue gains of 3.4%. These numbers, against the backdrop of recent market turbulence, hint at a certain level of resilience within the SHIB token.
Implications Of Significant Token Movements
Ali Martinez, a respected crypto trading chart analyst, has drawn attention to a startling development that could impact SHIB’s trajectory. In a post on X, Martinez noted an extraordinary movement: approximately 2 trillion SHIB tokens were rapidly withdrawn from established crypto exchange wallets within the preceding week. This revelation has set off ripples of speculation and discourse within the digital asset community.
#ShibaInu | A staggering 2 trillion $SHIB tokens have been pulled from known #crypto exchange wallets just this past week. pic.twitter.com/MiWMNUp7jY
— Ali (@ali_charts) August 27, 2023
The swift movement of such a significant number of tokens raises questions about the potential implications for SHIB’s position within the broader crypto market. As market participants grapple with the ramifications of this withdrawal, it remains to be seen how this bold maneuver might shape SHIB’s future price action and overall market sentiment.
With potential bullish signals emerging within this pattern and the intriguing withdrawal of tokens, the coming days could hold decisive clues about SHIB’s direction in a rapidly changing market environment.
(This site’s content should not be construed as investment advice. Investing involves risk. When you invest, your capital is subject to risk).
Featured image from Adobe Stock
Dogecoin Millionaire Explains Why He’s Still Bullish On DOGE Despite Taking Heavy Losses
Investing in cryptocurrencies like Dogecoin can be tricky, as the nascent market is known to be the most volatile in terms of price movement. One day, an investor triples his investment, and the next day, all of it is gone. So knowing when to sell and exit a position can sometimes be challenging.
This is the recent case of a once-DOGE millionaire who has seen the worth of his holdings fall from almost million to ,000. However, despite the ups and downs, this long-time HODLer believes Dogecoin has staying power.
Still Bullish On Dogecoin
Dogecoin has come a long way since its creation as a joke. The cryptocurrency saw its value spike dramatically in 2021, making early investors sudden millionaires in the process. At the peak of its rally, DOGE rose from a market cap of .2 billion to .26 billion in less than five months to reach a price all-time high of .74.
One of these investors who became millionaires overnight as a result of this rise was Las Vegas resident Glauber Contessoto, known as SlumDOGE Millionaire on social media platform X. During the rise of DOGE, this investor saw his holdings reach .9 million and was popularly known as one of the first Dogecoin millionaires.
The hype bubble has since popped, and the value of Dogecoin has toppled, with the cryptocurrency now trading at .06378. This would see Contessoto’s holdings now worth around ,000.
Despite his loss, Contessoto continues to have trust in Dogecoin. According to a social media post, he mentioned how dog theme meme coins have a better chance of spiking than other meme coins.
“I feel like they will rise again,” he said. He said this while noting the success of frog-themed crypto PEPE.
I honestly don’t think Dog themed meme coins are done.
I feel like they will rise again
$PEPE had it’s run, frog was cool
But dogs are where it’s at foreal
— SlumDOGE Millionaire (@ProTheDoge) August 23, 2023


Contessoto is not the only one that has witnessed the value of his DOGE holdings fall dramatically. Another investor, Keith Johnson, who suffered losses, made headlines for filing a 8 billion lawsuit against Elon Musk. Known as the Dogefather because of his support for Dogecoin, Musk’s tweets regarding the crypto have regularly led to price spikes.
What’s Next For DOGE?
Even though Dogecoin has continued to struggle, the meme coin has had its moments this year. In July, DOGE saw a brief spike in price, leading it to become the 8th-largest cryptocurrency by market cap. But while the Dogecoin ecosystem has gathered a huge community, things seem to be calm at the moment.
At the time of writing, DOGE is trading at .06366, down by 6% in the past seven days. However, many DOGE investors hope to see a price spike if DOGE is finally accepted as a payment method on social media platform X.
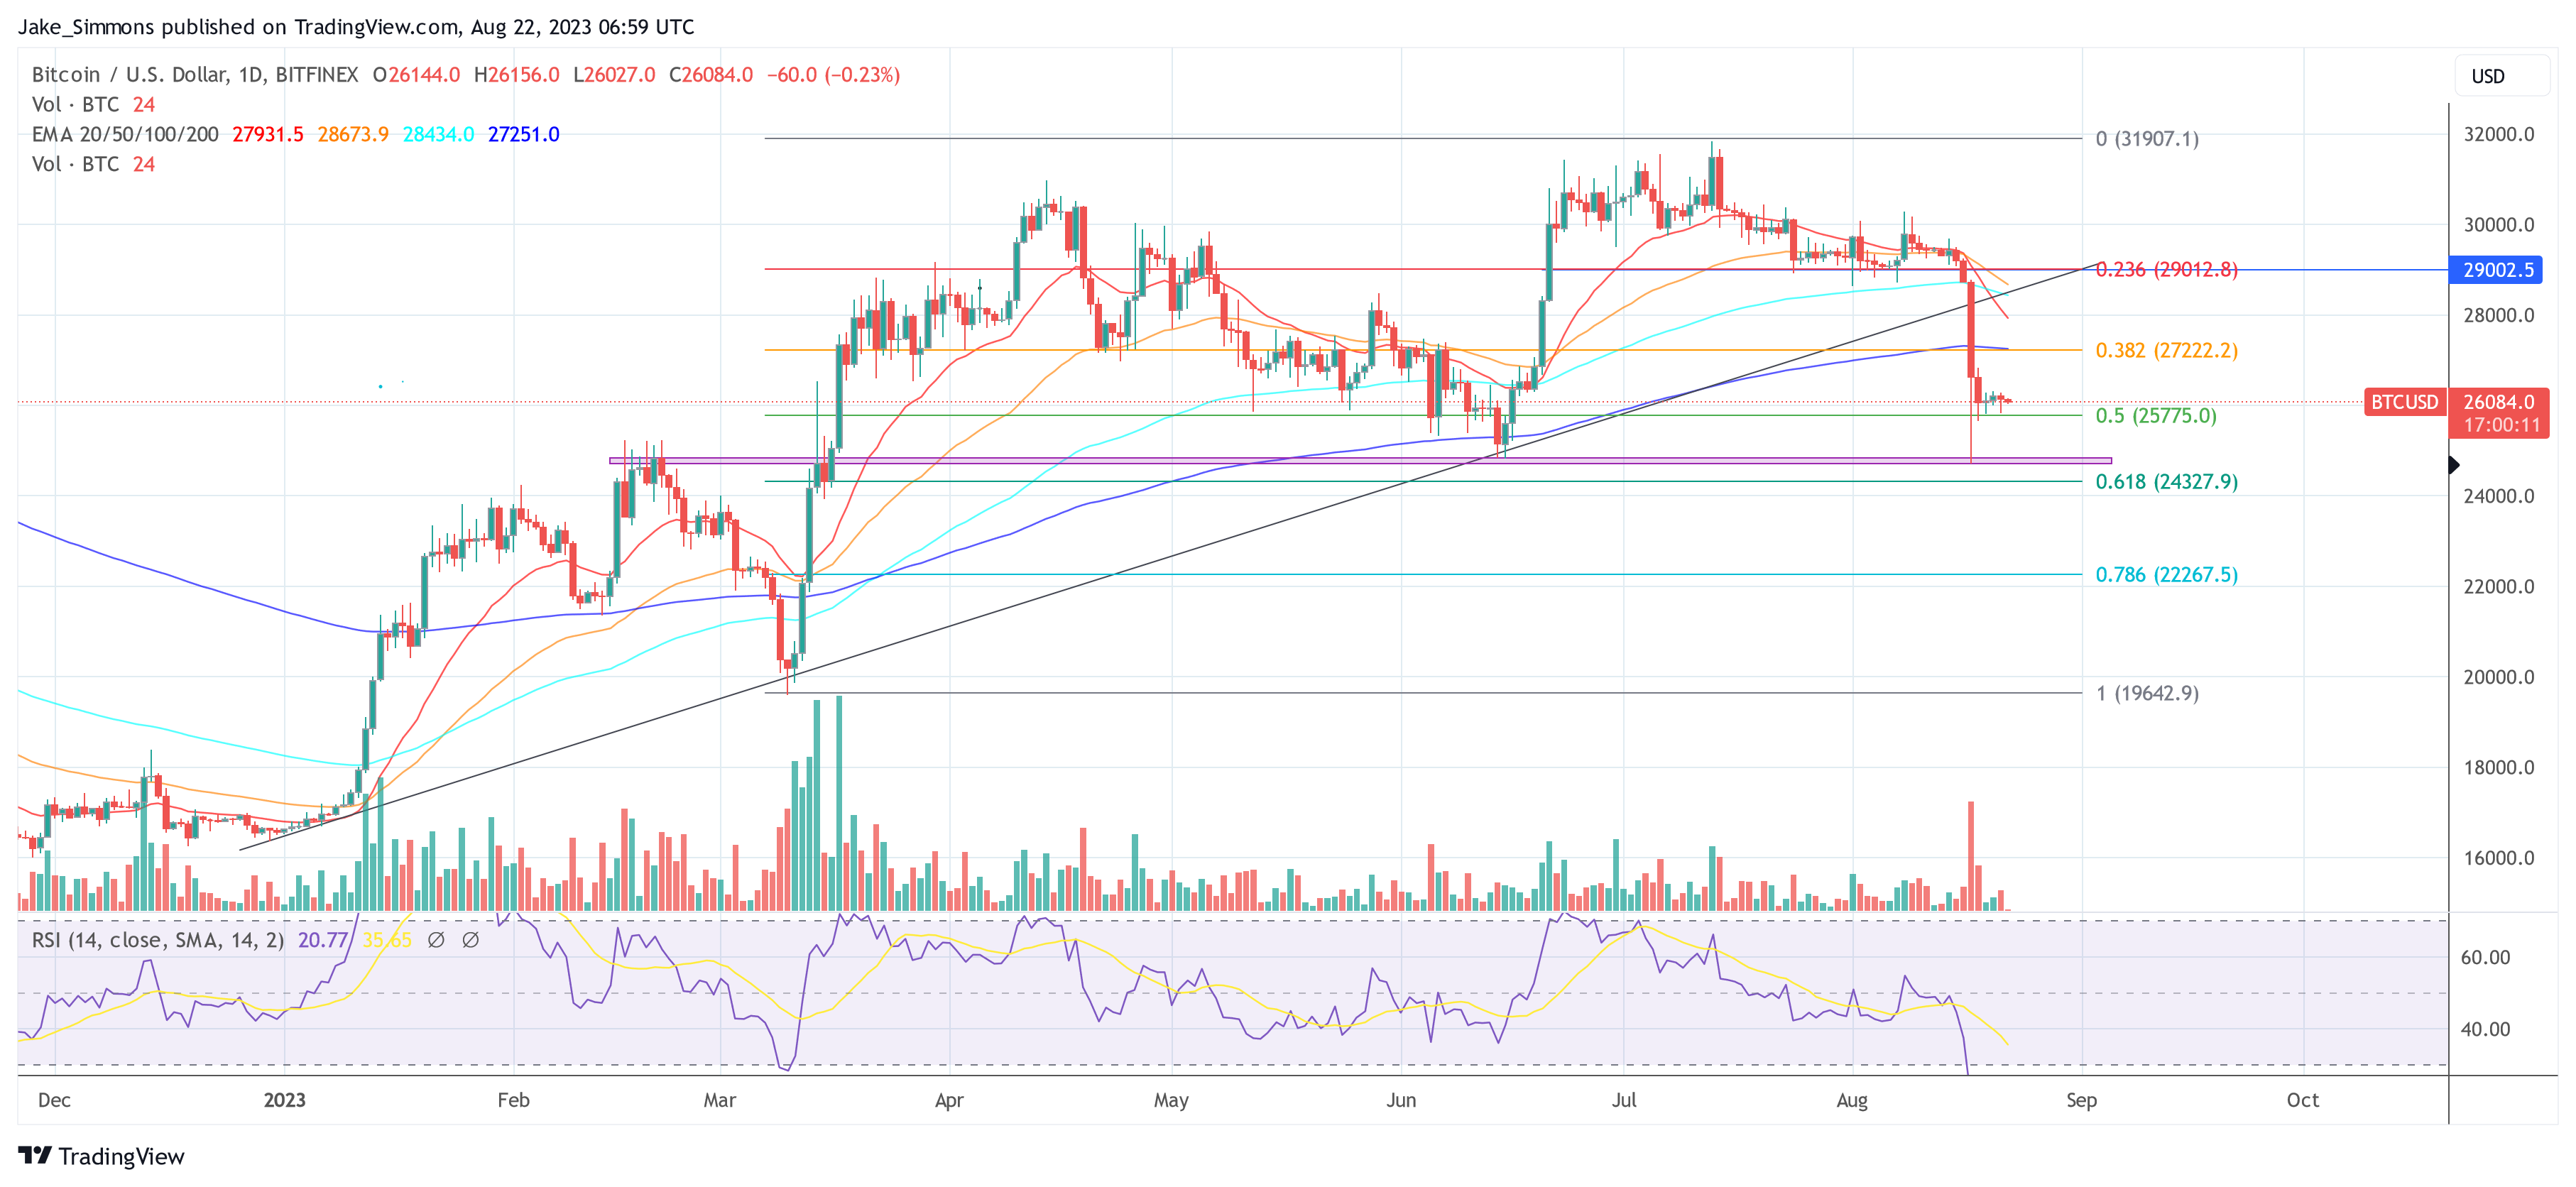
Bitcoin On-Chain Data Suggests Price Is Top Heavy, What It Means
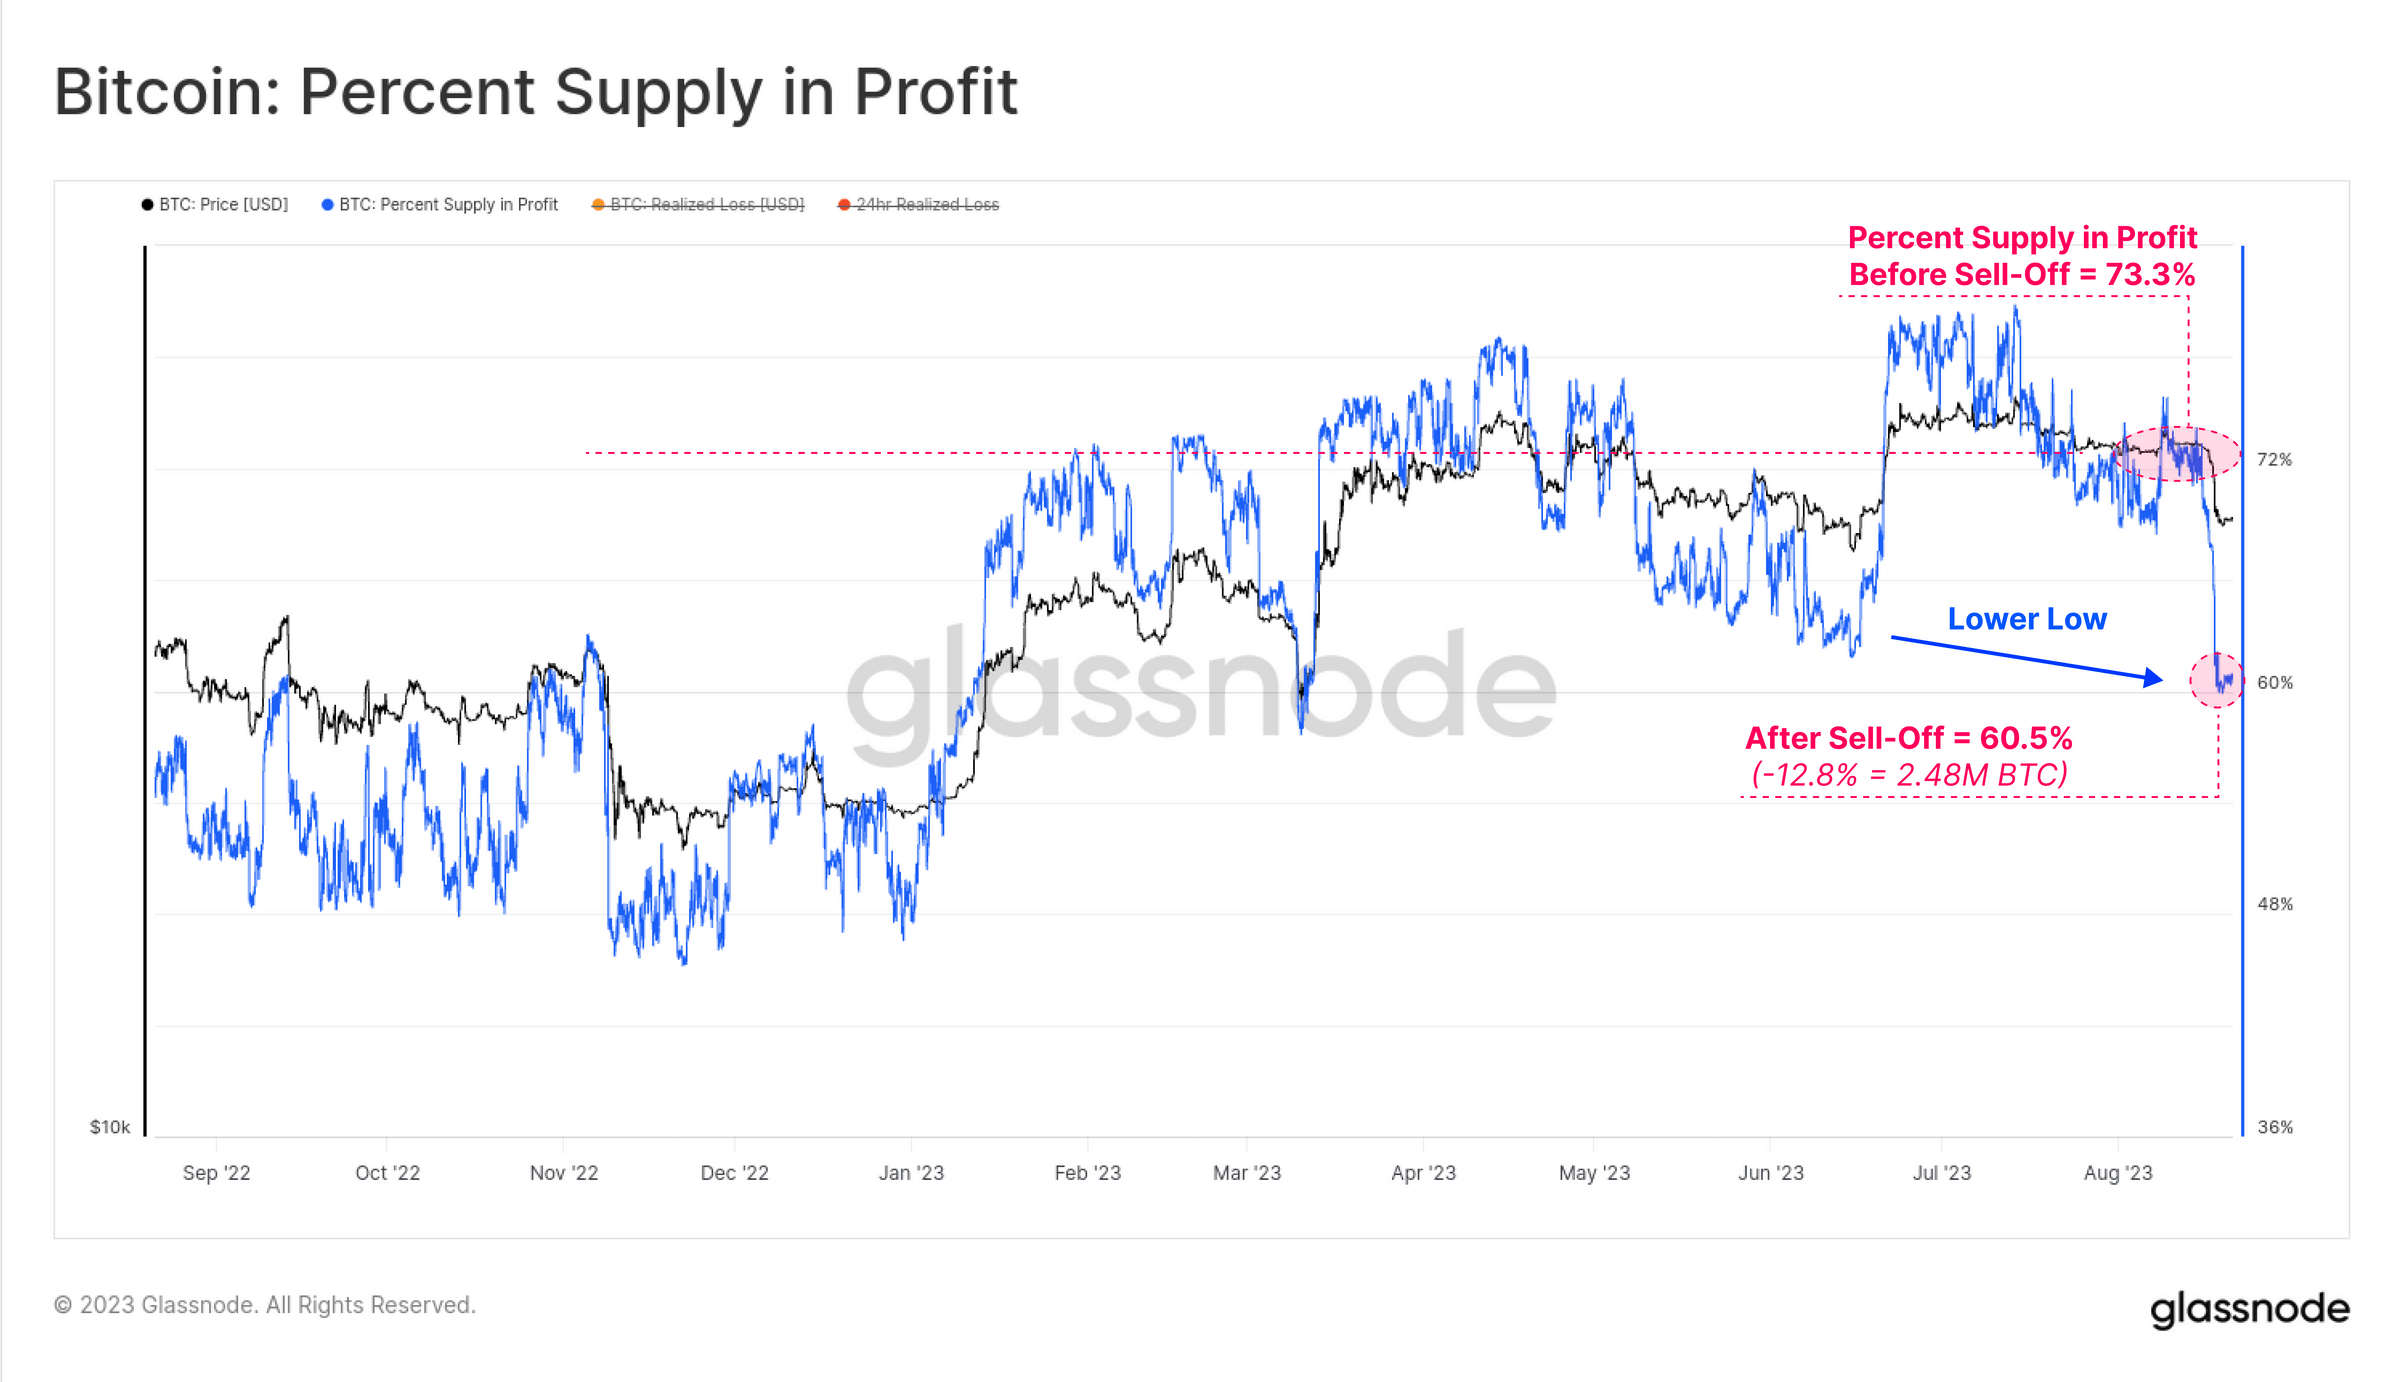
After the Bitcoin price crash last week, on-chain data reveals a picture that points to a “top-heavy” price. Glassnode’s latest insights shed light on the current market dynamics, where a significant chunk of the BTC spot supply finds itself with a cost basis either near or surpassing the prevailing price.
“Here we see that 12.8% (2.48M BTC) of the supply fell into an unrealized loss this week, setting a lower low on this metric. This suggests that ‘top heaviness’ in spot markets may also be a factor in play,” commented Checkmate, Glassnode’s chief analyst.
Notably, Long-Term Holders (LTHs) have displayed remarkable resilience in this turbulent period. Their interaction with exchanges remains largely unaltered, with the aggregate balance of LTHs marking a new All-Time High (ATH) this week. In stark contrast, the behavior of Short-Term Holders (STHs) emerges as particularly salient.
Checkmate notes, “With LTH supply at ATH, we can also see that STH supply remains at multi-year lows.” The data further underscores this: out of the 2.56M BTC held by STHs, a mere 300k BTC (11.7%) remains in profit, meaning that 88.3% are in loss. This needs to recover quickly, else it adds to the bear case, according to Checkmate.
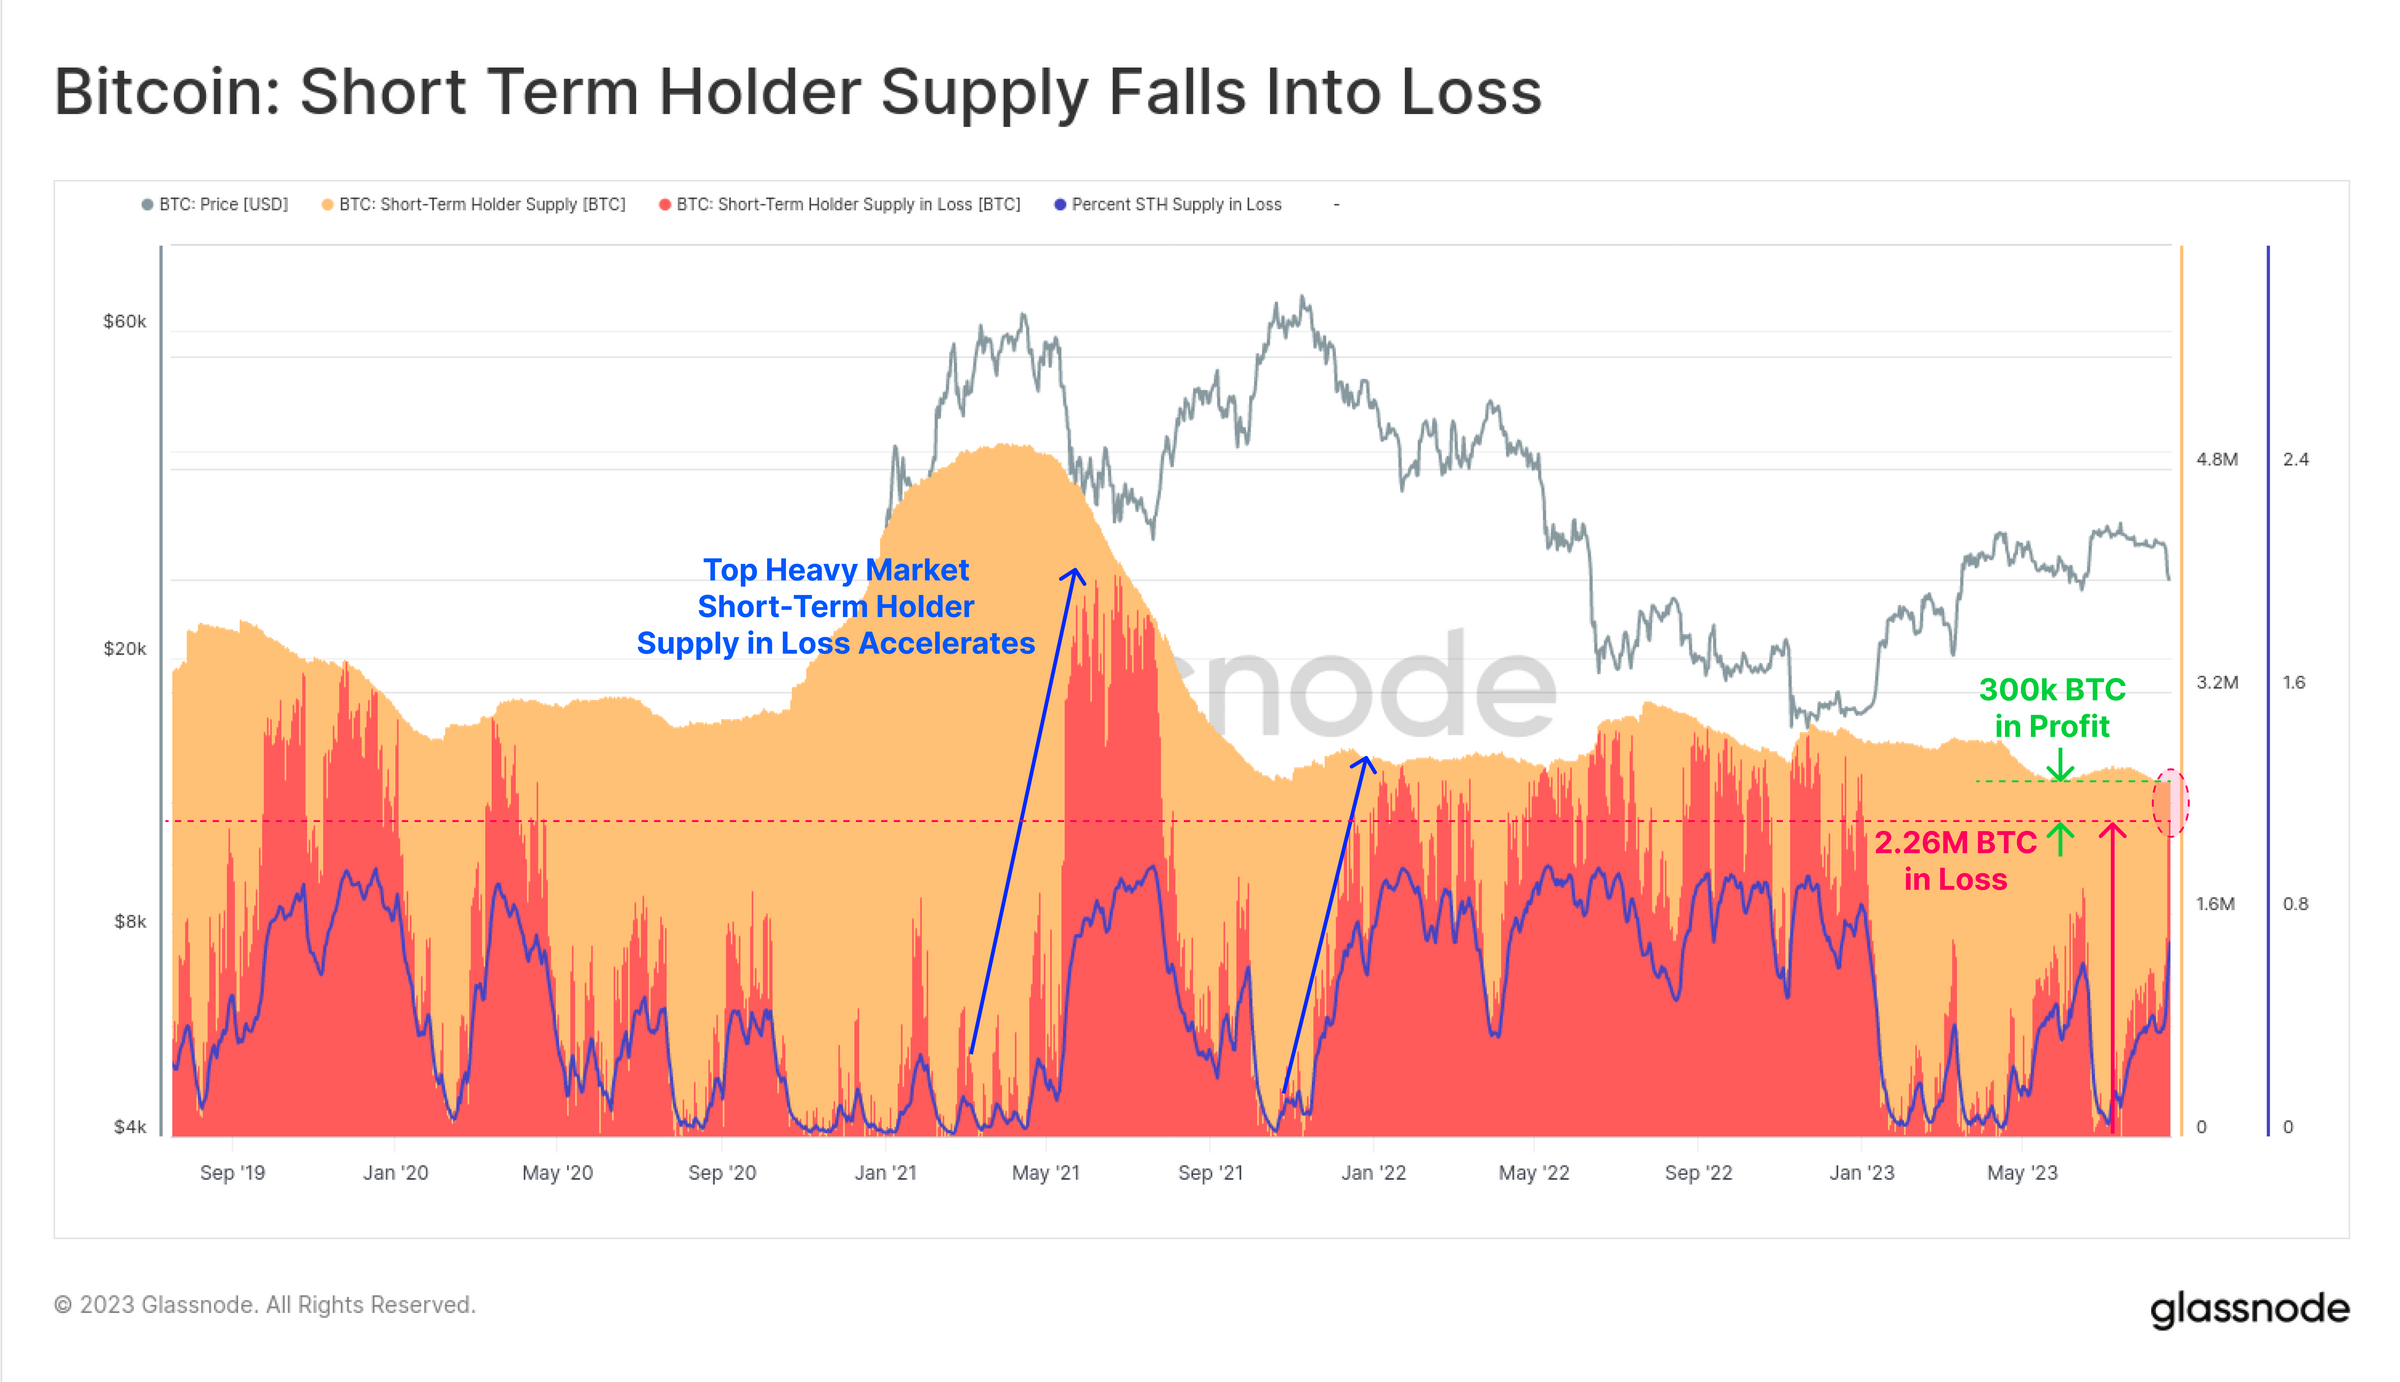
Historical data indicates sharp upticks in STH supply losses following periods characterized as ‘top heavy markets’ – similar to the events observed in May 2021, December 2021, and once again, the present week.
Implications For Bitcoin Price
The fluctuating dynamics between profits and losses witnessed in the market can be further distilled through the Profit or Loss Bias (dominance) metric. As the 2023 rally unfolded, a discernible shift was noted in the STH cohort’s position: “This week we saw the largest loss dominance reading since the March sell-off to .8k. This suggests that the STH cohort are both largely underwater on their holdings, and increasingly price sensitive,” added Checkmate.
An intriguing revelation comes from Glassnode’s experimental tool aimed at discerning market inflection points. With a meticulous design that maps macro trends of investors and the prevalence of profitability over losses (and vice versa), this tool offers a nuanced ‘Momentum indicator’.
According to Checkmate, “We can see that after several months of declining profit dominance, Loss momentum and dominance have increased meaningfully.” Notably, while false positives have been recorded – as observed in the March 2023 correction – sustained declines have historically been precursors to sharper downtrends.
Overall, the Bitcoin price crash on August 17 stands as the most significant single-day decline YTD. The sell-off was primarily a futures market leverage flush out, and is thus primarily a result of short-term positioning and market structure.
However, the predominant sentiment is one of caution, largely because the most significant impact has been technical, specifically falling below long-term moving averages, a factor that could sway market sentiment.
Long-Term Holders remain stoic, but the spotlight is on the Short-Term Holders. With an overwhelming 88.3% (equivalent to 2.26M BTC) of their supply at an unrealized loss, combined with an uptick in realized losses sent to exchanges and a breach of key technical support, the onus is on the bulls to defend their stance. Checkmate concludes:
There is for sure potential for further downside momentum, but the majority of the damage is positioning and technical. The bull case is that realistically nothing has changed aside from the price, and the R/R still favors the upside. Calls for 12k are kidding themselves, but calls for 100K are as well.
Net Result == same as every pre-halving year ever.
At press time, the Bitcoin price stood at ,084.