 Indian crypto exchange Coindcx is expanding globally by acquiring the Middle Eastern digital asset platform Bitoasis. This strategic move enhances Coindcx’s presence in the Middle East and North Africa (MENA) region while allowing Bitoasis to retain its branding and leadership, signaling a new phase of growth and maturity for both companies. Big Milestone: 2 Market […]
Bitcoin News
Analyst Identifies Bitcoin Liquidity Pools You Should Be Aware Of Going Into July
Crypto analyst Zen has released a critical assessment of different scenarios to expect for the Bitcoin price in July. Bitcoin’s price performance in June has undoubtedly left many investors disappointed. This is because the cryptocurrency virtually traded on a decline throughout the month, even falling below ,000 at some point. While the unfavorable price continues to play out, crypto analyst Zen has flagged some major liquidity pools that could determine Bitcoin’s outcome in July and the next few months in autumn.
Analyst Highlights Potential Bitcoin Liquidity Pools
As mentioned earlier, the recent price decline saw Bitcoin break below ,000 earlier in the week. Notably, Zen observed that this breakdown represented cleared liquidity under ,630, which goes along with a former price analysis. Although Bitcoin has since recovered and returned above ,600, Zen noted that the liquidity clearance suggests there’s still a further risk of Bitcoin falling back to ,150 in the short term.
In addition, the analyst pointed out a number of other liquidity price points that may be used to evaluate momentum in July. It’s interesting to note that these liquidity points ultimately serve as both support and resistance areas. In the case of a continued decline, Zen’s analysis points to liquidity pools at ,260, ,440, ,990, and ,850. Huge transactions by major holders at these points could cause significant price movements. Clearing such pools could spell trouble for investor sentiment, which in turn could eventually cause Bitcoin to dip to ,000.
“Will it dip to ~53k at some point? That move make sense on Month timeframe, but doesn’t have to happen,” Zen said. On the upside, Zen noted liquidity pools at ,540, ,540, ,260, and ,920.
#Bitcoin Daily
Bitcoin cleared liquidity above second liquidity pool at 62440
Got rejected from developing quarter VWAP VAL. Now price most probably will move towards 60650-60150 zone. The rest depends on price action there.
Situation remains the same and requires… pic.twitter.com/LFiiiN9fDH
— Zen (@WiseAnalyze) June 26, 2024

Furthermore, Zen pointed out that Bitcoin is currently portraying contrasting scenarios across different timeframes. On the daily chart, Bitcoin is clearly in a downtrend. Each bounce is getting sold into, indicating that the bears have control of the short-term momentum. On the other hand, the weekly candle timeframe highlights how Bitcoin is effectively stuck in a choppy sideways range right now.
Each rally gets faded, but each dip also attracts buying interest and accumulation. Lastly, despite the recent price decline, Zen’s analysis indicates that the uptrend remains intact in the monthly candle timeframe.
What To Expect From BTC Price
At the time of writing, Bitcoin is trading at ,765. According to Zen, a week close above ,622 will increase the chances of a Bitcoin price upswing in July. On the other hand, a closure below ,600 will maintain bearish momentum.
Bitcoin has a pretty solid track record in the seventh month. More often than not, July has registered green candles for BTC. This historical tendency could see Bitcoin eyeing potential upswings, especially if the bulls are able to shoot past the liquidity levels on the upside.
SEC Chair Gensler: Spot Ethereum ETF Approval Process ‘Going Smoothly’
 U.S. Securities and Exchange Commission (SEC) Chair Gary Gensler says that the spot ethereum exchange-traded fund (ETF) approval process is “going smoothly.” He stressed that “it’s really about the asset managers making the full disclosure so that those registration statements can go effective.” SEC Chair Gensler on Spot Ethereum ETF Approval U.S. Securities and Exchange […]
Bitcoin News
Shiba Inu’s Shibarium Sees Triple-Digit Surge Across Major Metrics, What’s Going On?
Key Shibarium metrics suggest the Shiba Inu ecosystem might be gearing up for a push to the upside. Notably, Shibarium’s transaction data has seen triple-digit percentage jumps in transactions and fees paid in BONE over the past week. This suggests Shiba Inu might be receiving increased attention from traders, a scenario that may result in SHIB rebounding at a crucial support level during the course of the week.
Shibarium Sees Massive Surge In Activity Over the Weekend
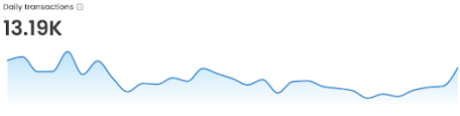
According to the latest data, transactions on the Shibarium network exploded over the weekend, soaring a whopping 441% on Saturday. Over 13,190 transactions were recorded on Shibarium on Saturday, up from just under 3,500 earlier in the week. The massive surge in activity led to higher fees on the network as it strained under the increased load.
Consequently, the average fees paid in BONE on Shibarium transactions jumped 176%. Furthermore, data from Shibariumscan indicates that 154 new accounts were created on Sunday, a 1,600% increase from 9 new accounts created on Monday, June 10.
Interestingly, these numbers are small compared to metrics recorded on Shibarium earlier in the year. However, their increases have come during a particularly bearish period for the Shiba Inu community. This is a positive sign for SHIB price, as the increase in transactions increases the amount of gas fees, which in turn increases the number of SHIB tokens to be burned.
Current State Of Shiba Inu
At the time of writing, SHIB is trading at .00002013 and is currently down by 2.21% in the past 24 hours. Notably, SHIB has declined for the past seven days amidst a wider market price drop led by Bitcoin. Consequently, SHIB has lost 13.11% of its market cap in the past seven days as traders continue to exit their long positions.
SHIB now finds itself trading around the psychological .000020 price zone and could even break down further despite Shibarium’s transaction surge over the weekend. According to data from IntoTheBlock, only about 3.97 trillion SHIB tokens purchased by 5,270 addresses serve as resistance at this price level. If SHIB fails to defend this support and breaks below, the next key level is at .000190, where 4,310 addresses are currently holding 6.21 trillion SHIB tokens.
Lucie, Shiba Inu’s marketing lead, recently hinted at an airdrop for everyone who bridged to Shibarium in the first year, sparking interest from Shib enthusiasts. Nevertheless, Lucie provided clarification and noted that this is merely an imaginary scenario and does not guarantee anything.
“THIS IS A HYPOTHETICAL QUESTION PROMISING NOTHING. JUST WONDERING,” Lucie said on social media platform X.
Ethereum Withdrawals From Coinbase Top $1.2 Billion, What’s Going On?
Ethereum has seen a number of notable withdrawals that suggests that crypto whales are expecting a recovery in price. These large withdrawals has caused the ETH balances on centralized exchanges to fall to their lowest level since 2016.
336,000 ETH Withdrawn From Exchanges
Crypto analyst Ash Crypto took to X (formerly Twitter) to reveal a notable change in the amount of ETH that is being held on centralized exchanges currently. Notably, there has been a marked increase in the withdrawals of small and large investors alike, leading to the highest withdrawal trend of 2024 so far.
The report focuses on the withdrawals from the Coinbase exchange, which is the largest crypto exchange in the United States. The uptick in the withdrawal trend saw a whopping 336,000 ETH withdrawn from the exchange’s wallets in just 48 hours. This translates to the highest withdrawal trend from the exchange so far this year.
However, Coinbase wasn’t the only crypto exchange hit hard by the Ethereum withdrawals as the cumulative exchange addresses saw their ETH balances fall drastically. As the on-chain tracker Santiment revealed in a report, the total ETH held on centralized exchange wallets has fallen 8.6% in the last two weeks alone.
These withdrawals have greatly impacted the exchange balances, causing them to fall to their lowest point in 8 years. This means that the last time that the exchange balances were this low was back in 2016, which is three bull markets ago.
Will This Propel Ethereum Price To ,000?
Naturally, the withdrawal of Ethereum from exchanges is bullish given that this is a trend that suggests investors are choosing to hold their Ethereum coins rather than sell them. If coins were moving the other direction and being deposited on exchanges instead, it would’ve been bearish for the price as it meant that investors were looking to offload their holdings for profit.
Crypto analyst Ash Crypto shares the sentiment that the withdrawals are bullish for the price. According to the analyst, with Spot Ethereum ETFs set to start trading in 2024 in addition to this, it means that the ETH price trading above ,000 is just a matter of time.
Presently, the ETH price is still closely following the Bitcoin trend. It has recovered above ,500 once more after initially falling below this support level on Thursday. Nonetheless, it continues to nurse losses on the weekly chart, with CoinMarketCap data showing a decline of 7.88%.
Dogecoin Under Pressure And ‘Going To Zero’, Analyst Says – Here’s Why
The beloved Dogecoin, the Shiba Inu-faced cryptocurrency that started as a joke, is facing a ruff time. A recent million sell-off by a large holder, likely a “whale” investor, has sent shockwaves through the DOGE community, raising questions about the meme coin’s long-term viability.
Mags Charts A Worrying Course
Crypto analyst Mags has emerged as the harbinger of doom for DOGE. Using a self-developed charting method, Mags identifies distinct phases in Dogecoin’s historical price movements. Phase 3, according to Mags, paints a particularly bleak picture, suggesting a potential plummet to zero.
Bluntly, the analyst says the meme coin is “bearish” and is about to become worthless.
$DOGE is bearish and is going to zero.
don’t belive me? see for yourself
pic.twitter.com/p4jYYDlbLZ
— Mags (@thescalpingpro) June 12, 2024
This prediction hinges on the cyclical nature of DOGE, where brief price surges are followed by extended periods of decline. While a temporary spike to .70 is possible in Phase 3, Mags warns investors to be wary of such fleeting optimism.

Technical Indicators Flash Red
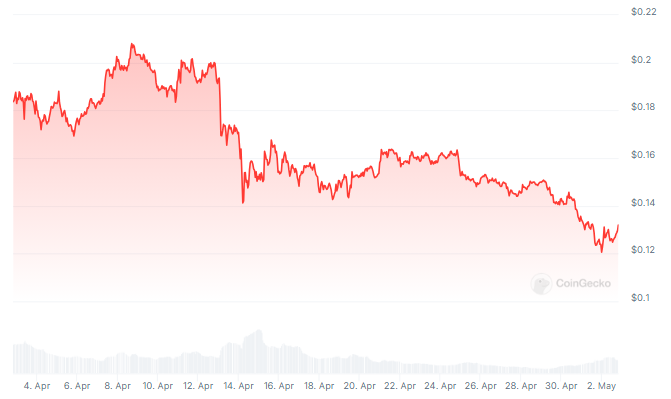
Despite a recent 4% price increase, technical indicators paint a concerning picture. The Relative Strength Index (RSI) sits squarely in neutral territory, neither overbought nor oversold, reflecting investor indecision. More importantly, DOGE is currently trading below its key moving averages, with the 200-day EMA acting as the last line of defense at .123. A breach of this support level could trigger a domino effect, sending DOGE tumbling further towards the .07 mark.
Can Dogecoin Defy The Odds?
While Mags’ analysis and technical indicators cast a long shadow, there’s still a glimmer of hope for the meme coin. The recent uptick in trading volume suggests heightened activity, potentially indicating a buying spree by loyal DOGE holders. Additionally, overcoming the first resistance level of .14 could signal a potential turnaround. However, this optimistic scenario hinges on defying historical trends and requires a significant shift in market sentiment.
The future of Dogecoin remains shrouded in uncertainty. Elon Musk, the self-proclaimed “Dogefather” and a major influencer of the meme coin’s price, has been relatively quiet recently. Without his usual bullish tweets, DOGE lacks a strong catalyst for a sustained push upwards.
Related Reading: Ethereum Longs Crushed! Who Got Burned In The Million Fire Sale?
Dogecoin Price Forecast
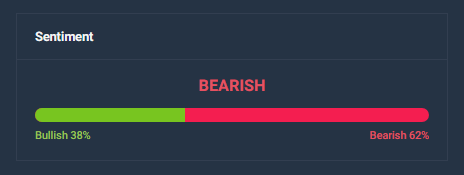
Meanwhile, based on technical analysis by CoinCodex, the price of Dogecoin is predicted to decrease by 13%, reaching .12by July 13, 2024. The current sentiment is Bearish, suggesting a prevailing expectation of downward price movement. Despite this, the Fear & Greed Index stands at 70, indicating a high level of Greed among investors.
Over the past 30 days, Dogecoin has experienced 14 out of 30 green days, equating to a 47% success rate in positive price movements. The observed price volatility during this period is 5.10%, indicating significant fluctuations in its market price.
This heightened volatility, combined with the bearish sentiment, suggests that Dogecoin may encounter further price declines, although investor optimism as indicated by the Fear & Greed Index could introduce short-term price rallies.
Featured image from CSF Hungary, chart from TradingView
Bitcoin ‘Zombies’ Awaken: Dormant Coins Move For First Time In Years, What’s Going On?
According to recent data from on-chain analytics platform CryptoQuant, in recent weeks, the Bitcoin market has witnessed a fascinating phenomenon: long-dormant BTC, untouched in wallets for up to a decade, are suddenly springing into action.
This movement coincides with Bitcoin’s price once again reclaiming the ,000 mark, a dynamic that has not only captured the attention of investors but also sparked analysis from on-chain analytics experts.
Revival Of The Sleeping Giants
The data revealed by CryptoQuant illuminates a surprising trend: on June 2 alone, roughly 2,800 BTC that had been idle for two to three years were transferred. The following day, a movement of 4,500 BTC, dormant for four to five years, outstripped this.

The activity didn’t stop there; even BTC that had not moved for over a decade—210 BTC, to be precise—changed hands. This phenomenon, referred to as “old coins moving” by a CryptoQuant author, Maartunn, suggests an “allocation” phase, where long-term holders begin to release their coins back into circulation.
Particularly, according to Maartunn, old coins moving indicates a potential shift from holding to “distribution,” a sign often seen in mature bull markets. This resurgence of old BTC is notable, as it aligns with historical price peaks, including BTC’s previous rally to a new peak in March.
And another 2,123 $BTC with the same age.
Old coins moving, after old coins moving, after old coins moving.
In other words, distribution.
https://t.co/BBg4e9pNoz https://t.co/zXtjrZ78Y6 pic.twitter.com/bKJgDzAIF0
— Maartunn (@JA_Maartun) June 3, 2024
A Signal Of Bullish Trends
The movement of these long-dormant coins is more than a mere statistic; it reflects a broader sentiment among Bitcoin holders.
According to another CryptoQuant contributor, Onchained, during bullish market phases, it is common for long-term holders to offload parts of their holdings as prices rise. This pattern is currently evident as Bitcoin continues to test major resistance levels.
Moreover, Onchained further revealed that despite recent market fluctuations, the consistent increase in Bitcoin held in unspent transaction outputs (UTXOs) for over three years suggests a strong bullish sentiment persists among veteran investors.
The analyst further noted:
The 1-year+ and 2-year+ cohorts have ceased selling, transitioning from a distribution phase to a holding phase. This change indicates a renewed confidence in Bitcoin’s future price potential, as these cohorts choose to retain their holdings rather than liquidate them at current prices.
Adding to the complexity of Bitcoin’s market dynamics is the recent decline in miner reserves, hitting a 14-year low, reminiscent of the early days of Bitcoin when Satoshi Nakamoto was still active. This decrease in miner holdings could presage a tightening of Bitcoin supply, potentially accelerating a supply crunch.
Featured image created with DALL-E, Chart from TradingView
Veteran Trader Peter Brandt Warns of SEC’s Full-Scale Assault on Crypto Staking — ‘It’s Going to Be a Bloodbath’
 Veteran trader Peter Brandt has predicted a severe regulatory crackdown on cryptocurrency staking by U.S. regulators, including the Securities and Exchange Commission (SEC). “It’s going to be a bloodbath,” he warned, cautioning that he believes it is “illegal as hell” and will be “attacked with all-out vengeance.” ‘It’s Going to Be a Bloodbath’ Veteran trader […]
Bitcoin News
Whales Dive In, But Dogecoin Price Sinks 20%: What’s Going On?
Dogecoin (DOGE), the Shiba Inu-faced darling of the 2021 memecoin frenzy, has found itself shivering in the current crypto winter. Once a symbol of retail investor exuberance, DOGE has plummeted over 70% from its sky-high peak, leaving its future shrouded in uncertainty.
DOGE Feels The Crypto Frost
While Bitcoin, the heavyweight champion of the crypto world, grabs headlines with its recent wobble, the impact on memecoins like DOGE has been brutal. Unlike Bitcoin’s divided analyst opinions, the sentiment surrounding DOGE is decidedly bearish.
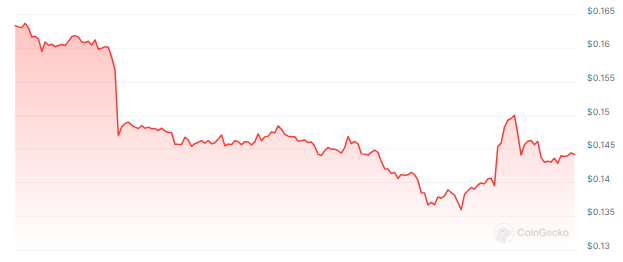
At the time of writing, the memecoin was trading at .132, down 5.4% up the last 24 hours but sustained a 20% loss in the last seven days, data from Coingecko shows.
Is DOGE A Canary In The Crypto Coal Mine?
Some analysts believe DOGE’s struggles are a canary in the coal mine for the entire crypto market. They said if even a historically high-flying memecoin like Dogecoin can’t hold onto gains, it raises serious concerns about risk appetite in the crypto space in general.
Whales Accumulating DOGE: A Glimmer Of Hope?
However, a glimmer of hope flickers for the dethroned meme king. On-chain data suggests an increase in large wallet purchases of DOGE, hinting at potential accumulation by wealthy investors. This “contrarian” behavior could be a sign that some whales are using Coinglass or similar platforms to track Dogecoin derivatives and believe the coin is undervalued and ripe for a comeback.
Coinglass, a popular cryptocurrency data provider, offers insights into factors that might be influencing the whales’ decisions. By analyzing metrics like open interest, funding rates, and liquidations on Coinglass, these investors might see an opportunity to buy DOGE at a discount.
Related Reading: Solana Crawls: Network Update Fails To Fix Traffic Jam, Price Feels The Pinch
In a similar development, Whale Alert, a well-known blockchain tracker, has reported that a DOGE whale arranged two large transactions in a single day. Some 150,000,000 Dogecoins were transferred in the first transaction, and an additional 76,316,694 DOGE were transferred in the second, for a total of almost 226 million DOGE. At the time, the meme cryptocurrency was worth around million in fiat money.
150,000,000 #DOGE (21,281,922 USD) transferred from #Robinhood to unknown wallethttps://t.co/7U1CEfr2ZT
— Whale Alert (@whale_alert) April 29, 2024
Can Dogecoin Thaw The Crypto Winter?
The coming weeks will be critical for DOGE. The return of positive social media sentiment, coupled with continued accumulation by whales who might be strategically using Coinglass for market analysis, could be the spark that reignites the DOGE rally. However, if the broader market weakness persists, DOGE’s summer might be spent shivering in the doghouse.
Featured image from Pixabay, chart from TradingView
Bitcoin Sell Calls Going Through The Roof: But Is It Really Time To Sell?
The story has not been any much different for Bitcoin, with its price still stuck in a consolidation range in the past week. The sluggishness of the premier cryptocurrency – and the general market – has continued despite the completion of the halving event over a week ago.
The halving event, which saw mining rewards take a significant cut, was expected to usher in another round of bullishness for the Bitcoin price. On the contrary, investors appear to be getting frustrated with the slow activity of the market, with many calling for the dump of BTC.
Bitcoin Sell Calls At Increased Rate: Blockchain Firm
According to a recent report by on-chain analytics firm Santiment, investors are increasingly calling for the sale of Bitcoin across social media following its latest drop toward ,000. The relevant metric here is the “social volume” indicator, which tracks the number of unique posts and messages on different social platforms that mention a specific topic.
Santiment aggregated data of “buy or bullish”, “sell or bearish,” or related mentions for the premier cryptocurrency over the past week. The on-chain analytics then highlighted a shift in the trend, with the bearish calls looking to drown out the bullish noise on social media.
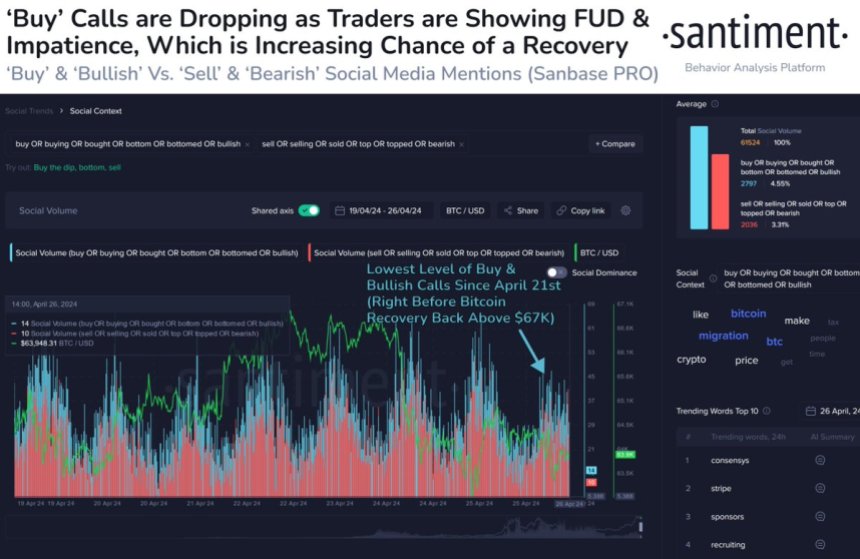
According to Santiment, Bitcoin’s recent fall to ,000 resulted in the lowest level of buy and bullish calls since April 21st (just before BTC recovered back above ,000). As shown in the chart above, the social volume for terms related to “sell” shot up after the price decline.
Typically, the increased bearish mentions of Bitcoin suggest a rising level of FUD (fear, uncertainty, and doubt) amongst investors. However, when traders seemingly become frustrated and impatient, there is usually a higher probability of a market rebound.
Almost 90% Of Circulating BTC In Profit – Impact On Price
According to recent on-chain data, about 90% of Bitcoin in supply is in profit. On the surface, this basically implies that the most current holders of the premier cryptocurrency bought at a lower price compared to the current price.
However, this level of profitability can also be an overbought signal, especially after bullish periods like the one that occurred between October 2023 and March 2024. Ultimately, this suggests investors could see Bitcoin shed more of its price gains over the next coming weeks.
As of this writing, Bitcoin is valued at ,077, reflecting a 2% price decline in the past 24 hours.