 Santander, the multinational banking giant, has recently announced that it will start offering cryptocurrency trading services in Brazil. The bank will roll out this functionality to selected customers of Toro, its investment unit, this week and will gradually extend it to more users in the future. With this move, Santander joins Nubank and Itau Unibanco, […]
Bitcoin News
Fintech Giant Flutterwave Partners With Nigerian Anti-Graft Body to Launch Cybercrime Center
 Flutterwave, a Nigerian fintech startup, has partnered with the Economic and Financial Crimes Commission (EFCC) to establish a cybercrime research center. This strategic initiative aims to intensify the fight against internet crime, enhance the security of business transactions, and provide opportunities for Nigerian youth. The partnership was formalized through a Memorandum of Understanding (MoU) signed […]
Bitcoin News
Financial Giant AllianceBernstein Predicts Bitcoin At $1 Million, Here’s When
In an analysis released Thursday, leading global investment firm AllianceBernstein with assets under management worth 5 billion significantly elevated its price target for Bitcoin, predicting the premier cryptocurrency will reach million by 2033. This bullish outlook is underscored by a new wave of adoption via US spot Bitcoin exchange-traded funds (ETFs) managed by heavyweight asset managers including BlackRock, Fidelity, and Franklin Templeton.
Bitcoin’s Path To Million In 2033
Analysts Gautam Chhugani and Mahika Sapra from Bernstein outline a detailed scenario where they expect the assets under management in Bitcoin-related ETFs to escalate to about 0 billion by 2025, a substantial leap from the current billion. The report states, “We believe that the US regulated ETFs were the watershed moment for crypto that brought in structural demand from traditional pools of capital.”
They highlighted the considerable impact of these funds, which have already funneled approximately billion in net new flows into the market.
The report extrapolates that by 2025, Bitcoin ETFs will represent about 7% of all Bitcoins in circulation, and by 2033, this figure could rise to around 15% of the total Bitcoin supply. This significant uptick in institutional interest and investment is poised to play a critical role in driving Bitcoin’s price upward.
A critical aspect of Bernstein’s analysis is the effect of Bitcoin’s supply mechanics, particularly the halving events. The most recent halving in April cut the block reward for miners from 6.25 BTC to 3.125 BTC, effectively halving the daily new supply from 900 BTC to 450 BTC.
According to Chhugani and Sapra, “The halving presents a unique circumstance, where natural Bitcoin sell-pressure from miners declines by half (or even more, as they inventory more in anticipation), while new catalysts for bitcoin demand arise, leading to exponential price moves.”
Historically, after halving events, BTC has experienced significant price rallies. The analysts draw on past cycles for context: in 2017, Bitcoin surged to approximately five times its marginal cost of production, then bottomed at 0.8 times in the following year. A similar pattern was observed in the 2021 cycle.
For the 2024-27 cycle, they project a more conservative yet substantial increase to 1.5 times Bitcoin’s marginal cost of production, translating to a predicted mid-cycle high of 0,000 by mid-2025. In the following cycle, Bernstein expects the Bitcoin price to reach half a million US dollars by 2029, before breaking the million mark four years later.
Outlook For MicroStrategy
In tandem with their Bitcoin outlook, Bernstein also initiated coverage on MicroStrategy with an outperform rating, targeting a price of ,890 for the stock by the end of 2025. MicroStrategy has become notable for its BTC acquisition strategy, now holding 214,400 BTC, or 1.1% of the cryptocurrency’s circulating supply, valued at approximately .5 billion.
MicroStrategy’s aggressive acquisition of Bitcoin, funded through convertible notes—a form of long-term debt that converts into stock under specific conditions—demonstrates a robust investment strategy which the analysts believe offers “limited liquidation risk” due to the already profitable nature of their holdings based on today’s Bitcoin prices. They foresee MicroStrategy’s holdings increasing to 1.5% of the Bitcoin supply by 2025.
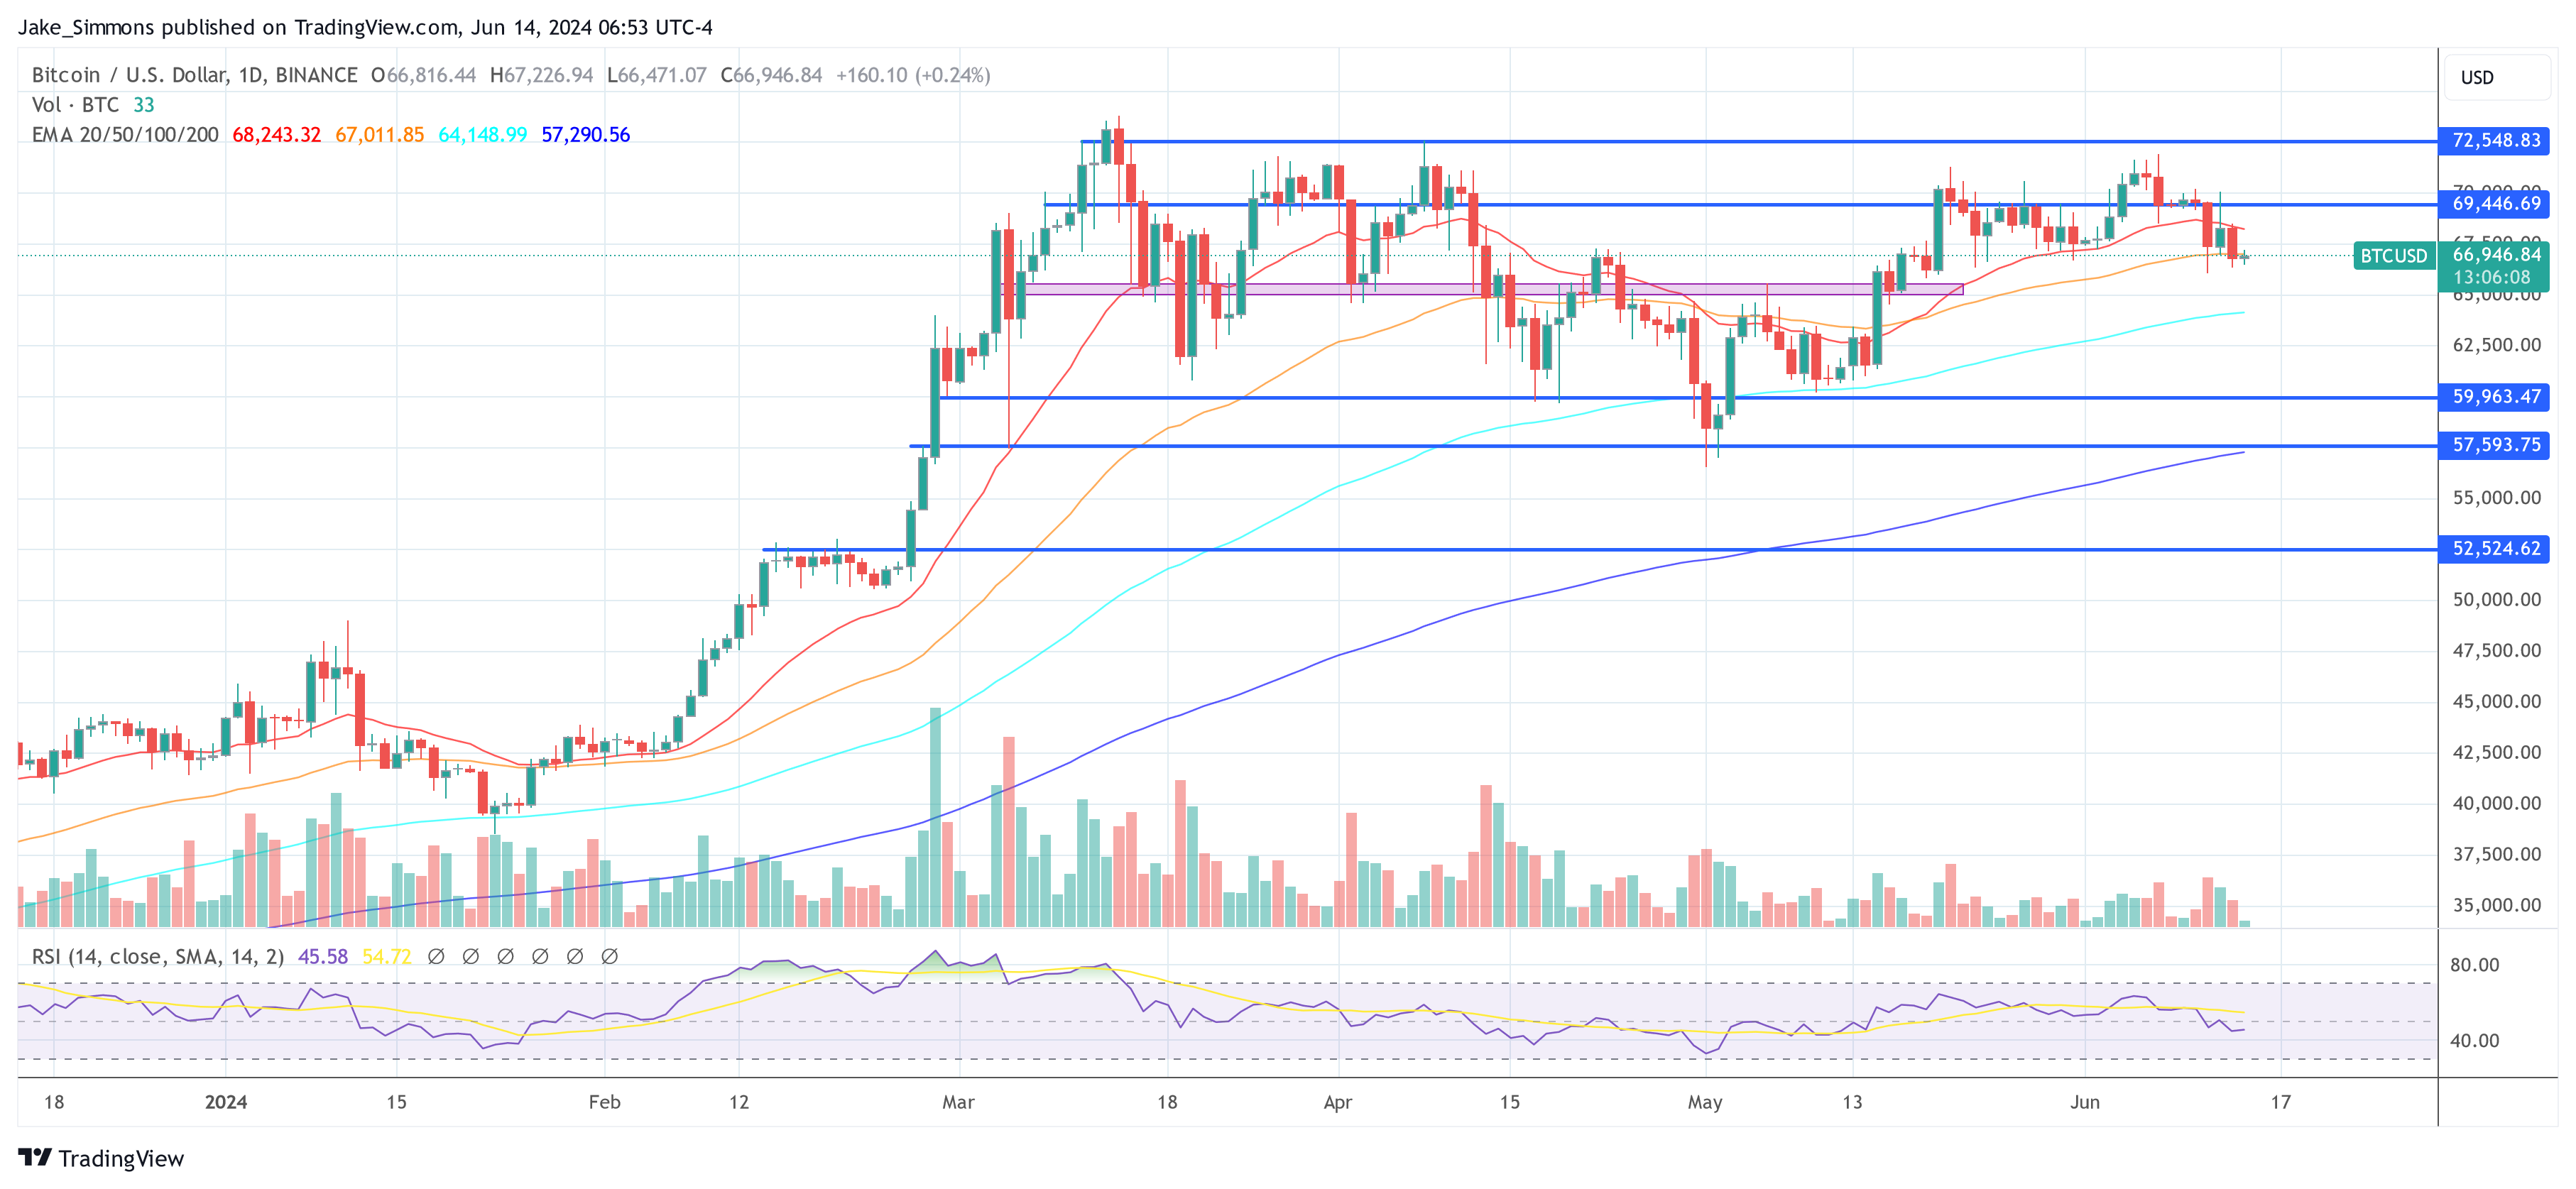
At press time, BTC traded at ,946.
BNB Price Retraces: Altcoin Giant Trims Recent Gains, Can It Recover?
BNB price struggled above 0 and started a downside correction. The price is now moving lower and there is risk of more downsides below 0.
- BNB price started a fresh decline below the 0 support zone.
- The price is now trading below 0 and the 100-hourly simple moving average.
- There is a key bearish trend line forming with resistance at 0 on the hourly chart of the BNB/USD pair (data source from Binance).
- The pair could gain bearish momentum if there is a close below the 0 support.
BNB Price Trims Gains
After a major increase, BNB price struggled near the 0 resistance. As a result, there was a bearish reaction below the 0 support, like Ethereum and Bitcoin.
The price dipped below the 0 support and the 100 simple moving average (4 hours). It traded as low as 3 and is currently consolidating losses below the 23.6% Fib retracement level of the downward move from the 4 swing high to the 3 low.
The price is now trading below 0 and the 100-hourly simple moving average. Immediate resistance is near the 0 level. The next resistance sits near the 0 level.

There is also a key bearish trend line forming with resistance at 0 on the hourly chart of the BNB/USD pair. A clear move above the 0 zone could send the price higher. In the stated case, BNB price could test 5. A close above the 5 resistance might set the pace for a larger increase toward the 2 resistance. Any more gains might call for a test of the 0 level in the coming days.
More Losses?
If BNB fails to clear the 0 resistance, it could continue to move down. Initial support on the downside is near the 5 level.
The next major support is near the 5 level. The main support sits at 0. If there is a downside break below the 0 support, the price could drop toward the 0 support. Any more losses could initiate a larger decline toward the 0 level.
Technical Indicators
Hourly MACD – The MACD for BNB/USD is gaining pace in the bearish zone.
Hourly RSI (Relative Strength Index) – The RSI for BNB/USD is currently below the 50 level.
Major Support Levels – 5 and 0.
Major Resistance Levels – 0 and 0.
BNB Price Retraces: Altcoin Giant Trims Recent Gains, Can It Recover?
BNB price struggled above 0 and started a downside correction. The price is now moving lower and there is risk of more downsides below 0.
- BNB price started a fresh decline below the 0 support zone.
- The price is now trading below 0 and the 100-hourly simple moving average.
- There is a key bearish trend line forming with resistance at 0 on the hourly chart of the BNB/USD pair (data source from Binance).
- The pair could gain bearish momentum if there is a close below the 0 support.
BNB Price Trims Gains
After a major increase, BNB price struggled near the 0 resistance. As a result, there was a bearish reaction below the 0 support, like Ethereum and Bitcoin.
The price dipped below the 0 support and the 100 simple moving average (4 hours). It traded as low as 3 and is currently consolidating losses below the 23.6% Fib retracement level of the downward move from the 4 swing high to the 3 low.
The price is now trading below 0 and the 100-hourly simple moving average. Immediate resistance is near the 0 level. The next resistance sits near the 0 level.
There is also a key bearish trend line forming with resistance at 0 on the hourly chart of the BNB/USD pair. A clear move above the 0 zone could send the price higher. In the stated case, BNB price could test 5. A close above the 5 resistance might set the pace for a larger increase toward the 2 resistance. Any more gains might call for a test of the 0 level in the coming days.
More Losses?
If BNB fails to clear the 0 resistance, it could continue to move down. Initial support on the downside is near the 5 level.
The next major support is near the 5 level. The main support sits at 0. If there is a downside break below the 0 support, the price could drop toward the 0 support. Any more losses could initiate a larger decline toward the 0 level.
Technical Indicators
Hourly MACD – The MACD for BNB/USD is gaining pace in the bearish zone.
Hourly RSI (Relative Strength Index) – The RSI for BNB/USD is currently below the 50 level.
Major Support Levels – 5 and 0.
Major Resistance Levels – 0 and 0.
Marketnode Secures Series A Funding Led by Financial Services Giant HSBC
 On Thursday, Singapore’s Marketnode, a digital market infrastructure operator, secured funding for its Series A financing round led by HSBC, the British multinational universal bank and financial services group. The exact amount raised during the Series A funding was not disclosed. HSBC Joins Forces With Marketnode to Revolutionize Digital Asset Solutions HSBC has backed Marketnode, […]
Bitcoin News
Latam E-Commerce Giant Mercado Libre Holds $40 Million in Crypto
 Mercado Libre, one of the biggest e-commerce platforms in Latam, has disclosed it holds over million in cryptocurrency, according to its Q1 2024 filings. The company disclosed that it held 412.7 bitcoin (BTC) and 3,041.6 ethereum (ETH), by March 31. However, Mercado Libre does not own these holdings, as its CIO Richard Cathcart explained, […]
Bitcoin News
Stablecoin Giant Tether Strikes Gold: Achieves Record Net Profit Of $4.5 Billion In Q1
Stablecoin issuer Tether, a prominent player in the cryptocurrency market behind the widely used USDT stablecoin, has released its audit statement for the first quarter of 2024, accompanied by a report conducted by independent accounting firm BDO.
The report, which provides additional financial information beyond the reserves backing Tether’s fiat-denominated stablecoins, shows the company’s profit for the first quarter of the year, which saw an increased influx of capital into the market.
Tether Q1 2024 Financials Soar
Digging into the numbers, the first quarter of 2024 proved highly profitable for Tether, with a net profit of .52 billion.
The main contributors, the entities responsible for issuing stablecoins and managing reserves, reportedly generated approximately billion of this profit from net operating gains, primarily from US Treasury holdings. The remaining profits were attributable to mark-to-market gains on Bitcoin (BTC) and gold positions.
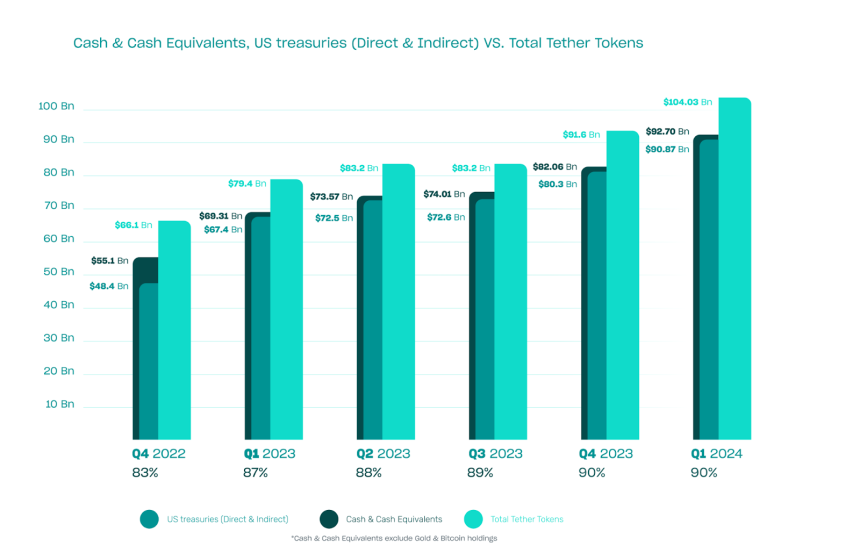
The report also highlighted Tether’s success in increasing its direct and indirect holdings of US Treasuries to over billion. This includes indirect exposure through overnight reverse repurchase agreements collateralized by US Treasuries and investments in US Treasuries through money market funds.
In a sign of significant growth, Tether also disclosed its net equity for the first time, revealing a figure of .37 billion as of March 31, 2024. This is an increase from the .01 billion equity reported as of December 31, 2023.
The report also highlighted a billion increase in excess reserves, which support the company’s stablecoin offerings, bringing the total to nearly .3 billion.
CEO Emphasizes Transparency And Stability
The BDO confirmation reiterated that Tether-issued tokens are 90% backed by cash and cash equivalents, underscoring the company’s stance on maintaining liquidity within the stablecoin ecosystem. Furthermore, the report revealed that over .5 billion worth of USDT was issued in the first quarter alone.
Tether Group’s strategic investments, which exceed billion as of the report date, span various sectors, including artificial intelligence (AI) and data, renewable energy, person-to-person (P2P) communication, and Bitcoin Mining.
In response to the latest report, Paolo Ardoino, CEO of Tether, expressed the company’s commitment to transparency, stability, liquidity, and responsible risk management.
Ardoino highlighted Tether’s record-breaking profit benchmark of .52 billion and the company’s efforts to increase transparency and trust within the cryptocurrency industry. Ardoino further claimed:
In reporting not just the composition of our reserves, but now the Group’s net equity of .37 billion, Tether is again raising the bar in the cryptocurrency industry in the realms of transparency and trust.
Featured image from Shutterstock, chart from TradingView.com
Sleeping Giant Awakens! Ethereum Whale With Over 12,000 ETH Creates Noise
The Ethereum market is buzzing after a long-dormant “whale” – a major investor holding a vast amount of cryptocurrency – resurfaced and transferred a significant amount of ETH to the Kraken exchange. This move has sparked speculation about a potential price drop, but wider market trends suggest a more complex picture.
On-chain analytics firm Spot On Chain has disclosed that the investor, who participated in Ethereum’s Initial Coin Offering (ICO) in 2014, recently deposited 1,069 ETH, valued at roughly .56 million, to Kraken.
Traditionally, deposits to exchanges are seen as a sign of intent to sell, potentially putting downward pressure on the price of ETH.
This whale’s activity is particularly noteworthy because of their participation in the Ethereum ICO. Back in 2014, they acquired 12,566 ETH at a meager .30 per token. The recent transfer represents just a fraction of their holdings, but the sale price – over ,300 per ETH – signifies a massive profit for the early investor.
An #Ethereum #ICO participant returned after 1.12 years to deposit 1,069 $ETH (.56M) to #Kraken at ,329 3 hours ago.
The whale received 12,566 $ETH at #Ethereum Genesis in Jul 2015, at an ICO price of ~.31,
And then distributed the $ETH across 12 wallets in 2017, of which… pic.twitter.com/Lid1hItGik
— Spot On Chain (@spotonchain) April 6, 2024
Ethereum Market Shows Signs Of Accumulation
While the whale’s move might suggest a potential sell-off, on-chain data reveals a broader trend that could offset its impact. According to IntoTheBlock, a blockchain analytics company, the past quarter witnessed a significant outflow of ETH from cryptocurrency exchanges, totaling a staggering billion.
This movement suggests that many investors are accumulating ETH, potentially anticipating future price increases.
Dencun Upgrade Fuels Ethereum Network Activity
The news comes on the heels of Ethereum’s successful Dencun upgrade, implemented in March 2024. The upgrade aimed to address the network’s scalability issues, specifically targeting high transaction fees and slow processing times.
Early signs appear positive, with IntoTheBlock reporting a surge in activity on the main optimistic rollups (Layer 2 scaling solutions) following the upgrade.
Weekly transaction volume reached highs of 32 million, indicating increased network usage. While gas prices have risen recently, they were initially significantly lower on many Layer 2 solutions after the upgrade.
Market Uncertainty Remains
The combined effect of the whale’s sale, the wider accumulation trend, and the Dencun upgrade’s impact on network activity make it difficult to predict the short-term direction of the Ethereum market.
While the whale’s sale could trigger a price dip, the broader accumulation trend suggests underlying bullish sentiment. The Dencun upgrade’s success in reducing transaction fees and increasing network usage could further bolster investor confidence.
Featured image from Pexels, chart from TradingView