 Multi-chain token Dogeverse is preparing for one of the biggest meme coin launches of the year after raising more than million in a red-hot presale. The project has gotten a ton of attention from meme coin traders and crypto analysts, many of whom believe the $DOGEVERSE token could deliver a 10x gain or more […]
Bitcoin News
TRUMP Coin Reaches All-Time High as Trump-Themed Cryptos See Major Gains
 The presidential meme coin fervor persists, with the token maga (TRUMP) hitting an all-time high of .45 on Wednesday. This surge elevated the value of Donald Trump’s TRUMP coins to .06 million on May 29. Additionally, various Trump-related crypto assets are emerging from the woodwork, including one leveraging Bitcoin’s Runes protocol for minting. Trump-Themed Meme […]
Bitcoin News
Ethereum Price Continues Its Climb: Bullish Momentum Drives Higher Gains
Ethereum price extended its increase above the ,900 resistance. ETH is now consolidating near ,880 and might continue to grind higher in the near term.
- Ethereum started another increase above the ,850 resistance.
- The price is trading above ,850 and the 100-hourly Simple Moving Average.
- There is a major bullish trend line forming with support at ,860 on the hourly chart of ETH/USD (data feed via Kraken).
- The pair could continue to move up and test the ,000 resistance zone in the near term.
Ethereum Price Eyes ,000
Ethereum price remained supported above the ,650 support zone. ETH started another increase, outperformed Bitcoin, and climbed above the ,750 level.
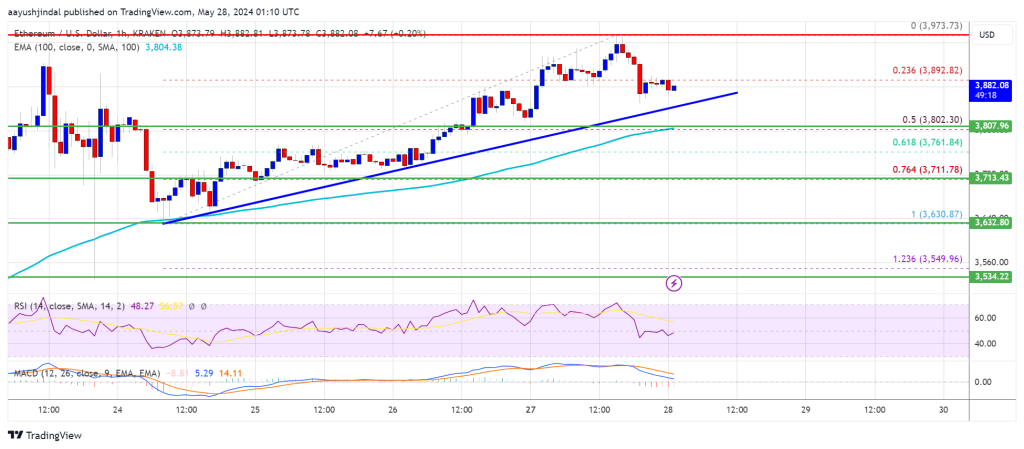
There was a move above the ,850 resistance. The bulls pushed the price above the ,940 resistance. It traded close to the ,000 resistance. A high was formed near ,973 and the price is now correcting gains. There was a minor decline below the ,920 level.
The price dipped below the 23.6% Fib retracement level of the upward move from the ,630 swing low to the ,973 high. Ethereum price is trading above ,850 and the 100-hourly Simple Moving Average. There is also a major bullish trend line forming with support at ,860 on the hourly chart of ETH/USD.
Immediate resistance is near the ,940 level. The first major resistance is near the ,970 level. An upside break above the ,970 resistance might send the price higher. The next key resistance sits at ,000, above which the price might gain traction and rise toward the ,080 level.
If there is a clear move above the ,080 level, the price might rise and test the ,220 resistance. Any more gains could send Ether toward the ,350 resistance zone.
Another Decline In ETH?
If Ethereum fails to clear the ,940 resistance, it could continue to move down. Initial support on the downside is near the ,860 level and the trend line.
The next major support is near the ,800 zone or the 50% Fib retracement level of the upward move from the ,630 swing low to the ,973 high. A clear move below the ,800 support might push the price toward ,720. Any more losses might send the price toward the ,630 level in the near term.
Technical Indicators
Hourly MACD – The MACD for ETH/USD is losing momentum in the bullish zone.
Hourly RSI – The RSI for ETH/USD is still above the 50 zone.
Major Support Level – ,800
Major Resistance Level – ,940
PEPE Frenzy: 100% Gains In 30 Days, But Can The Memecoin Keep Its Composure?
The cryptocurrency world is witnessing a familiar sight: a meme coin on fire. PEPE, a token emblazoned with the internet’s favorite frog, has skyrocketed in recent weeks, leaving investors wondering if this is the dawn of a new era or a fleeting fad.
PEPE On A Tear: New Highs And Whale Activity
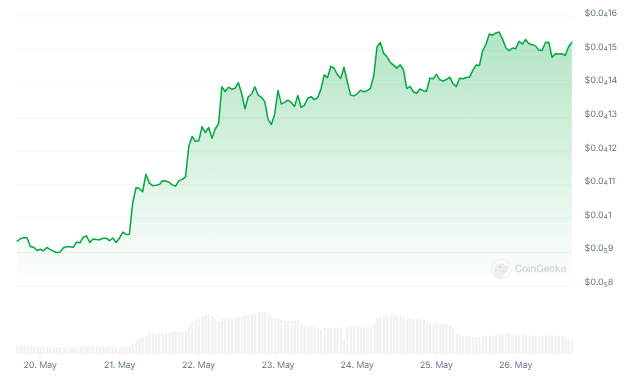
Over the past month, PEPE has been on a tear, exceeding expectations and leaving a trail of green for investors. The price triumphantly reached a new all-time high, surging over 100% in just 30 days. This astronomical rise translated to happy hodlers, with IntoTheBlock data revealing that a whopping 97% were sitting pretty in profit.
CoinGecko data show that Pepe has risen 56% in the previous week and 99% in the last month, recovering its position as the third-largest meme coin by market capitalization from Dogwifhat (WIF).
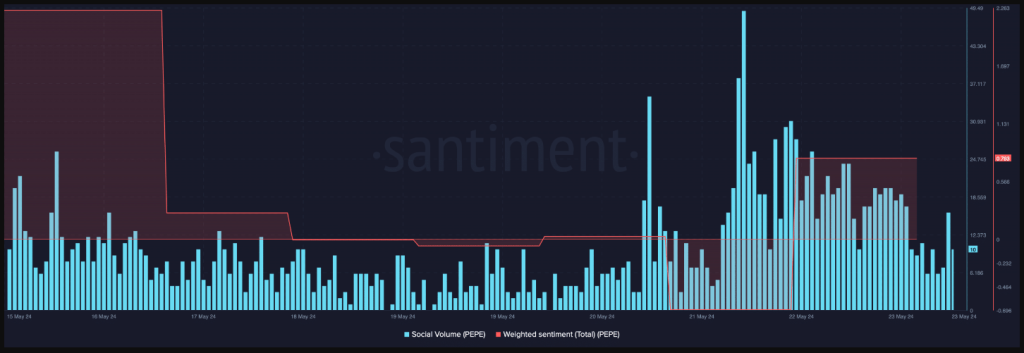
The bullish momentum hasn’t shown any signs of slowing down. The past 24 hours saw another surge of 3.7%, further propelling PEPE to its current peak. This impressive performance has garnered significant attention, not just financially, but also on social media. The coin’s social volume has spiked, indicating a surge in interest and online chatter.
Adding fuel to the fire, a whale, a term used for large investors with significant buying power, has been making waves. Lookonchain, a blockchain analytics platform, recently reported a whale withdrawing a staggering 500 billion PEPE from Binance, a major cryptocurrency exchange. This mass accumulation suggests a whale-sized vote of confidence in PEPE’s future.
Buying Frenzy Or Overheated Engine?
While the recent price increase and social media buzz are undoubtedly positive signs, some analysts are urging caution. A closer look at technical indicators reveals potential signs of an overheated market. The Chaikin Money Flow (CMF), which measures buying and selling pressure, has registered a decline.
Similarly, the Money Flow Index (MFI) and Relative Strength Index (RSI) are both hovering in the overbought zone, suggesting PEPE’s price might be due for a correction.
Further complicating the picture is the presence of selling pressure. While some investors are piling in, others might be cashing out on their profits. Santiment, a crypto analytics platform, observed a rise in PEPE’s exchange outflow last week, indicating buying pressure. However, they also noted an increase in supply on exchanges, suggesting some investors might be taking advantage of the high price to sell.
Potential Price Correction
NewsBTC analyzed PEPE’s daily chart to gauge the impact of this potential selling pressure. Their analysis suggests that the price might first fall to .0000122 before potentially finding support and initiating another bull run. However, a deeper correction could see PEPE plummet to .000010 or even lower.
The Most Traded Memecoin
Meanhwhile, Pepe was still among the most traded cryptocurrency assets over the previous day, according to data from Binance, with only BNB Coin (BNB), Bitcoin (BTC), and Ethereum (ETH) surpassing it.
Pepe continues to be the most traded meme coin, surpassing popular coins such as Dogecoin (DOGE), Floki (FLOKI), and Shiba Inu (SHIB).
Featured image from ART street, chart from TradingView
Ethereum Price Rally: Far from Over, More Gains Ahead!
Ethereum price extended its increase and tested ,840. ETH is holding gains and seems to be eyeing a move toward the ,000 level.
- Ethereum started a fresh increase and traded above the ,750 resistance zone.
- The price is trading above ,700 and the 100-hourly Simple Moving Average.
- There is a short-term bullish trend line forming with support at ,710 on the hourly chart of ETH/USD (data feed via Kraken).
- The pair could continue to move up unless there is a break below the ,380 support.
Ethereum Price Eyes Additional Gains
Ethereum price started a fresh surge after reports of increased hopes of ETH ETF. There was a move above the ,500 and ,650 resistance levels.
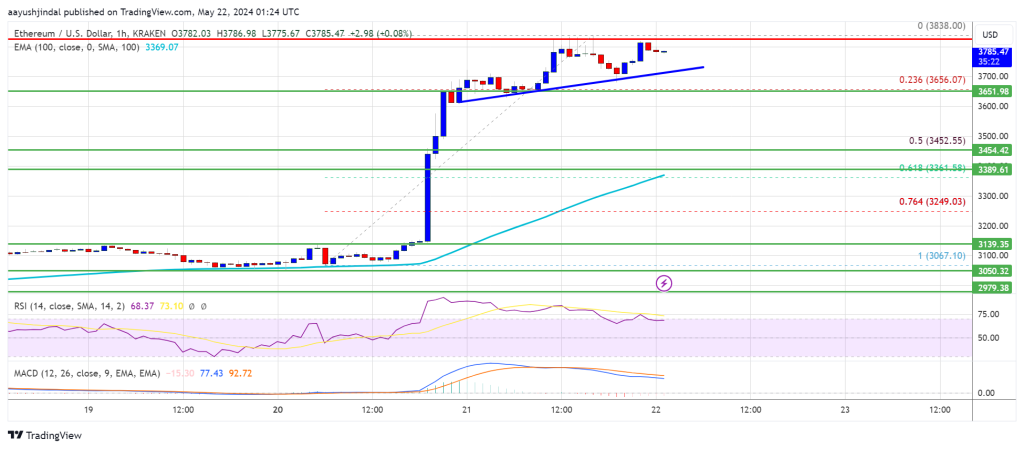
ETH outperformed Bitcoin and even climbed above the ,750 level. A new weekly high was formed at ,838 and the price is now consolidating gains. It is trading well above the 23.6% Fib retracement level of the upward wave from the ,065 swing low to the ,838 high.
Ethereum is now trading above ,700 and the 100-hourly Simple Moving Average. There is also a short-term bullish trend line forming with support at ,710 on the hourly chart of ETH/USD.
Immediate resistance is near the ,840 level. The first major resistance is near the ,880 level. An upside break above the ,880 resistance might send the price higher. The next key resistance sits at ,950, above which the price might gain traction and rise toward the ,000 level.
If there is a clear move above the ,000 level, the price might rise and test the ,080 resistance. Any more gains could send Ether toward the ,200 resistance zone.
Are Dips Limited In ETH?
If Ethereum fails to clear the ,840 resistance, it could start a downside correction. Initial support on the downside is near the ,710 level and the trend line.
The next major support is near the ,620 zone. A clear move below the ,620 support might push the price toward ,450 or the 50% Fib retracement level of the upward wave from the ,065 swing low to the ,838 high. Any more losses might send the price toward the ,380 level in the near term.
Technical Indicators
Hourly MACD – The MACD for ETH/USD is gaining momentum in the bullish zone.
Hourly RSI – The RSI for ETH/USD is now correcting from the 75 zone.
Major Support Level – ,620
Major Resistance Level – ,840
US Spot Bitcoin ETFs Maintain Momentum With Sixth Day of Positive Gains
 According to the latest data, U.S. spot bitcoin exchange-traded funds (ETFs) have experienced positive inflows for six consecutive days. Over this period, the spot bitcoin ETFs attracted a total of .186 billion. Ark Invest’s ARKB Tops Inflows as U.S. Bitcoin ETFs Gain 7 Million Spot bitcoin ETFs in the U.S. continued their streak of positive […]
Bitcoin News
Top Defi Tokens See Double-Digit Gains as Ethereum Soars
 Amid ethereum’s value increase, the decentralized finance (defi) ecosystem has significantly benefited from ether’s double-digit growth. Leading defi tokens by market capitalization rose by 14.8% over the past day, and the total value locked (TVL) in defi exceeded 0 billion in the last 24 hours. Defi Protocols and Tokens Benefit From Ethereum’s Meteoric Rise The […]
Bitcoin News
Mining Rig Producer Canaan’s Q1 Unrealized Gains Narrow Net Loss to $39.4 Million
 In the first quarter of 2024, Canaan Inc. generated .1 in revenues versus the .4 million in costs incurred in the same period which resulted in the company recording a gross loss of .3 million. Nangeng Zhang claimed that Canaan’s revenues in the last quarter exceeded expectations due to the company’s persistent sales efforts and […]
Bitcoin News
Mining Rig Producer Canaan’s Q1 Unrealized Gains Narrow Net Loss to $39.4 Million
In the first quarter of 2024, Canaan Inc. generated .1 in revenues versus the .4 million in costs incurred in the same period which resulted in the company recording a gross loss of .3 million. Nangeng Zhang claimed that Canaan’s revenues in the last quarter exceeded expectations due to the company’s persistent sales efforts and […]
Bitcoin News
Bitcoin Price Consolidates Gains: Stability in the Crypto Market Amid Recent Surge
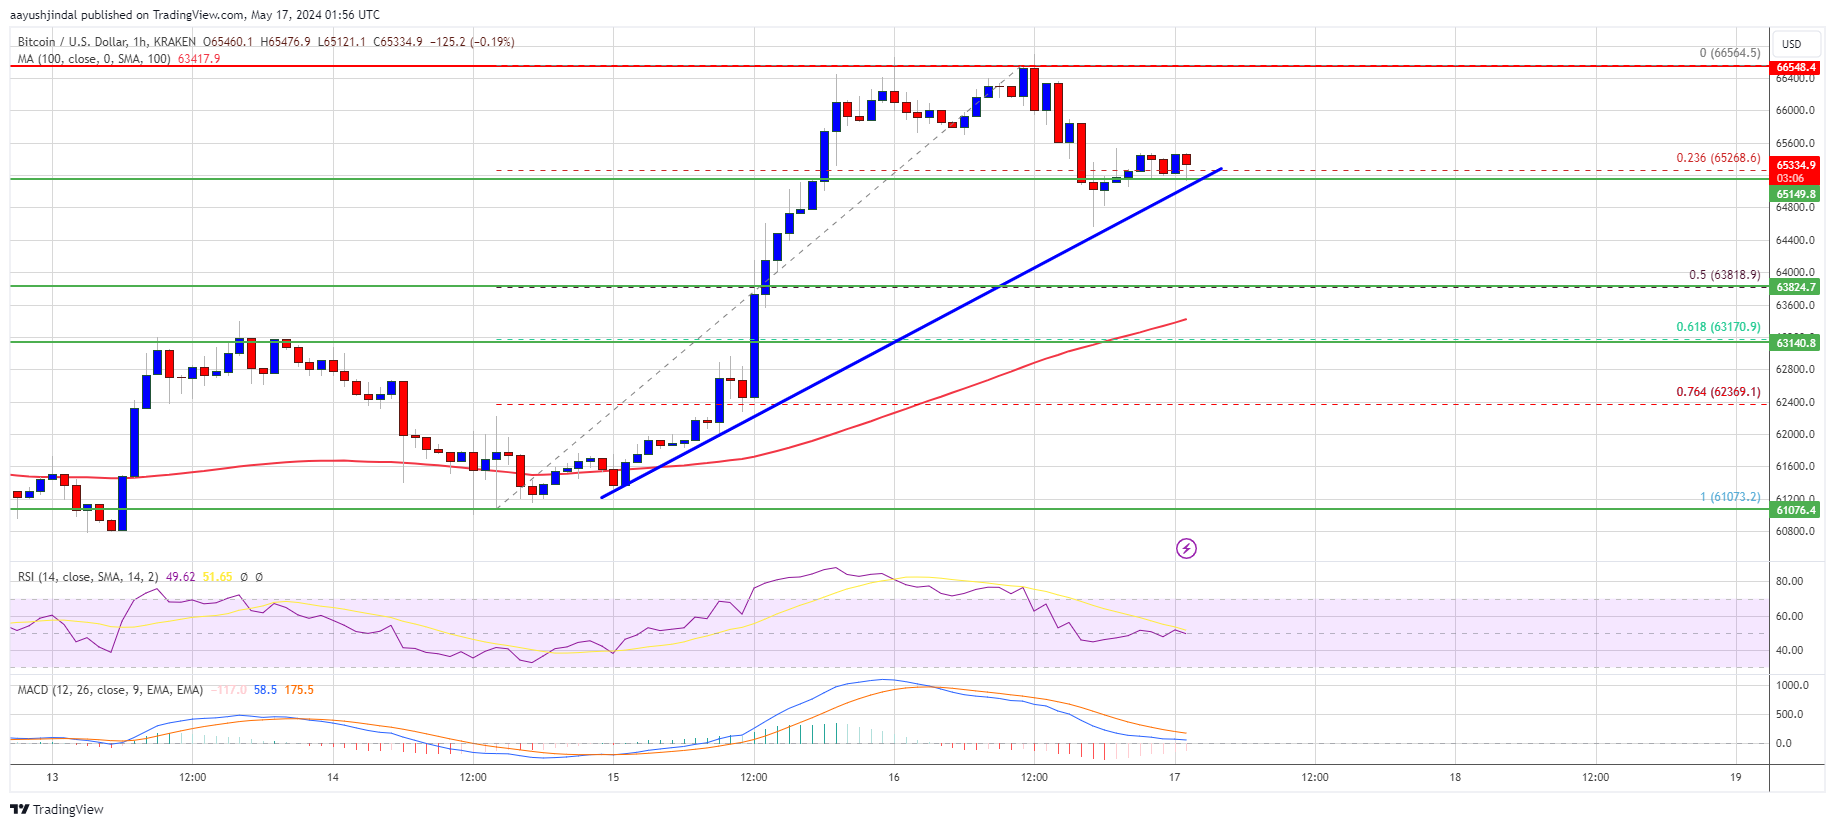
Bitcoin price rallied and tested the ,500 zone. BTC is now consolidating gains and might attempt another increase toward ,500.
- Bitcoin started a consolidation phase from the ,500 resistance zone.
- The price is trading above ,000 and the 100 hourly Simple moving average.
- There is a key bullish trend line forming with support at ,150 on the hourly chart of the BTC/USD pair (data feed from Kraken).
- The pair could start another increase unless the bears push it below ,800.
Bitcoin Price Remains Supported
Bitcoin price formed a base and started a fresh increase above the ,500 level. BTC even cleared the ,500 resistance and tested the ,500 region. A new weekly high was formed at ,565 and the price is now consolidating gains.
There was a minor decline below the ,000 level. The price dipped below the 23.6% Fib retracement level of the upward move from the ,073 swing low to the ,565 high.
Bitcoin price is now trading above ,000 and the 100 hourly Simple moving average. There is also a key bullish trend line forming with support at ,150 on the hourly chart of the BTC/USD pair. Immediate resistance is near the ,600 level.
The first major resistance could be ,000. The next key resistance could be ,500. A clear move above the ,500 resistance might send the price higher. In the stated case, the price could rise and test the ,200 resistance.
If the bulls remain in action, the price could rise toward the ,000 resistance zone. Any more gains might send BTC toward the ,000 barrier.
Another Decline In BTC?
If Bitcoin fails to climb above the ,000 resistance zone, it could continue to move down. Immediate support on the downside is near the ,150 level and the trend line.
The first major support is ,200. The main support is now forming near ,800 or the 50% Fib retracement level of the upward move from the ,073 swing low to the ,565 high. Any more losses might send the price toward the ,150 support zone in the near term.
Technical indicators:
Hourly MACD – The MACD is now losing pace in the bullish zone.
Hourly RSI (Relative Strength Index) – The RSI for BTC/USD is now above the 50 level.
Major Support Levels – ,150, followed by ,800.
Major Resistance Levels – ,000, ,500, and ,200.