 Paxos has secured full approval from the Monetary Authority of Singapore (MAS) to offer digital payment token services, positioning Singapore as a key player in Paxos’s global stablecoin operations. The approval permits the issuance of stablecoins compliant with MAS’s forthcoming regulatory framework. DBS Bank Named Main Banking Partner as Paxos Secures MAS Approval Paxos, a […]
Bitcoin News
Crypto Market Bounces Back, Mog Coin and ENS See Double-Digit 7 Day Gains
 On Monday, July 1, 2024, the overall crypto economy rose by 2.31%, reaching a total value of .31 trillion. Bitcoin increased by 2.8% this week, and ethereum climbed 4.8%, while several digital assets posted double-digit gains. Leading the performance chart over the past seven days was mog coin (MOG), which appreciated by 82.1% against the […]
Bitcoin News
Avalanche Gains Momentum As AVAX Sets Sights On $30.34 Resistance
Avalanche (AVAX) has recently shown a strong correctional upswing, sparking renewed interest among investors and traders. This upward momentum comes after a rejection at .49 and indicates a potential challenge to the .34 resistance level.
As AVAX approaches this critical threshold, market participants are closely watching to see if the cryptocurrency can maintain its bullish trajectory and break through the resistance. The .34 level is now a focal point, determining whether Avalanche can sustain its rally and continue to climb higher.
This article focuses on the use of technical indicators to examine AVAX’s current price movement to predict potential Scenarios if the price reaches the .34 resistance level.
Analyzing Avalanche’s Current Upswing
Currently, on the 4-hour chart, the price of AVAX is actively trading above the 100-day Simple Moving Average (SMA). Although the price tends to be moving in a consolidating manner, there are possibilities that it could extend its upswing.
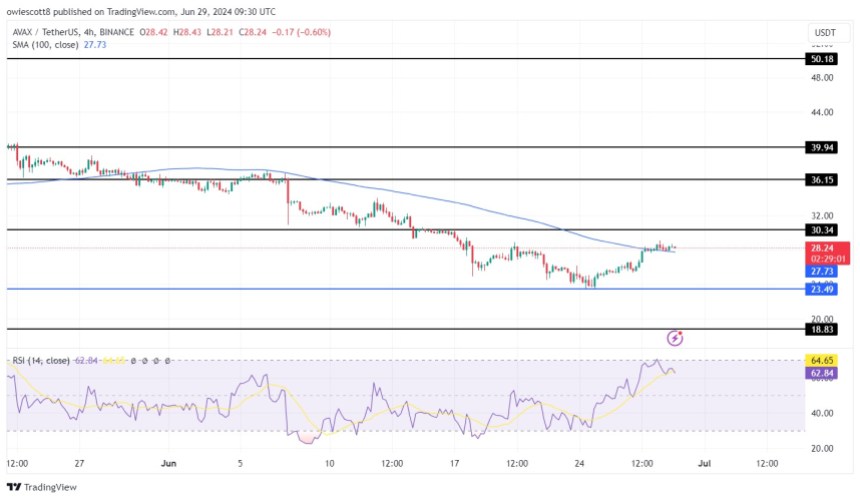
Also, while the signal line of the 1-day Relative Strength Index (RSI) signals that the price of Avalanche may go bearish, this is just a short-term movement, which at some point, the price may begin to rise again.
Meanwhile, on the 1-day chart, despite still trading below the 100-day SMA, Avalanche is actively bullish as it is attempting a correctional upward movement toward the .34 resistance level with consistent momentum.
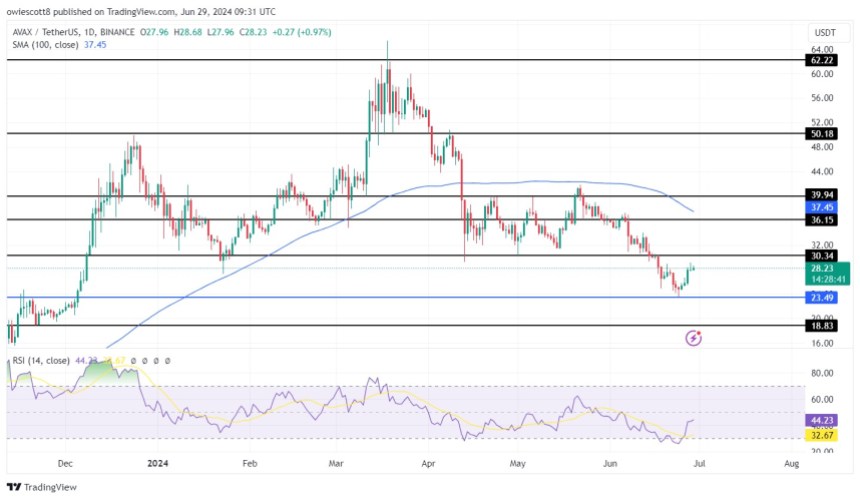
The formation of the 1-day RSI indicator also confirms this current price bullishness as the signal line of the indicator seems to have moved out of the oversold zone towards the 50% level. Thus, it can be considered that AVAX’s price may undergo a brief pullback before challenging the .34 resistance level
Breaking Through Or Facing Rejection At .34?
Exploring the possible outcomes of Avalanche, it was discovered that if AVAX’s price reaches the .34 resistance level and breaks above, it may continue to rise higher to test the .15 resistance level and potentially move on to challenge other higher levels if it breaches this .15 level.
However, if the crypto asset faces rejection at the .34 resistance, it will begin to decline toward the .49 support level. If this level is breached, it may continue to decline to test the .81 support level and may move on to test other lower levels following a break below the .81 level.
AVAX’s price was trading at around .23 and was up by 1.01% with a market capitalization of over billion and a trading volume of over 6 million as of the time of writing. There has been a 24-hour increase of 1.01% in AVAX’s market capitalization and a 3.07% decrease in its trading volume.
US Bitcoin ETF Inflows Reach $21.52M as FBTC and GBTC Lead Gains
 U.S. spot bitcoin exchange-traded funds witnessed a second day of inflows as they captured .52 million on Thursday. The leader in terms of gains was Fidelity’s FBTC led the pack with a million increase. Modest Inflows for Bitcoin ETFs on Thursday With Fidelity’s FBTC Leading the Pack The 11 spot bitcoin ETFs had a […]
Bitcoin News
Brett Price Surging as Base Dawgz Shows Potential for Similar Gains
 The Base blockchain is buzzing with interest in meme coins again. Brett (BRETT) has been making headlines after its price shot up for two days straight. While investors digest this surprise rally, a new project, Base Dawgz (DAWGZ), is drawing attention for its potential to replicate BRETT’s success. BRETT Price Soars as Open Interest Trends […]
Bitcoin News
Ethereum Price Trims Gains as Bitcoin Slump Drags Crypto Market
Ethereum price struggled to climb above the ,550 resistance and trimmed gains. ETH gained bearish momentum alongside Bitcoin and tested the ,385 zone.
- Ethereum is trimming gains from the ,550 resistance zone.
- The price is trading below ,500 and the 100-hourly Simple Moving Average.
- There is a key bearish trend line forming with resistance near ,465 on the hourly chart of ETH/USD (data feed via Kraken).
- The pair could gain bearish momentum if it dips below the ,385 and ,350 support levels.
Ethereum Price Dips Further
Ethereum price struggled to start a fresh increase above the ,550 zone. ETH followed Bitcoin’s bearish path and the price declined below the ,500 level. The bears pushed the price below the ,420 support zone.
A low was formed at ,388 and the price is now consolidating losses. It is struggling near the 23.6% Fib retracement level of the recent decline from the ,543 swing high to the ,388 low. There is also a key bearish trend line forming with resistance near ,465 on the hourly chart of ETH/USD.
Ethereum is now trading below ,500 and the 100-hourly Simple Moving Average. On the upside, the price might face resistance near the ,430 level. The first major resistance is near the ,465 level and the trend line.
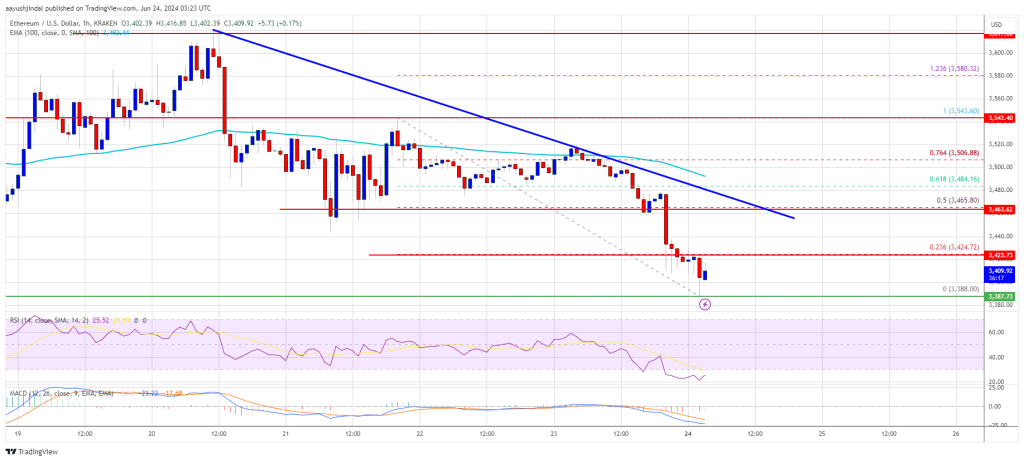
The trend line is near the 50% Fib retracement level of the recent decline from the ,543 swing high to the ,388 low. The main resistance sits at ,520 or ,550. An upside break above the ,550 resistance might send the price higher. The next key resistance sits at ,650, above which the price might gain traction and rise toward the ,720 level. Any more gains could send Ether toward the ,880 resistance zone in the coming days.
More Downsides In ETH?
If Ethereum fails to clear the ,465 resistance, it could start another decline. Initial support on the downside is near ,385. The first major support sits near the ,350 zone.
A clear move below the ,350 support might push the price toward ,220. Any more losses might send the price toward the ,100 level in the near term.
Technical Indicators
Hourly MACD – The MACD for ETH/USD is gaining momentum in the bearish zone.
Hourly RSI – The RSI for ETH/USD is now below the 50 zone.
Major Support Level – ,350
Major Resistance Level – ,465
Bitcoin’s Power Law Model Gains Traction Despite Market Fluctuations
 In 2020 and early 2021, the stock-to-flow (S2F) bitcoin price model captured widespread attention. Although bitcoin currently stands over 13% below its peak value reached in March, the Power Law Corridor model has become increasingly influential. Many hold the view that the Power Law model’s support line has remained steadfast for over ten years and […]
Bitcoin News
PlayDoge Meme Coin Hits New Heights with $4.5M Presale Raise, Analyst Forecasts Big Gains
 PlayDoge (PLAY) is cementing itself as one of the most anticipated new meme coin launches this year. The retro Play-to-Earn project has blown past the .5 million milestone in presale. And with that early backing, some analysts believe PLAY could be in line for sizable gains once listed on DEXs. ‘90s Nostalgia Fuels Early Demand […]
Bitcoin News
NFT Market Sees Gains for Second Consecutive Week, Sales Up 10.95%
 Non-fungible token (NFT) sales increased by 10.95% this week compared to the previous week, marking the second consecutive week of gains. Despite a 76.7% drop in the number of buyers, blockchain-issued digital collectibles achieved 1.73 million in sales. NFT Market Trends: Bitcoin and Ethereum Lead Sales Volume In the previous week, NFT sales had risen […]
Bitcoin News
Uniswap Price on the Rise: UNI Eyes Set on Further Gains
UNI price started a fresh increase above the .50 resistance. Uniswap is showing positive signs and might eye more upsides above the .00 resistance.
- UNI started a fresh increase above the .50 resistance zone.
- The price is trading above .60 and the 100-hourly simple moving average.
- There is a key bearish trend line forming with resistance near .15 on the hourly chart of the UNI/USD pair (data source from Kraken).
- The pair might aim for more upside if there is a clear move above the .20 resistance.
UNI Price Holds Support
After forming a base above the .75 level, Uniswap started a fresh increase like Bitcoin and Ethereum. UNI price gained pace for a move above the .20 and .50 resistance levels.
The price even cleared the .00 resistance zone. A high was formed at .32 before the price started a downside correction. There was a drop below the .00 level and the 23.6% Fib retracement level of the upward move from the .72 swing low to the .32 high.
UNI is still trading above .50 and the 100-hourly simple moving average. Immediate resistance is near the .00 level. The next key resistance is near the .20 level. There is also a key bearish trend line forming with resistance near .15 on the hourly chart of the UNI/USD pair.
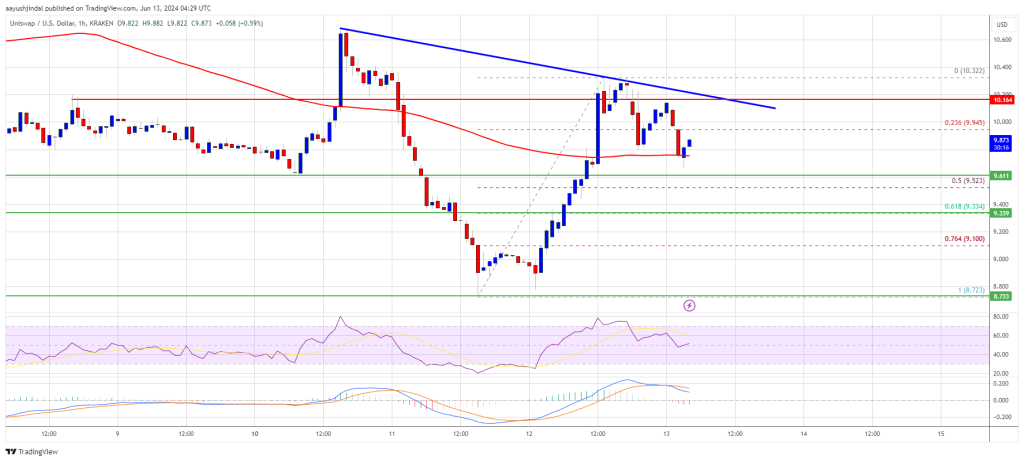
A close above the .20 level could open the doors for more gains in the near term. The next key resistance could be near .65, above which the bulls are likely to aim a test of the .50 level. Any more gains might send UNI toward .00.
Are Dips Limited In Uniswap?
If UNI price fails to climb above .00 or .20, it could slowly move down. The first major support is near the .50 level or the 50% Fib retracement level of the upward move from the .72 swing low to the .32 high.
The next major support is near the .35 level. A downside break below the .35 support might open the doors for a push toward .00.
Technical Indicators
Hourly MACD – The MACD for UNI/USD is losing momentum in the bullish zone.
Hourly RSI (Relative Strength Index) – The RSI for UNI/USD is above the 50 level.
Major Support Levels – .50, .35, and .00.
Major Resistance Levels – .00, .20, and .65.