 Following a sequence of five days of net outflows, U.S. spot bitcoin exchange-traded funds (ETFs) experienced modest inflows on Friday, capturing nearly 900 bitcoins from the market, totaling .7 million. Concurrently, Grayscale’s Bitcoin Trust (GBTC) teeters on the brink of falling below the 300,000 mark, as it recorded a holding of 304,970.43 bitcoins as of […]
Bitcoin News
$9.5 Billion In Bitcoin Options Poised To Expire This Friday: Market Turbulence Ahead?
This Friday, the spotlight is turned to Deribit, the leading crypto derivatives exchange, as it gears up for a notable event in its trading history. Particularly, the exchange is poised to witness the expiration of over .5 billion in Bitcoin options open interest.
For context, Open interest refers to the total number of outstanding derivative contracts, such as futures or options, that have not been settled or closed. It represents the number of contracts market participants hold at the end of each trading day.
This surge in open interest recorded by Deribit reflects increased market participation and signals heightened liquidity, marking a notable milestone in the crypto derivatives landscape.
Record-Breaking Open Interest
Notably, this event is significant in two ways: It underscores the growing interest in Bitcoin as an asset class and highlights the increasing “sophistication” of the cryptocurrency market. This is because Open interest can also serve as a critical indicator of market health and trader sentiment.
As such, the record levels of open interest set to expire on Deribit suggest a “vibrant” trading environment, with more investors engaging in complex financial instruments like options.
According to Deribit data, the exchange is set to host one of its largest option expiries ever, with .5 billion worth of Bitcoin options poised for expiry at the end of the month. This figure represents a substantial portion, approximately 40%, of the exchange’s total options open interest, which stands at .3 billion.
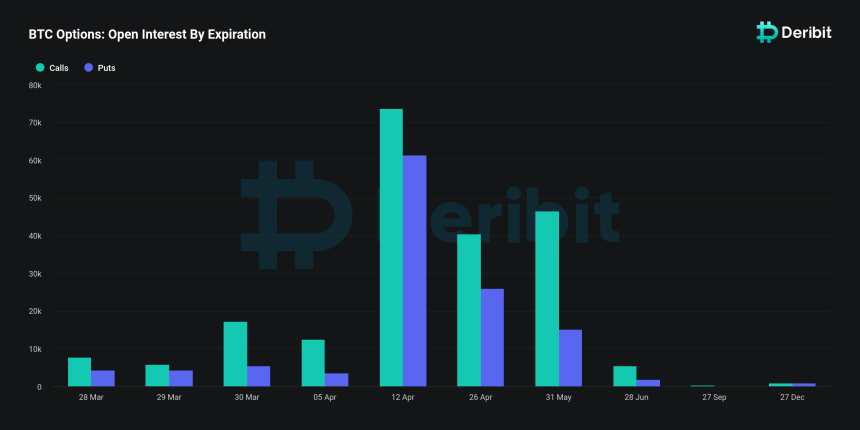
The magnitude of this expiry event eclipses previous months, with January and February end-of-month expiries totaling .74 billion and .72 billion, respectively. This trend indicates a large increase in market activity and investor engagement on the platform.
Implications Of The Bitcoin Expiry
The upcoming expiry has notable implications for the market, especially considering the current pricing dynamics of Bitcoin.
With Bitcoin’s spot price hovering below ,000, an estimated .9 billion of the open interest is expected to expire “in the money,” according to Deribit analysts, presenting profitable opportunities for holders of these options contracts.
The “max pain” price, which represents the strike price at which the highest number of options would expire worthless, thereby causing the maximum financial loss to option holders, is identified at ,000.
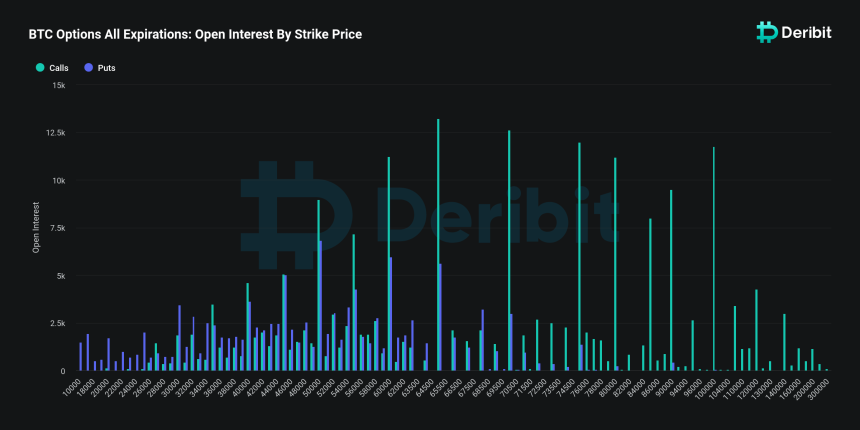
According to the analysts, this scenario suggests that a significant number of traders are positioned to benefit from the current market conditions, potentially leading to “increased buying activity” as these options are exercised.
Additionally, Deribit analysts speculate that the high level of “in-the-money expiries” could exert upward pressure on Bitcoin’s price or amplify market volatility. They added that as traders “hedge their positions” or “speculate on future price movements,” the market may witness a flurry of activity, impacting Bitcoin’s price trajectory in the short term.
This comes at a time when Bitcoin has experienced a slight retracement from its recent all-time high above ,000, with the price adjusting to approximately ,946, at the time of writing
Featured image from Unsplash, Chart from TradingView
Biggest Movers: AVAX 7% Higher, TON Maintains Bullish Momentum on Friday

Avalanche rose to a six-week high on Friday, after the token climbed above a key resistance level. The move saw price rise by as much as 7%, despite the global crypto market cap mostly in the red in today’s session. Toncoin remained higher, following recent gains.
Avalanche (AVAX)
Avalanche (AVAX) was a big mover on Friday, as the cryptocurrency rose by as much as 7% during the day.
Following a low of .85 on Thursday, AVAX/USD rose to a peak of .80 earlier in today’s session.
The move pushed avalanche to its highest level since August 29, past a key price ceiling of .00 in the process.
Looking at the chart, the relative strength index (RSI) also escaped a resistance level of its own at 65.00.
At the time of writing, price strength now resides at 68.54, which is its highest point since mid-April this year.
The next target for current buyers will likely be .00, however with the price now overbought, a reversal could also be on the cards.
Toncoin (TON)
Toncoin (TON) was in the green for a second straight session, moving closer to a key resistance level in the process.
TON/USD jumped nearly 3% higher on Friday, peaking at the .15 level at the time of writing.
Overall, this is the strongest point TON has hit since the end of September, when price last collided with a ceiling of .25.
From the chart, it appears that this occurred as the RSI continued to close in on a ceiling at the 57.00 mark.
With price strength now at a reading of 54.22, the chances are high that a move to 57.00 will result in toncoin trading at .25.
Register your email here to get weekly price analysis updates sent to your inbox:
Do you expect toncoin bulls to push price above .25 this weekend? Let us know your thoughts in the comments.
Biggest Movers: XRP Rebounds on Friday, Following Recent Decline

After being the victim of a red wave on Thursday, XRP rebounded in today’s session, as crypto bulls remained resilient. The global market cap is up by 0.40% at the time of writing, following a 2% drop yesterday. Stellar was another strong mover on Friday, and is currently up 2.25%
XRP
XRP was back in the green on Friday, after bulls abruptly ended a three-day win streak during yesterday’s session.
Following a low at .5025 on Thursday, XRP/USD moved to a peak at .5134 earlier in the day.
The surge saw XRP, formerly ripple, once again make strides towards a key resistance level at .5450.
From the chart, it appears that the rebound came as the relative strength index (RSI) climbed back above a ceiling at 47.00.
At present, price strength is now sitting at 48.72, with the next visible ceiling near the 54.00 region.
In the event this target is hit, there is a strong likelihood that XRP moves above .5400.
Stellar (XLM)
Stellar (XLM) was also in the green in today’s session, after two consecutive days of price declines.
XLM/USD peaked at .1154 earlier in the day, which comes less than 24 hours after falling to a low of .1122.
As a result of the decline, bulls continued to push the token away from a recent floor at .1100, and back on course toward resistance at .1320.
Today’s rebound was helped by the RSI reaching a floor of its own at 37.00, and it is now tracking at 39.87.
A ceiling at 44.00 now awaits bulls, and could be the main hurdle preventing further gains this weekend.
Register your email here to get weekly price analysis updates sent to your inbox:
Where will stellar end this weekend? Let us know your thoughts in the comments.
Biggest Movers: LTC, XRP Plunge 15% Lower on Friday

Litecoin was one of the notable movers during Friday’s crypto blood bath, as markets reacted to speculation that Spacex had sold over 0 million in bitcoin. Today’s sell-off saw the global market cap fall by roughly 6.20%, at the time of writing. XRP also fell significantly.
Litecoin (LTC)
Litecoin (LTC) fell by as much as 15% on Friday, as a red wave washed over the cryptocurrency market.
LTC/USD fell to a low of .76 late on Thursday, which came following a high of .73 earlier in the day.
This decline pushed LTC to its lowest point since December 19, when price traded to a low of .00.
As a result of this sell-off, the relative strength index (RSI) fell below the 30.00 level, which means price is oversold.
At the time of writing, the index is tracking at 18.21, which is its weakest point since November 2018.
The price has since moved away from earlier lows, and is currently trading at .80.
XRP
Additionally, XRP, formerly ripple, also had significant declines on Friday, falling to a multi-month low of its own.
After climbing to a high of .5852 on Thursday, XRP/USD dropped to an intraday low of .4681 later in the session.
The move saw XRP dive to its weakest point since May 16, when the price traded around the .4300 region.
This drop saw the token marginally break out of a key support point at .4600, wiping out all gains accrued following the ripple ruling.
Like with bitcoin above, price strength is now oversold, which prompted bulls to reenter, pushing XRP slightly higher.
As of writing, the token is trading at .5087.
Register your email here to get weekly price analysis updates sent to your inbox:
Will sentiment remain lower this weekend? Let us know your thoughts in the comments.
Biggest Movers: SHIB Surges to 2-Week High on Friday, Whilst TRX Extends Gains

Shiba inu was a notable gainer on Friday, climbing to a two-week high during today’s session in the process. The move came as the meme coin rose by as much as 6%, despite the global crypto market cap mostly consolidating. Tron rose for a fourth straight session today.
Shiba Inu (SHIB)
Shiba inu (SHIB) rallied to a two-week high on Friday, after breaking out of a key resistance level.
SHIB/USD surged to a peak of .000008217 earlier in today’s session, following Thursday’s low at .000007754.
Friday’s move came as shiba inu broke out of a key resistance level at the .000008000 mark, hitting its highest point since June 15 in the process.
Another reason for today’s action appears to be the relative strength index (RSI) moving above a ceiling at 55.00.
Currently, price strength is tracking at the 60.09 level, which is marginally below a ceiling at 61.00.
Should bulls manage to race past this point, there is a good chance the next target price will be .000008500.
Tron (TRX)
Tron (TRX) extended a recent bull run for a fourth day, with today’s move taking the token to its highest point since last Sunday.
Following a low of .08221 on Thursday, TRX/USD climbed to an intraday high of .08417 earlier in today’s session.
Tron bulls appear to be targeting a resistance level at .0860, which was last hit during last Saturday’s peak of .0943.
Since hitting that 20-month high TRX has mostly consolidated, however bullish momentum seems to be gradually returning.
This comes after the relative strength index (RSI) moved beyond a ceiling of its own at 63.00, and is now tracking at 64.84.
If current sentiment remains, TRX could reach .0860 in the coming days.
Register your email here to get weekly price analysis updates sent to your inbox:
What is behind tron’s recent bull run? Let us know your thoughts in the comments.
Bitcoin, Ethereum Technical Analysis: BTC Falls Below $30,000 on Friday, a Week After XRP Ruling

Bitcoin dropped below the ,000 level on Jul 21, as market sentiment continued to trend lower in today’s session. This comes a week after cryptocurrency markets surged following the XRP ruling, however momentum has since faded as a result of profit taking. Ethereum was also down on Friday.
Bitcoin
Bitcoin (BTC) remained in the red on Friday, as the cryptocurrency moved back below the ,000 level.
After hitting a high of ,406.45 on Thursday, BTC/USD fell to a bottom at ,638.10 earlier in the day.
This decline resulted in bitcoin moving near Tuesday’s floor at ,525, which was a one-month low.
The latest sell-off came as the relative strength index (RSI) dropped below a key support point at 49.00.
Currently, price strength is tracking at 48.09, with the 46.00 mark a potential target for sellers.
Additionally, the 10-day (red) moving average has begun separating from its 25-day (blue) counterpart, which could be a sign of an upcoming downturn.
Ethereum
After making a strong rebound on Thursday, ethereum (ETH) was largely lower in today’s session.
ETH/USD edged to a bottom at ,879.73 earlier today, which comes a day after peaking around ,920.
Friday’s sell-off briefly sent ethereum below a support level of ,880, however bulls have since moved to stabilize this floor.
Unlike with BTC, ethereum’s 10-day (red) moving average remains upwards facing, which could be a sign of sentiment in the market being bullish.
In order to validate this theory, there will first have to be a breakout on the RSI, in particular of a ceiling at 52.00.
The index is currently tracking at 49.86.
Register your email here to get weekly price analysis updates sent to your inbox:
Could ethereum climb back above ,900 this week? Leave your thoughts in the comments below.
Biggest Movers: SOL Hits Fresh 4-Week High on Friday, ADA Snaps Losing Streak
Solana was one of Friday’s biggest gainers, as the cryptocurrency rose by over 11% during today’s session. The move came as markets reacted to June’s nonfarm payrolls report, which came in at 209,000, below expectations of 229,000. On the other hand, cardano ended a three-day losing streak.
Solana (SOL)
Solana (SOL) rallied for a second straight session on Friday, as the token rose above a ceiling at .00
SOL/USD hit an intraday peak at .22 earlier in today’s session, which came in response to the latest U.S. nonfarm payrolls report.
As a result of the surge, solana hit its strongest point since June 5, when the price peaked at .06
Looking at the chart, the move came as the relative strength index (RSI) broke out of a resistance level of 65.00.
At the time of writing, price strength is now tracking at 68.30, which is its highest level since April 14.
The next visible point of resistance appears to be at the 70.00 level, and in the event it reaches this point, it is likely that SOL will hit .50.
Cardano (ADA)
Cardano (ADA) rebounded in today’s session, as the cryptocurrency snapped a three-day losing streak.
After falling to a low of .278 on Thursday, ADA/USD jumped to a high of .2874 earlier in the day.
The move saw cardano rebound from a one-week low, as bulls reentered the market close to a floor at .2875.
One of the catalysts of this rally was the 14-day RSI, which bounced on its own support point at the 43.00 zone.
As of writing, the index is now tracking at 45.25, a point that is marginally below a ceiling at 46.00.
Earlier gains have somewhat eased as a result of this, with ADA now trading at .2842.
Register your email here to get weekly price analysis updates sent to your inbox:
Do you expect cardano to extend today’s gains into the weekend? Let us know your thoughts in the comments.
Biggest Movers: LTC, BCH Surge 20% Higher on Friday

Litecoin surged by as much as 20% in today’s session, as bulls took the token to its highest level since April. The move came prior to the latest consumer sentiment report from the U.S, which rose to a reading of 64.4. Bitcoin cash climbed to its highest point since April 2022.
Litecoin (LTC)
Litecoin (LTC) rose above 0.00 for the first time since April, as traders seemingly remained bullish on the token following its recent listing on EDX markets.
LTC/USD hit an intraday peak of 2.38 earlier in today’s session, which came following a low of .25 the day before.
As a result of the rally, litecoin peaked at its strongest point since April 18, when price reached a top at 3.41.
Today’s move came as bulls were able to break out of a recent resistance level of .00, with the relative strength index (RSI) doing similar.
Litecoin’s price strength surged past a ceiling at the 62.00 mark, on its way to a current reading of 65.43.
Should momentum continue, bulls will likely ease pressure closer to an upcoming level of 68.00.
Bitcoin Cash (BCH)
Bitcoin cash (BCH) made significant gains for a second straight session, this time rising by over 20% to end the week.
Following a low of 1.21 on Thursday, BCH/USD raced to an intraday high at 2.77 earlier in the day.
As a result of this latest rally, BCH moved to its strongest point since April 18 last year, when price peaked at 5.00.
Looking at the chart, the latest rally has sent the RSI to a current reading of 86.97, which is significantly overbought.
The 10-day (red) moving average has also made a relatively high leap away from its 25-day (blue) counterpart.
This could signal a potential top, which could be tempting for bears waiting for the perfect time to reenter the market.
Register your email here to get weekly price analysis updates sent to your inbox:
Can bitcoin cash continue this bull run during the weekend? Let us know your thoughts in the comments.
Bitcoin, Ethereum Technical Analysis: BTC, ETH Rebound on Friday, as Markets Digest US Retail Sales Data
Bitcoin rose back above ,000 on Friday, as markets continued to digest recent U.S. economic data. Yesterday saw retail sales climb higher than expected, rising by 0.3% in May, better than a projected decline of 0.1%. Ethereum moved closer to the ,700 level.
Bitcoin
Bitcoin bulls made a brief appearance during Friday’s session, pushing the price back above ,000 in the process.
Following a low of ,797.17 on Thursday, BTC/USD raced to an intraday peak of ,735.31 earlier in the day.
As a result of the move, the world’s largest cryptocurrency climbed above a recent ceiling at the ,500 mark.
Despite today’s ,000 jump in price, the relative strength index (RSI) still remains below a resistance of its own at 42.00
At the time of writing, the index is tracking at 41.00, which could act as a major hurdle to further upwards momentum.
It will be interesting to see how traders behave over the coming weekend, with the chance to buy this week’s dip still present.
Ethereum
Ethereum (ETH) made relative gains in today’s session, as the cryptocurrency moved back towards the ,700 level.
ETH/USD reached a high of ,676.41 on Friday, less than 24 hours after nearing a breakout below ,600.
The rebound in ethereum comes as the RSI moved away from a recent three-month low of 30.74, which was in oversold territory.
Similar to BTC above, price strength has since climbed, and is currently at a reading of 33.39, which is still bearish.
Traders will likely look to March, which is the last time the index tracked at this mark, shortly before prices went on to climb over 0 higher.
Register your email here to get weekly price analysis updates sent to your inbox:
Do you expect long-term bulls to buy this current dip in price? Leave your thoughts in the comments below.