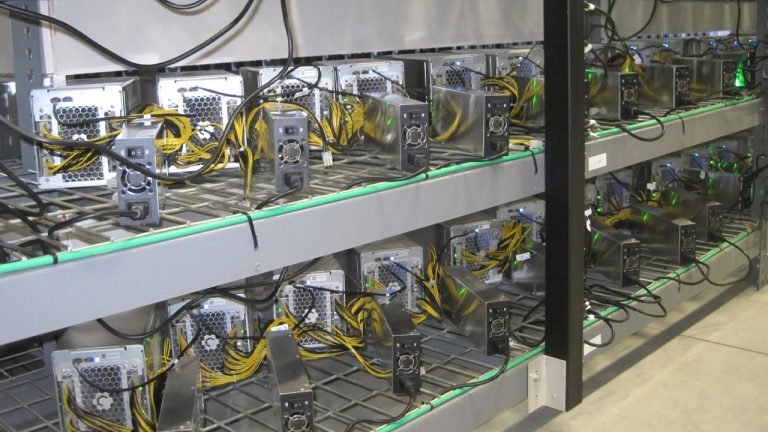
 This week witnessed significant expansions in the bitcoin mining sector, with two leading firms unveiling substantial increases in their operational hashrate. Terawulf disclosed that its self-mining business has escalated to 7.6 exahash per second (EH/s) this month. Concurrently, Cleanspark announced an enhancement in its fleet-wide operating hashrate, surpassing 14 EH/s. Terawulf Hashrate Reaches 7.6 EH/s […]
Bitcoin News
Mad Money Host Jim Cramer Doubts Bitcoin Will Find Its Footing as Selloff Continues

Jim Cramer, the host of CNBC’s Mad Money show, has doubled down on his bearish bitcoin price outlook, predicting that the cryptocurrency will continue to struggle against the backdrop of a plummeting crypto market. “Unlikely that bitcoin finds its footing,” Cramer emphasized, after previously declaring the recent price drop a “nasty beginning” to a significant downward spiral.
Jim Cramer Expects Further Bitcoin Price Drop
Mad Money host Jim Cramer weighed in on the price of bitcoin on social media platform X again this week. Cramer is a former hedge fund manager who co-founded Thestreet.com, a financial news and literacy website.
Cramer wrote on X Tuesday after the price of bitcoin fell below K: “Now that bitcoin’s down about 20% from its high I expect a strong stand to be made but it won’t hold because not enough money is coming in. New theme: Number Go Down.” On Monday, after the price of bitcoin dropped below K for the first time in 48 days, the Mad Money host wrote:
Unlikely that bitcoin finds its footing.
Many users on X slammed Cramer for his historically inaccurate bitcoin price predictions. Several pointed to the reverse Cramer effect, suggesting that a bullish market for bitcoin is on the horizon since Cramer consistently maintains a bearish stance. Many people see Cramer’s bearish bitcoin price prediction as a sign that the bottom is in.
Cramer has shared his outlook on the price of bitcoin several times following the approval of spot bitcoin exchange-traded funds (ETFs) by the U.S. Securities and Exchange Commission (SEC) on Jan. 10. The price of bitcoin pushed above K in anticipation of the SEC approving spot bitcoin ETFs but plunged after the approval.
Last week, Cramer said the price drop was a “Nasty beginning to the bitcoin selloff.” He also recently said BTC is topping out and that bitcoin cannot be killed, emphasizing that it’s a ” technological marvel” that is “here to stay.”
While Cramer has cautioned about the falling price of bitcoin, he said last week that he is not “stridently against” spot bitcoin ETFs, noting: “Bitcoin’s been around for 15 years, it’s fairly well-established, and I don’t want to try to stop anyone from speculating in this stuff, as long as they do their research.”
What do you think about Mad Money host Jim Cramer’s bitcoin price outlook? Let us know in the comments section below.
Polkadot (DOT) To Retest $9.88 Resistance – Can Bulls Regain Solid Footing?
Polkadot (DOT) price reveals that the extreme bullish movement pumped the price reaching .54.
- DOT price extremely bullish; set to retest .88 key resistance level.
- Support spotted at the .29 zone.
- Polkadot pumped up its price to .54.
DOT’s price trendline has spiked for the past couple of weeks following the coin’s overwhelming gains over the past few days.
Today, DOT/USD is trying to test the .87 key resistance level which is pretty strong. However, if the bulls continue to push further then DOT will have no problem breaching this critical resistance zone.
DOT Price Pumped To .54
On the 24-hour timeframe, DOT price has shown a boost in price value as it pumped its price to .54 a few hours ago.
According to CoinMarketCap, DOT is now trading at .49 or showing an impressive spike of 2.20% as of this writing. DOT price was down by a trickle in a few hours but is still on the green lane. The DOT/USD pair has shown a remarkable 10.05% gain in terms of value as seen in the past week which hints a continuation of the bull run.
On the flip side, trading volume for DOT tremendously fell by 12.66% which shows some weak spots in terms of momentum.
DOT/USD pair shows increased volatility as seen in the expansion of the Bollinger bands. The price is seen to be trading the upper limit with .99 as the current key resistance, and the lower band or .84 poised as the current support zone for the coin.
More so, the EMA is spotted at .10 with RSI at 64 which is indicates strong buying pressure in the market.
Polkadot Price Correction Anticipated
The 4-hour timeframe shows that DOT price breached upwards which was observed at the onset of the trading session which prompted the price to spike to .58, but when the selling pressure resurfaced, the price also went down in the last few hours.
The 4-hour chart for DOT shows a rather very mild volatility. The upper band is spotted at .84, while the lower band is found at .73. More so, the EMA trades at the .35 level with the RSI showing a mild downtrend as it continue to trade at index 62 propelled by the immense selling pressure.
DOT price reveals that the coin is working extremely hard to override the key resistance found at .87, as the price is still seen trading on the green. A price correction is expected for short-term or in a just a few hours before the coin retests the key resistance zone again.
On the other hand, if the bears manage to dominate the bulls, then DOT may hold on to .29 as its next support zone.
DOT total market cap at .3 billion on the weekend chart | Source: TradingView.com
Featured image from Bitcoin Addict, Chart from TradingView.com
NewsBTC
Polygon Maintains Solid Footing As MATIC Balloons By 300% Since June
Polygon (MATIC) price prediction relies heavily on the CPI numbers for July.
- Polygon price soared by 125% since July 1; Analysts spotted a rally of 68% catapulting to an 85% boost in terms of profit.
- MATIC price has overlapped targets found in the .25 mark; retracement is still a possibility at .64.
- A break below the .54 mark hints at an invalidation of MATIC’s uptrend movement.
Evidently, the crypto market has been extremely volatile seen early this week. On the other hand, investors are still on pause waiting for the CPI print. Apparently, MATIC has dropped by 0.06% since yesterday.
Polygon Price Jump By 5.04%
According to CoinMarketCap, Polygon trades at .9361 or registering a price jump of 5.04% as of this writing. Early this week, MATIC’s price didn’t make it to again but it still has shown an impressive recovery since it slumped at a low of .31 as seen in June. MATIC price has since then soared by as much as 300%.
In most parts, Polygon was barred somewhat from escalating further by the tremendous volatility experienced by Bitcoin. As of press time, Polygon’s TVL is at .69 billion but it has experienced a gradual decline in terms of TVL seen in the early months of 2022.
In the same way, Ethereum has also shaved off as much as .5 billion in TVL seen in the past seven months which has negatively impacted MATIC price which is currently trading at 69.5% which is way below its ATH.
Polygon Gunning For
According to the MATIC technical analysis, the bulls still have some power left as the coin is still pumping the price up on a constant uptrend.
With that being said, a retest at is a possibility but it will all depend on the result of the July CPI print. So, if the inflation numbers spike, the MATIC price might possibly retest the 200-day EMA right at .81.
On the other hand, if the inflation plummets, then the market could improve rapidly which could improve the prediction for MATIC price peaking at .05.
The recent price pump of Polygon was first spotted on July 27. There is seen to be a mild pullback which gives the bears a green light to close orders and jump in with the bulls.
So, if the technical analysis proves to be accurate, a second breach seen at .61 could potentially punch a bullish movement shooting for . Either way, this would still mean a price rally for MATIC.
MATIC total market cap at .6 billion on the daily chart | Source: TradingView.com
Featured image from The Economic Times, Chart from TradingView.com
NewsBTC
Maker (MKR) Surges 7% as Stability Fees Introduced, DeFi Regains Footing
While decentralized finance (DeFi) has seen a strong surge in 2020, Maker (MKR), a token strongly tied to DeFi, has underperformed. The cryptocurrency, relative to its competitors, is underperforming; where Aave’s LEND and Synthetix’s Synthetix Network Token surged hundreds of percent in this year alone, MKR only saw a 20-30% move higher.
The market may be changing its mind on MKR, though.
The coin is up 7% in the past 24 hours and seems poised to see further growth as the fundamentals of the underlying MakerDAO protocol align in favor of growth.
Related Reading: MicroStrategy’s Stock Continues to Soar After Bitcoin Purchase
Maker Surges 7% Higher Despite Stagnation in Bitcoin & Ethereum Prices
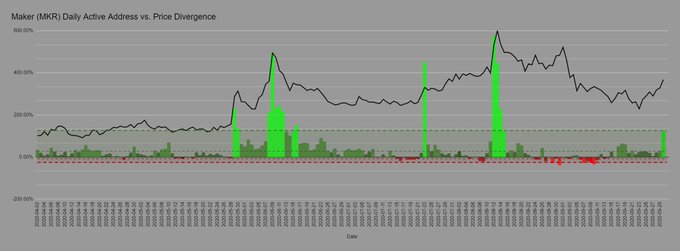
Santiment, a blockchain analytics firm, reports that the cryptocurrency has “the largest bullish divergence between daily active addresses and current price (based on historical means) of any top 100 #blockchain we track.” This suggests that MKR’s increasing user count is not being reflected in price action, but may soon be:
“On top of this, from a pure network activity perspective, $MKR currently has the largest bullish divergence between daily active addresses and current price (based on historical means) of any top 100 #blockchain we track.”
Chris Burniske, partner at Placeholder Capital, has echoed the optimism about Maker. He recently noted that most investors in the crypto space are currently “sleeping on MKR” despite the utility of the protocol “going through the roof” and as more research is done about how the coin captures value.
“People mostly sleeping on $MKR while utility goes through the roof, and conversations abound around its value capture model.”
Related Reading: Critical On-Chain Signal Predicts That Bitcoin’s Next Move Will Be Upward
Adding to this, stability fees were just reimplemented into the MakerDAO protocol after a long period of 0% rates. This means that MKR may begin to accrue value once again as the protocol begins generating fees, resulting in the buying back and burning of MKR tokens.
Corroborating MKR’s bull case, analysts see reasons to be long-term bullish on all of DeFi. With Maker representing a core asset of DeFi, it will benefit if the rest of the DeFi space continues to gain traction.
Commenting on DeFi as a whole, Spencer Noon, head of DTC Capital, recently wrote:
“The strong fundamental backdrop to #crypto — which is unlike any bull market previously — is that there are billions of cryptodollars coming on-chain to use #DeFi. Unless that shows signs of slowing, we are on track for a multi-trillion dollar aggregate marketcap for the space.”
Other analysts agree with his assessment of the space.
Related Reading: Ethereum Transaction Fees Surge to All-Time Highs After Uniswap Launch
Featured Image from Shutterstock
Price tags: mkrusd, mkrbtc, mkreth
Charts from TradingView.com
Maker (MKR) Surges 7% as Stability Fees Introduced, DeFi Regains Footing
Bitcoin Reaches a “Bounce or Die” Level as Bulls Lose Their Footing
After a day-long period of consolidation within the lower-,000 region, bulls have once again lost their footing, with bears catalyzing a break below the support that had been established at ,000.
This has led analysts to note that Bitcoin is fast approaching a “bounce or die” level that buyers must defend, or else the benchmark cryptocurrency could once again find itself caught within a capitulatory downturn that leads it to decline back towards its recently established lows.
This potential selloff comes as Bitcoin’s weekly close fast approaches, and a failure to bounce prior to this close could prove to be dire for the cryptocurrency.
Bitcoin Faces Massive Selloff as Buying Pressure Begins Evaporating
At the time of writing, Bitcoin is trading down over 5% at its current price of ,900, which marks a notable decline from daily highs of ,300 that were set yesterday when bulls attempted to garner some upwards momentum.
The failure for bulls to sustain this momentum led to a rejection at this level, with the subsequent downtrend marking a significant extension of that which was first incurred when the crypto’s strong rally from ,800 stalled at ,900.
In the near-term, it is imperative that buyers defend against a drop below ,900 – as this is where a significant amount of support has been established.
This volatility also comes just a couple of hours before BTC posts its weekly candle close, with a bearish close likely bolstering bears, leading the crypto to decline further in the week ahead.
BTC Reaches “Bounce or Die” Level as Bulls Falter
This plunge has led Bitcoin to what appears to be a “bounce or die” support level.
Teddy – a prominent cryptocurrency analyst on Twitter – mused this possibility in a recent tweet, offering a chart showing that the crypto is currently resting on a key multi-week support level.
Image Courtesy of Teddy
If this level is shattered, the next key level marked on the chart above sits at ,450.
Any potential near-term weakness could also be further perpetuated by the bearish economic backdrop that Bitcoin is currently trading against. If the stock market’s rebound seen throughout this past week shows signs of faltering, its next downturn could drag BTC down with it.
The futures market’s imminent open, coupled with Bitcoin’s upcoming weekly close, should offer investors with significant insights into where the crypto market is heading in the week to come.
Featured image from Shutterstock.
NewsBTC