 Scott Melker, also known as the “Wolf of All Streets,” has revealed his theory on the potential resurgence of mainstream fear of missing out (FOMO) in the crypto market. He asserted that people seem to forget that the mainstream fervor in the last bull market came through dog coins, like dogecoin, and non-fungible tokens (NFTs). […]
Bitcoin News
Bitcoin Sets New All-Time High Above $69,000 As Institutionals Show FOMO
Bitcoin has set a new all-time high (ATH) above the ,000 level as institutional investors have aggressively bought on Coinbase.
Bitcoin Has Set A New ATH Above ,000
The moment that every Bitcoin investor had been looking forward to has finally arrived today. The cryptocurrency just smashed past the record set in November 2021 to create a brand new ATH beyond the ,000 level.
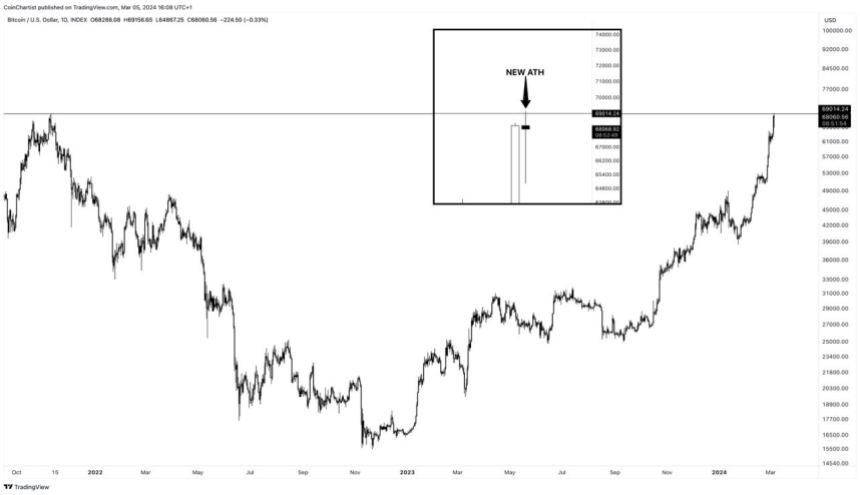
This historical moment has come for the asset as institutional investors have been showing some strong buying pressure recently.
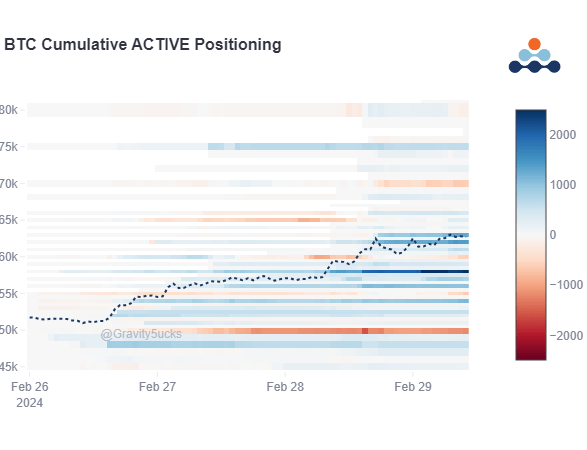
Bitcoin Coinbase Premium Index Spikes To Highest Levels For 2024
As an analyst in a CryptoQuant Quicktake post explained, US institutional investors appear to be scrambling to buy Bitcoin as they are starting to feel FOMO with the sharp bullish momentum the cryptocurrency has enjoyed.
The metric of interest here is the “Coinbase Premium Index,” which keeps track of the percentage difference between the Bitcoin prices listed on cryptocurrency exchanges Coinbase (USD pair) and Binance (USDT pair).
The former exchange is the preferred platform for institutional traders based in the US, while the latter serves more global traffic. As such, the Coinbase Premium Index can provide hints about the differences in the buying and selling behaviors of the two groups.
When the indicator has a positive value, the price listed on Coinbase is higher than on Binance. Such a trend implies that the buying pressure is higher (or selling pressure is lower) from the US-based investors compared to Binance users.
On the other hand, the negative metric suggests that American institutional traders may be applying relatively high selling pressure on the market.
Now, here is a chart that shows the trend in the Bitcoin Coinbase Premium Index over the past few months:

As displayed in the graph, the Bitcoin Coinbase Premium Index has registered a large positive spike recently, implying the difference between the prices on Coinbase and Binance has widened.
The indicator had been floating inside the green territory for a while before this spike, and in this period of high buying pressure on Coinbase, the coin observed a sharp rally.
This recent buying pressure would probably include sources like the spot exchange-traded funds (ETFs) approved this year. From the chart, it’s visible that the buying pressure has been even higher in the last couple of weeks, culminating in the latest spike.
Interest around the asset among these institutional entities had only been growing recently, but the latest spike suggests FOMO has gone up a level for these investors.
Given that institutional buying has been one of the main forces behind the latest rally in the cryptocurrency, it’s no wonder that its price has hit a fresh high off the back of the latest spike.
Sentix Media Insights on Crypto: Wave Goodbye to Hype and FOMO
 News media is one of the three top powerful sources that influence crypto coin prices. Yet, thousands of news sources mean a trader can’t follow all of them to get the point of how the market sees a coin price potential at a certain period. Sentix is an AI-powered assistant that analyzes all types of […]
Bitcoin News
FOMO Fuels Bitcoin’s 35% Jump, Options Flow Hints At Bigger Upswing
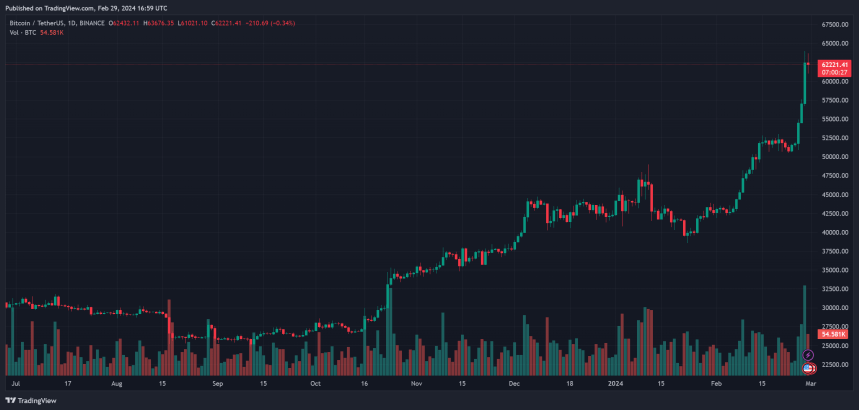
The price of Bitcoin seems on the brink of blasting past its all-time high (ATH) at the high area of its current levels. The cryptocurrency has been on a bull run due to the launch of spot Bitcoin Exchange Traded Funds (ETF), which officially onboarded institutions to the nascent sector.
As of this writing, Bitcoin (BTC) trades at around ,900 with a 3% profit in the last 24 hours. In the previous week, the cryptocurrency recorded a critical 22% profit. It stood as one of the three top gainers in the top 10 by market cap, only surpassed by Solana (25%) and Dogecoin (57%) in the same period.
Bitcoin-Based Derivatives Hint At Further Gains
Data from the derivatives platform Deribit indicates a spike in long positions by Options operators. Since early February, these traders have accumulated important call (buy) contracts with a strike price above ,000.
At first, as the report indicates, the increase in bullish positions was thought to be part of a Bitcoin “Halving” strategy. However, the BTC ETF Flows seem to be the key component behind the rally.
As cryptocurrency entered the ,000 area, several operators rushed to accumulate call contracts, leading to a Fear Of Missing Out (FOMO) rally to its current levels. The chart below shows that the FOMO buying began when BTC breached the ,000 level.
The spike in trading activity during yesterday’s session led to a significant jump in Implied Volatility (IV). Overleveraged positions further propelled the metric, Deribit stated:
The 62k to 64k surge was so quick, and with high leverage across the whole system, that when sales hit the market a cascade sent BTC down to 59k in 15mins, and some Alts (also massively leveraged) dropped 50% on some exchanges before promptly bouncing as BTC jumped to 61.5k.
As the market continues to experience sudden moves due to the high IV, there is little change in the market structure in the derivatives sector. In other words, Deribit still records a lot of bullish positions for the coming months, which suggests optimistic conviction by these players.
BTC Price On The Short Timeframe
Despite the bull run, the Bitcoin price could dip as euphoria takes over the market. According to economist Alex Krüeger, the spike in trading volume across the derivatives sector indicates the formation of a “local top.”
The analyst believes that retail has returned to the market driven by FOMO, which often hints at short-term predicaments for long traders. Krüger predicted further gains into the ,000 area via his official X account and then a drop into the ,000 area.
The analyst stated:
ATH are inches away. That’s price discovery territory. Thus very easy for things to get even crazier. This is just not where one opens new longs. Too easy to get a quick flush out of nowhere. Ideally we see funding cool down and price consolidate below ATH then break out.
Cover image from Dall-E, Chart from Tradingview
Ethereum Breaks Back Above $3,000, Will FOMO Lead To Top Again?
Ethereum has once again broken above the ,000 level after previous attempts ended in failure as FOMO took over the investors.
Ethereum Has Rallied 3% In Past Day To Break Back Above ,000
Earlier, Ethereum had made two attempts at the ,000 level, but both of them had turned out to be brief as the asset quickly retraced back to lower levels. In the past day, ETH has once again made a push towards the mark, as the chart below shows.
In this latest surge, ETH has seen a sharp recovery of more than 3% from around the ,900 mark to the current levels. The coin is now up 8% in the past week, making it the second-best performer among the top 10 cryptocurrencies, just behind BNB’s 10% profits.
From the graph, it’s visible that Ethereum is now within touching distance of setting a new high for the year. But ETH investors would be wondering if this rally would sustain or if it would end up losing steam, just like the previous ones. If data is anything to go by, market sentiment may have been the reason behind the demise of the last surges.
ETH’s Previous Surges Topped Out As FOMO Took Over Traders
According to data from the analytics firm Santiment, the latest top above ,000 occurred as the crowd euphoria spiked. The indicator of interest here is the “Social Volume,” which keeps track of the total amount of discussion that social media users are participating in around a given term or topic.
The metric calculates this value by counting up the number of posts/threads/messages across the major social media platforms that are making at least one mention of the topic.
The below chart shows the data of the Social Volume related to two Ethereum topics:
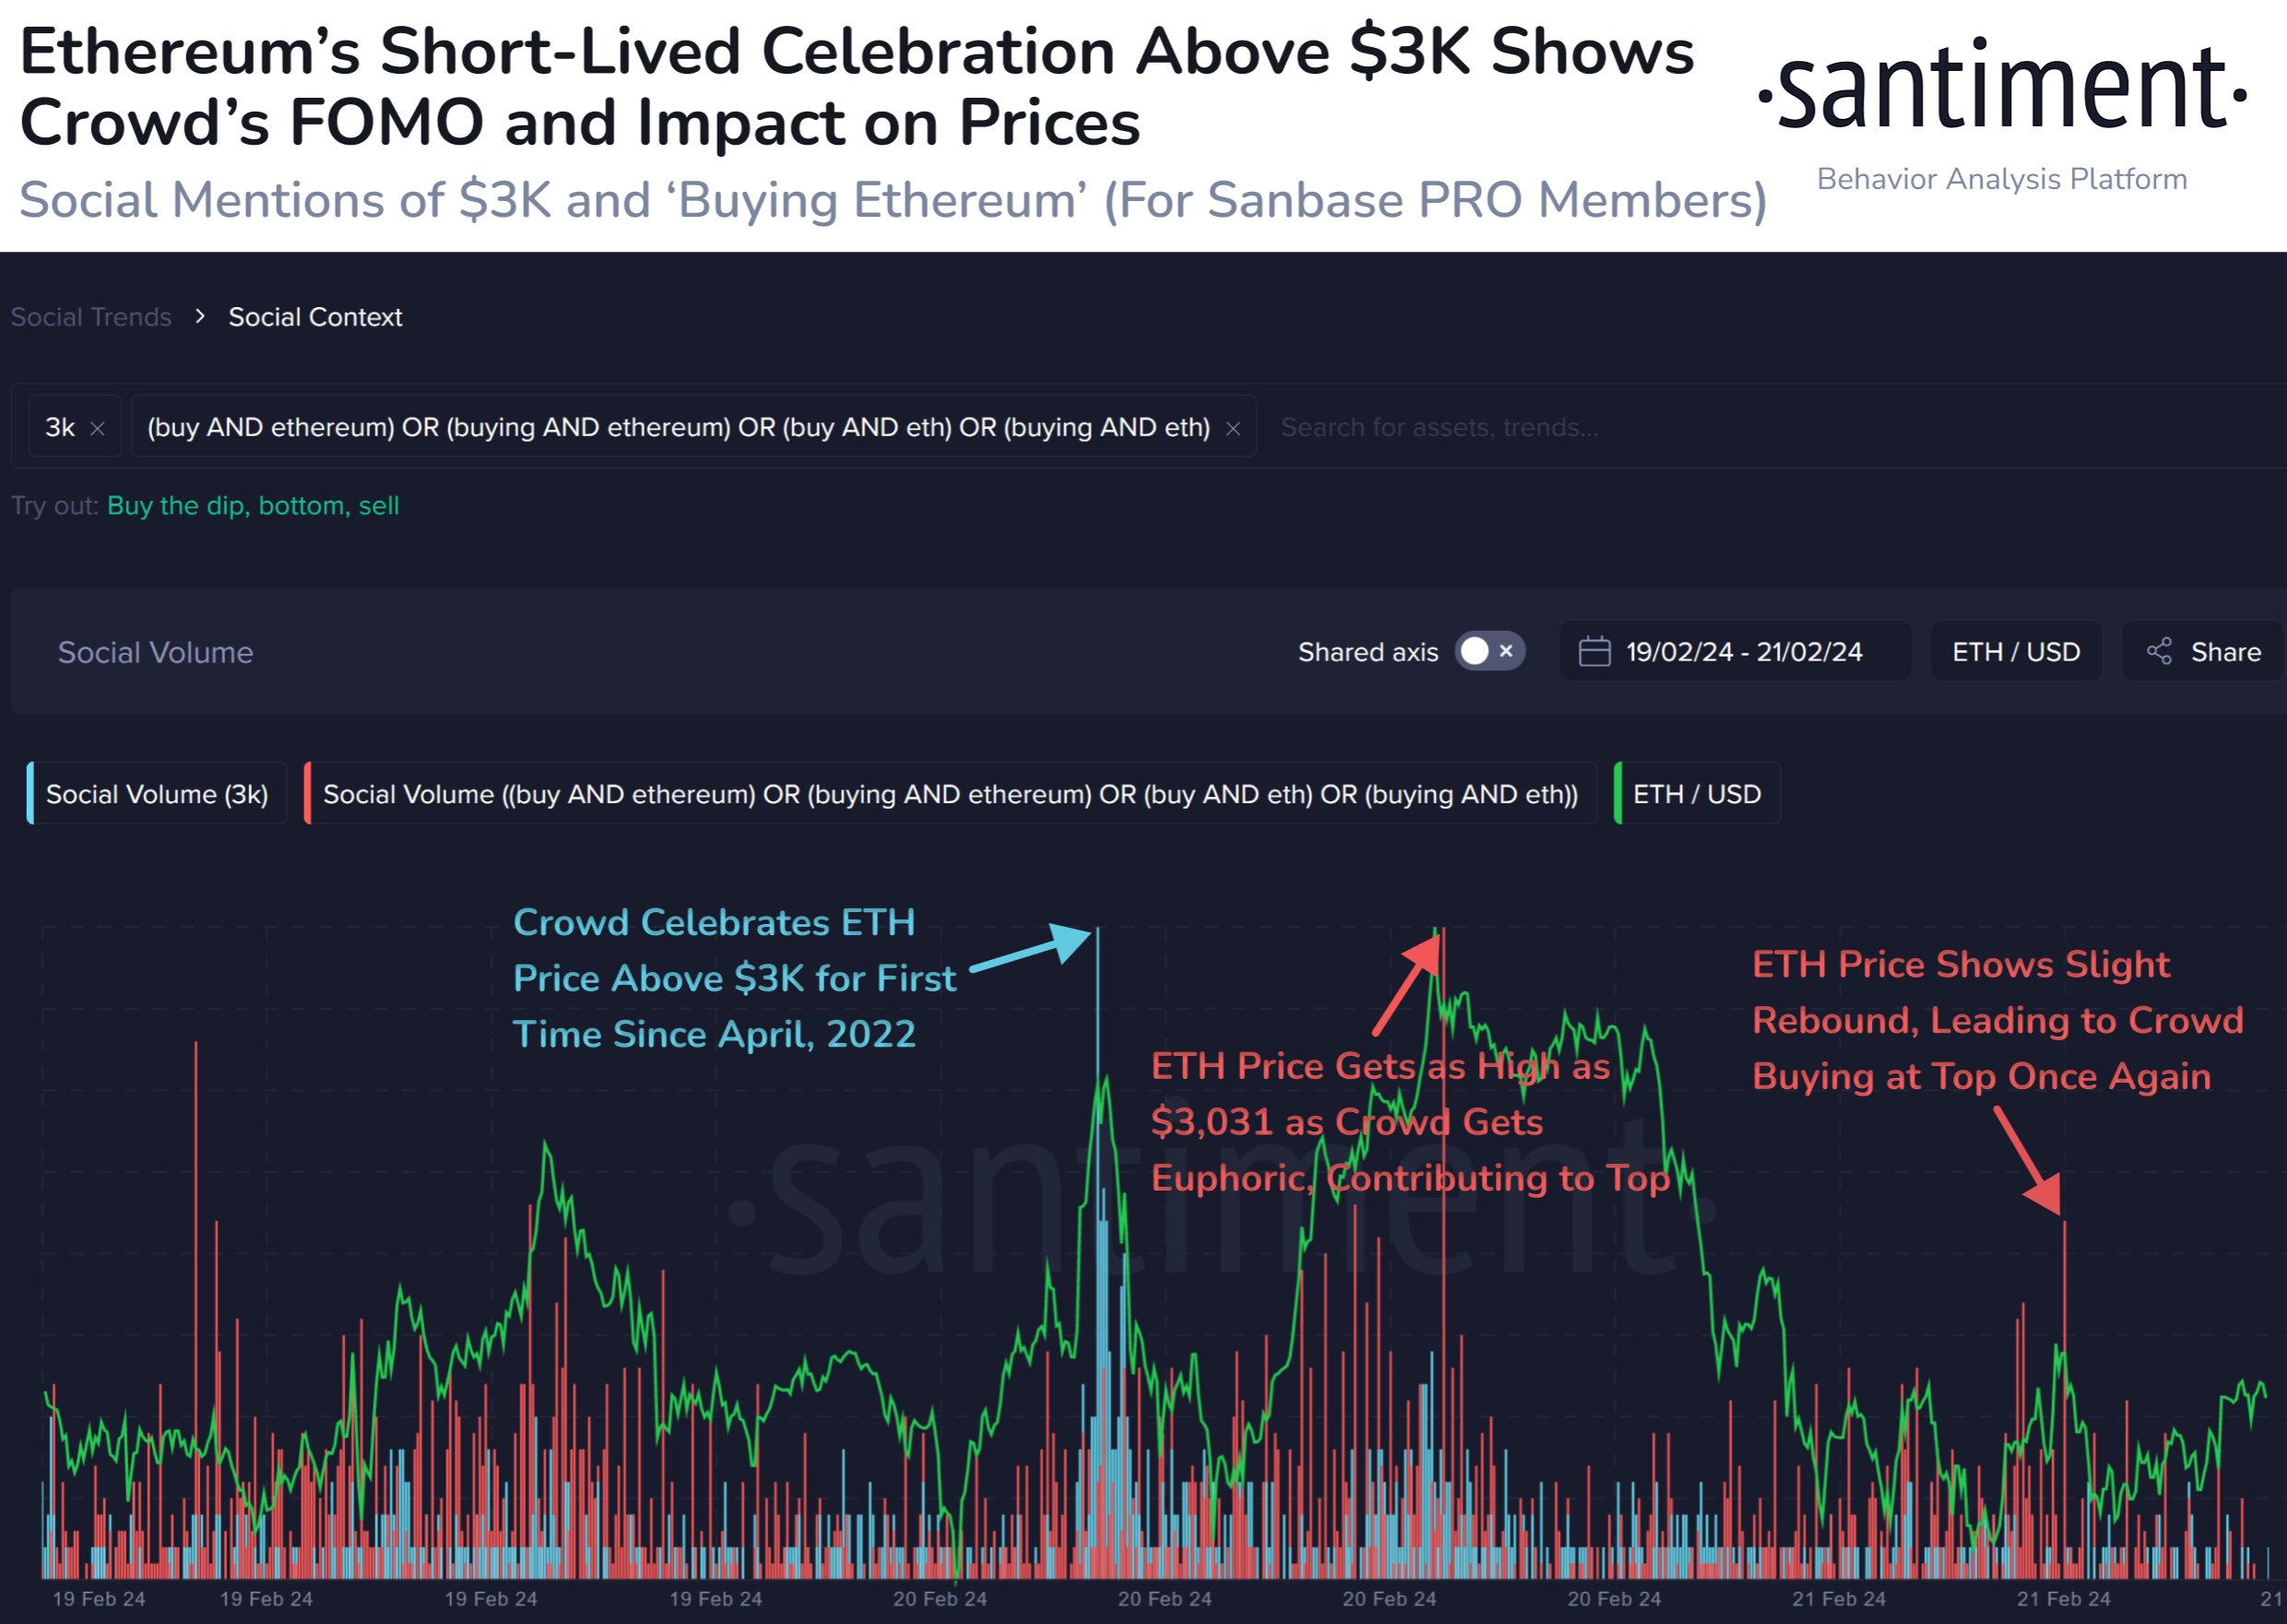
The first Social Volume here has been filtered for ,000. As is visible in the graph, this metric spiked as ETH broke above ,000 for the first time since April 2022 a couple of days back.
This would suggest that discussions around the topic had spiked high as traders had celebrated the break. As it had turned out, though, the surge was pretty short-lived.
In the second attempt, the Social Volume related to terms like “buy Ethereum” had registered a large spike, implying that FOMO had developed among the traders.
Historically, FOMO has been something that has made tops likely, as ETH’s price has tended to go contrary to the expectations of the crowd. This is likely the reason why the top coincided with this spike.
A similar phenomenon occurred with the small recovery surge observed yesterday, as Santiment has highlighted in the chart. It would seem that greed had once again led to the coin topping out.
It now remains to be seen how the market reacts to the latest rally above ,000. If FOMO around Ethereum once again spikes on social media, then it may very well be a sign that this surge, too, may only be temporary.
Bitcoin FOMO Hasn’t Spiked Yet: Green Signal For Rally To Continue?
Data shows social media users aren’t yet showing FOMO around Bitcoin, a sign that the current rally could still have the potential to continue.
Bitcoin Social Volume Hasn’t Been Too High Recently
According to data from the analytics firm Santiment, the crowd FOMO that may be associated with a rally like BTC has seen recently hasn’t yet cropped up on social media.
The indicator of interest here is the “Social Volume,” which keeps track of the total amount of discussion any given topic or term is receiving on the major social media platforms right now.
The metric measures this by counting up the posts/threads/messages that are making at least one mention of the given term. The reason it tracks the number of posts themselves rather than the mentions is so that a few threads with a significant number of mentions can’t skew the indicator by themselves.
When a topic truly receives widespread attention on social media, a large number of posts crop up as users across the platforms participate in talks. Mentions, on the other hand, can sometimes spike just because some niche circles decide to discuss the term.
As such, measuring Social Volume through posts is what provides a better representation of the general trend being followed. Now, here is a chart that shows the trend in the indicator for terms related to Bitcoin and cryptocurrency:

As displayed in the above graph, the Bitcoin Social Volume hasn’t been too out of the ordinary recently, despite the sharp rally that the asset’s price has witnessed.
Generally, the indicator tends to rise as rapid moves in the cryptocurrency take place since users get spurred to talk more about the coin. When discussions rise too high, though, it’s often a sign that FOMO is increasing in the sector.
Historically, Bitcoin has tended to move against the expectations of the majority, so such a rise in FOMO has often resulted in top formations for the asset. When discussions rise alongside a drawdown instead (that is, a signal that FUD is going up), a bottom rather takes place for the coin.
From the chart, it’s visible that last month, the indicator registered a spike around the time of the spot ETF approvals, which coincided with the top, but such FOMO hasn’t reappeared for the coin yet.
“Despite Bitcoin’s +74% price rise in 4 months, the crowd FOMO that would normally be associated with this kind of surge has not been present,” notes the analytics firm.
“There was certainly an interest in BTC in the weeks directly before and after the SEC’s approval of 11 ETF’s, but the lack of new greed in the space can actually be considered a promising sign that this rally can continue,” explains Santiment.
BTC Price
Bitcoin has seen some pullback in the past day as its price has slipped under the ,000 level.
From Highs To Lows: Solana’s Price Journey – Can It Recover From FOMO Fumble?
In a twist of fate, SOL, the native token of Solana, navigates through a period of volatility after a robust bullish run that spanned from September to December 2023. The once-surging token has encountered a steady decline over the past three weeks, leaving investors on the edge.
Solana Meteoric Rise Falters Amid Corrections
Initially hailed for its remarkable performance, SOL skyrocketed by an astonishing 500% since October 2023, with December alone contributing a remarkable 105% gain. The surge was largely attributed to the fear of missing out (FOMO) surrounding Solana’s SPL token airdrops, where tokens such as Jito (JTO), BONK, and Dogwifhat (WIF) played a significant role.
However, the currents have turned since the dawn of the new year. Recent weeks have witnessed a correction in SOL’s value, shaking investor confidence. Excessive optimism regarding airdrop expectations and delayed launches have contributed to this correction, as the boost to decentralized applications (dapps) proved short-lived.
The decline in SOL’s value has been evident, with the coin rarely surpassing the 7 mark in recent times. On January 19th, SOL faced a 9% decline, plunging to a low of . Analysts have observed a consistent rejection from the 0 level, further fueling investor caution.
At the time of writing, SOL was trading at .72, down 2.4% and 6.7%, respectively, in the last 24 hours and seven days, data from Coingecko shows.
SOL Faces Price Dip Amidst Growth
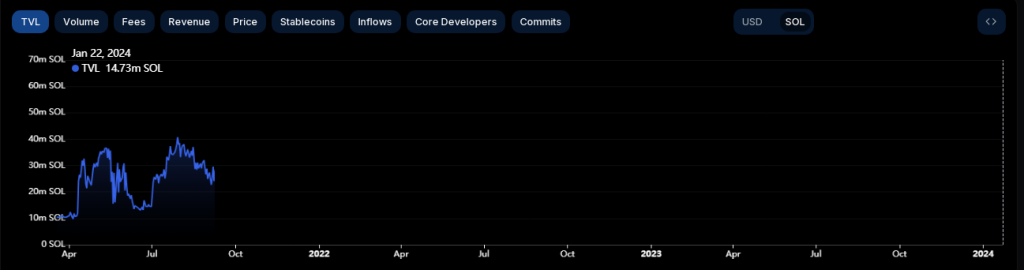
While SOL’s token price experiences a downward trend, there are positive signs of growth in other aspects. Solana’s total value locked (TVL) in SOL tokens reached an all-time high of 15.4 million on December 19th, 2023, indicating a substantial 60% growth compared to the previous month.
Furthermore, Solana has demonstrated an increase in network activity, particularly in transactions and volumes. Despite a slight decline in transactions and active dapp users over the past week, Solana’s dapps volume reached an impressive 4 million, with a staggering 72.3 million transactions.
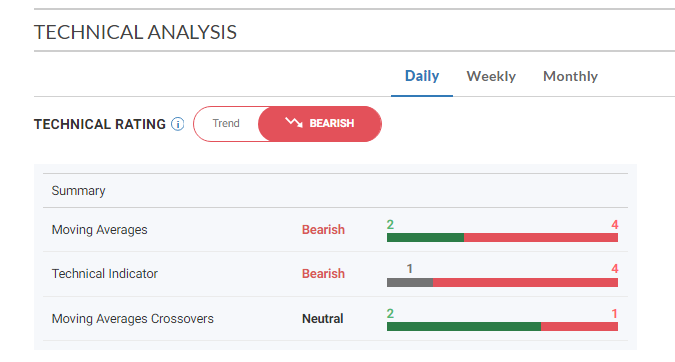
Technical analysis paints a mixed picture for SOL’s future. While the token remains above its 50-day and 200-day exponential moving averages, suggesting a bullish sentiment, recent price action raises concerns of a potential reversal.
SOL’s relative strength index (RSI), on the other hand, sits at 43.70, indicating a bearish market, while the moving average convergence and divergence (MACD) stands at 55.50, pointing towards an upward trend.
Initially, analysts were optimistic, predicting a continued bullish run for SOL in 2024, with price projections ranging from 0 to 0. However, the general price dip observed since the beginning of the year, coupled with increased selling pressure, has shifted control towards the bears.
Top is in.
Will trade under in 2024. pic.twitter.com/AHH7I8KZug
— Toni Ghinea (@ToniGhinea) January 19, 2024
A struggle between bulls and bears has ensnared investors. A lot of people are just going to sit tight and see what happens because of the resistance levels and the cautious market mentality.
It is worth mentioning that expert Toni Ghinea has predicted a possible decline to by the end of 2024, which might intensify the negative sentiment around the SOL market.
Featured image from Shutterstock
XRP, Polygon See Month-High Volumes As Investors Show FOMO
On-chain data shows the trading volumes of XRP and Polygon have hit monthly highs as investors are displaying FOMO towards the assets.
XRP, Polygon See Volume Spike Similar To Bitcoin’s Surge A Few Days Back
According to data from the on-chain analytics firm Santiment, XRP & MATIC have seen high volumes recently. The “trading volume” here refers to the total amount of any cryptocurrency that’s being transacted on the different exchanges in the sector every day.
When the value of this metric is high, it means that the asset in question is being moved around a lot on the exchanges. Such a trend implies that traders are actively participating in the market right now.
On the other hand, low values suggest the interest in the cryptocurrency may be low at the moment as not much trading activity related to it is happening on the platforms.
Now, here is a chart that shows the trend in this indicator for XRP, Polygon, and Bitcoin over the past month or so:
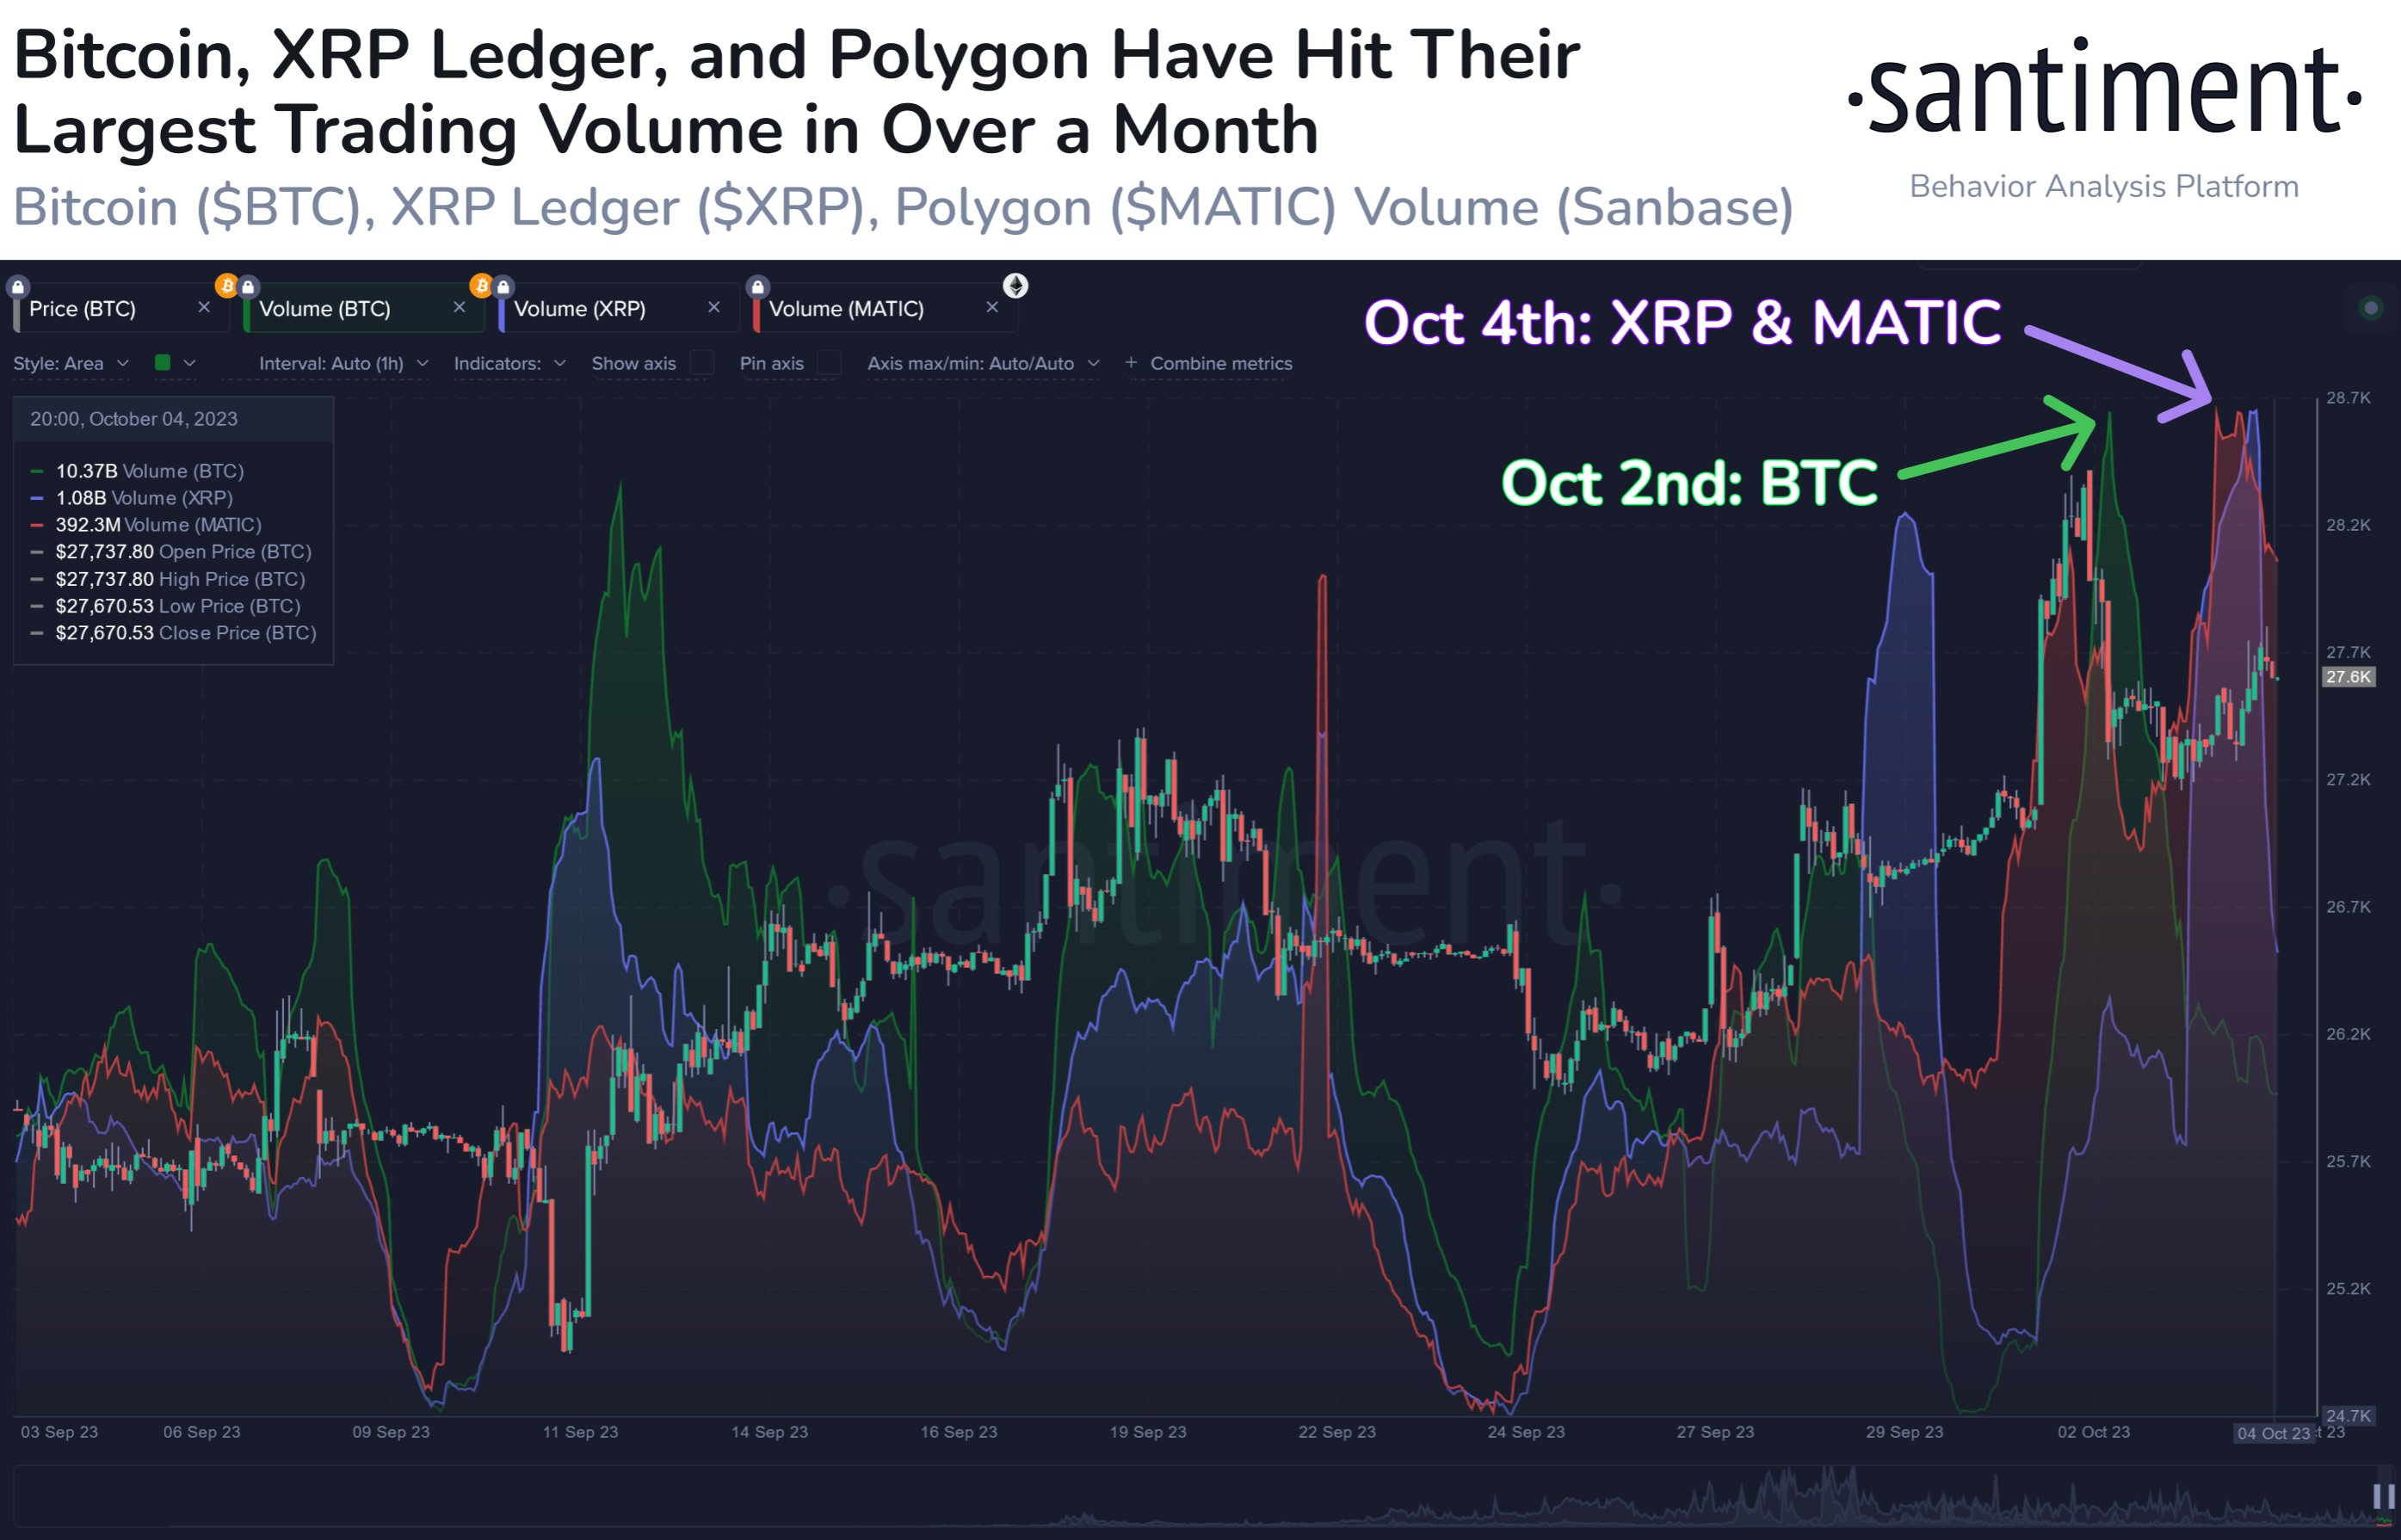
As displayed in the above graph, the Bitcoin trading volume had become pretty high a few days back when the asset’s price had surged toward the ,500 mark.
This spike in the volume had come with a delay, however, as its peak had occurred after the cryptocurrency had already started on its pullback. This could be a sign that once investors saw the rally, they felt like they had to FOMO in, so they quickly made some trades, but many of these investors had arrived late to the scene, hence why the spike had come later.
The volume would have also been fueled by the panic sellers who bought at the top but sold as soon as they saw that the rally was already starting to cool down.
During the past couple of days, XRP and Polygon have also seen some recovery surges (although the rises haven’t been anything too impressive) and the trading volume has also shown similar spikes for these cryptocurrencies as well.
At the peak of this latest surge, the volume of these cryptocurrencies had managed to hit its highest level in about a month. “FOMO is high right now,” notes Santiment.
It would appear that just like with BTC, investors had started jumping on these cryptocurrencies once they saw the rally. Those falling for FOMO, however, would have once again faced disappointment, as both XRP and MATIC have already retraced their latest recovery attempts.
If the trading volume continues to stay high even after the pullback, though, then it would be a positive sign for the prices of these altcoins, as it would mean that there is still significant demand for them at these lower price levels.
XRP Price
In its latest recovery rally, XRP had managed to rise near the .55 mark, but with the pullback since then, the cryptocurrency has dropped toward the .52 level.
BlockFi Co-Founder Sees Huge Growth And FOMO For Crypto In 2022
Co-founder of BlockFi and senior vice president of operations, Flori Marquez, shared the company’s insight on collected customers’ data and shed some light on the crypto industry’s growth as they have seen “huge moves” of Americans interested in it, suggesting a burgeoning adoption.
During an interview with Yahoo Finance, Flori Marquez shared some interesting numbers. In the year over year Bitcoin returned 112%, and compared to gold and S&P respectively, she said, “that’s a negative 4% and 24%.”
So, year over year, it has been volatile in the last 30 days. But it’s still a great investment for people who were participating a year ago.
Marquez claims this year was big for crypto in terms of mainstream consumer demand, which took BlockFi to research amongst customers’ data to try understand their sentiment on Bitcoin at the moment.
we’ve seen that 1 in 10 people plan to gift crypto this year. And also, about 2/3 of Americans prefer to talk about crypto versus if you think about five years ago, only 1% of people had ever traded crypto, and 50% of Americans had never heard of crypto five years ago.
BlockFi has around 75,000 clients using their Visa Signature Credit Card which offers rewards in Bitcoin, “And that’s absolutely huge because most fintech companies look to see about 10,000 credit cards in their first year” Marquez added and further suggested that Americans are highly interested in earning “different types of awards”, but not necessarily looking forward to earn cash back.
BlockFi’s co-founder claims that 2/3 of their clients “actually spend less with cash back” since starting to use their Bitcoin-rewards cards because they are “more into crypto”. Their clients nowadays show a long-term ‘hodlers’ way of thinking, and see BTC as an asset that could generate them an important yearly return that cash cannot offer.
when they receive a Bitcoin reward, they’re not selling that for cash. So the upside isn’t necessarily the 0 that you’re receiving in Bitcoin today. The upside is what could that Bitcoin be worth a year from now.
A Chainalysis research shows that, by October 2021, the goblal crypto adoption had grown over 2300% since Q3 2019 and over 881% in the last year as many countries face devaluations and citizens all over the world want to protect their savings, and there is also a large boost coming from institutional investment. The total market cap of crypto reached trillion in 2021 and is currently at ,2 trillion.
Crypto total market cap at ,2 trillion in the daily chart | Source: TradingView.com
Related Reading | Has The NFT Bubble Popped? Prices Down 65% While Ecologists Sharpen Knives
BlockFi Sees The Growth Of Crypto Driven By FOMO
During 2022, Marquez expects to see more first timers American customers enter the crypto space as she thinks that “a huge driver is going to be FOMO”, meaning that the industry is getting so popular –and cash is looking less useful– that people do not want to miss out on the possible returns.
Reading | FOMO Beware: Spot Bitcoin Buying Volume Remains Low, Despite New ATH
For Marquez, this Holiday season could incentivize the FOMO as many are talking about their 2021 investments and how they worked out. “I do think that crypto has become a bit more digestible for the average consumer than it was five years ago”, she claims.
Furthermore, Marquez thinks that crypto will keep seeing new talent come in, people who have changed paths trying to find a “right fit” for the long-term during the pandemic. She claimed there will be more “shifting from other more traditional industries into crypto and the fintech sector”, and thinks that’s a new opportunity to bring in historically excluded demographics.
As many others do, Marquez hopes to see some regulatory clarity for crypto next year, and commented that “BlockFi is a huge believer in partnership with regulators” to achieve building a bridge that connects traditional finance with crypto. She suggested clarity would boost the mainstream adoption because users will think the space is safer if regulators are in it.
FOMO Beware: Spot Bitcoin Buying Volume Remains Low, Despite New ATH
Bitcoin has maintained high prices well into the first week of November. The month is expected to follow bullish trends that were triggered in the previous month and bitcoin has not been disappointed in this regard. However, some metrics remain low compare to the price of BTC. This could be as a result of investors taking profit in the market but low enough to draw attention to them.
BTC had seen a lot of investment pour into it the week after the first ETFs went live. The record-breaking .4 billion inflow for the week had pushed the price of the digital asset towards a new all-time high. Yet, subsequent weeks have not fared as well in the market. One of the ways this decreased inflow has shone through has been spot trading volumes for the asset.
Related Reading | PayPal Co-Founder Says Bitcoin Price Points To Crisis In The Economy
Bitcoin Spot Trading Low
In comparison to the current price of the digital asset, spot trading volumes are expected to go up in tandem with the price hike. This has not been the case. Spot trading volumes for the week are down compared to the previous week. The 7-day trading average for the digital asset shows a significant downtrend in the same time period. An almost billion decrease saw the 7-day average real trading volume for the asset drop to billion.
BTC spot trading volumes remain low | Source: Arcane Research
The last time BTC was this high, spot trading volumes were significantly higher. The Spring rally saw spot volumes go up along with the price of bitcoin, driving the price higher in that regard. This time, trading volumes have continuously decreased despite the price of the digital asset hitting a new all-time on October 20th.
Spot trading volumes are crucial to the performance of the asset in the market. If the market is to see BTC challenge a new all-time high, it is expected that spot trading volumes would need to go up to accommodate for this increase. Otherwise, momentum in the asset may slow to a crawl, causing the value to stagger downwards in the meantime.
BTC price falls to K | Source: BTCUSD on TradingView.com
BTC Futures Premium Decline
Bitcoin futures premium saw a significant uptick in October with the release of the ETFs that brought strong institutional demand into the market. The momentum was maintained for the better part of a week. However, the market is beginning to see a substantial decline in demand.
Related Reading | Bitcoin ETF Inflows Slow Down As Altcoins Interest Rebound
Futures premiums on CME saw a decline back to early October levels. Increased cash-and-carry activities in the CME Futures are speculated to be the main driver behind this decline. Still, it is a clear indication that institutional interest took a sharp downturn after the ETFs record opening in October.
Interest in BTC Futures decline after launch week | Source: Arcane Research
Open interest on CME has also recorded a decline. But this has not been the case across all open interest platforms. Open interest on top cryptocurrency exchange Binance has seen growing interest. Cash-and-carry activities indicate traders are increasing their exposure. Although some traders who had long exposure on CME had seen gains by the close of last month.
Featured image from CNBC, chart from TradingView.com
NewsBTC