 In 2020 and early 2021, the stock-to-flow (S2F) bitcoin price model captured widespread attention. Although bitcoin currently stands over 13% below its peak value reached in March, the Power Law Corridor model has become increasingly influential. Many hold the view that the Power Law model’s support line has remained steadfast for over ten years and […]
Bitcoin News
Rapid Fluctuations in Bitcoin Fees Cause Brief Spike in Hashprice
 Bitcoin’s hashprice, representing the anticipated value of one petahash per second (PH/s) per day of hashing power, climbed to per petahash on June 8, marking the highest level since the halving. The increase derived from a rise in onchain fees. However, by the following day, bitcoin fees had substantially decreased, causing the hashprice to […]
Bitcoin News
Bitcoin Hedge Fund Shorts Reach New High Amid Price Fluctuations
 Amid Friday’s downturn, following bitcoin’s decline to ,450, the latest Commitments of Traders (COT) report from the Commodity Futures Trading Commission (CFTC) indicates that hedge funds are placing substantial bets against bitcoin. Bitcoin Faces Bearish Sentiment From Hedge Funds While crypto enthusiasts and analysts have been optimistic about bitcoin (BTC) for quite some time, particularly […]
Bitcoin News
BTC’s ‘Strange’ Session: Economic Data, Roaring Kitty Livestream Drive Market Fluctuations, Says QCP Capital
 Following bitcoin’s dip in price, QCP Capital highlighted a “doubly strange session” overnight, driven by unexpected economic data and a widely viewed Roaring Kitty livestream. Analysts Highlight Market Chaos Following Bitcoin Dip and Gamestop Decline Three days ago, Singapore-based QCP Capital envisioned a new bitcoin (BTC) all-time high in June. At the time, the firm’s […]
Bitcoin News
Bitcoin Technical Analysis: BTC Faces Growing Uncertainty Amidst Market Fluctuations
 As of May 8, 2024, bitcoin’s price is coasting along at ,378, experiencing a 24-hour intraday range from ,096 to ,413, with a trading volume of .91 billion and a market capitalization of .22 trillion. Despite a decline of 2.1% over the past 24 hours, bitcoin has gained 9.3% over the last seven days. Bitcoin […]
Bitcoin News
Ethereum’s Wild Fluctuations: Here’s What ETH Implied Volatility Tells Us
The cryptocurrency market has recently exhibited distinct divergences in the behavior of its two leading assets, Bitcoin and Ethereum. While Bitcoin appears to be stepping into a phase of relative stability, Ethereum’s journey paints a contrasting picture of sustained uncertainty, particularly in its options market.
This divergence is highlighted by the sustained high levels of implied volatility associated with Ethereum options, signaling a cautious outlook among investors regarding its future price movements.
Ethereum Persisting Volatility: A Comparative Analysis
Implied volatility (IV) serves as a crucial indicator in the options market, providing insights into the expected price fluctuations of an asset over a specific period. It reflects the market’s temperature, gauging the intensity of potential price movements traders anticipate.
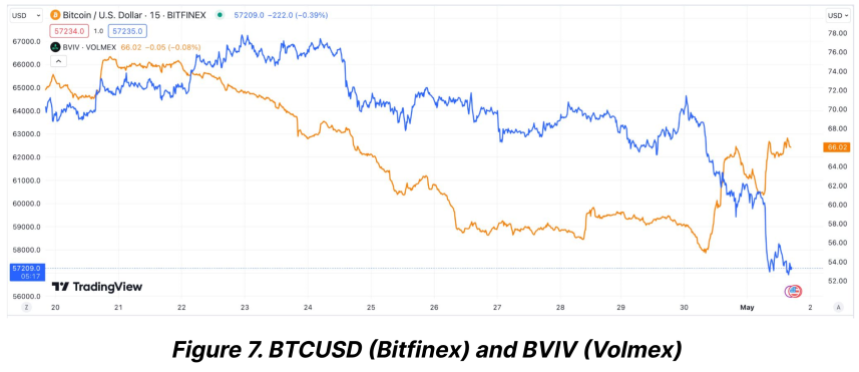
Recent analyses suggest that while Bitcoin’s implied volatility has settled down significantly post-halving, Ethereum’s has not followed suit. As Bitcoin’s IV dipped to a multi-month low, indicating a calming market, Ethereum’s IV remains stubbornly high.
Contrary to the calming waves in the Bitcoin market, Ethereum wrestles with heightened volatility. According to data from Bitfinex Alpha Report, Bitcoin’s volatility index sharply declined from 72% at the time of its latest halving event to about 55%.
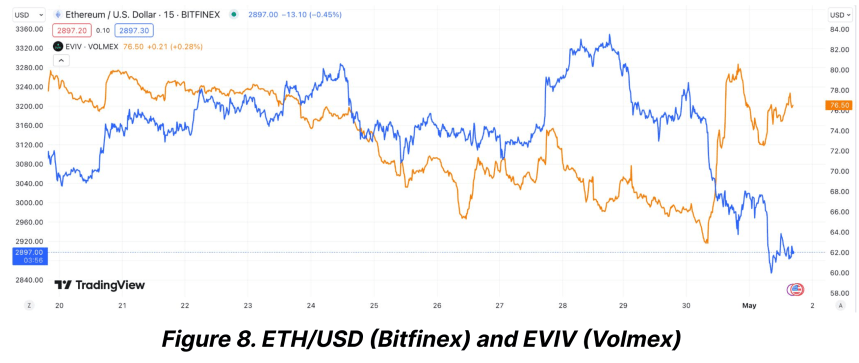
On the other hand, Ethereum saw a more modest reduction in its volatility index, dropping from 76% to 65% in the same period. This persistent volatility in Ethereum’s market is primarily fueled by uncertainties surrounding significant upcoming regulatory decisions and broader market implications.
The Ethereum market is particularly jittery in anticipation of the US Securities and Exchange Commission’s (SEC) impending decision on two spot Ethereum ETFs, slated for late May 2024.
This upcoming regulatory milestone is considered a critical event that could either catalyze a major market move or exacerbate the current volatility.
The Bitfinex Alpha report underscores that regulatory uncertainty is a primary driver behind Ethereum’s less significant drop in its Volatility Risk Premium (VRP) compared to Bitcoin’s.
ETH And BTC Show Signs of Recovery Amid Volatility
Ethereum and Bitcoin have shown signs of recovery over the past week in terms of trading performance. Bitcoin has seen a 4.1% increase, while Ethereum reported a more modest gain of 2.4%.
However, the last 24 hours have been less favorable for Ethereum, with a slight dip of 0.7%, underscoring the ongoing volatility and investor caution.
Moreover, Ethereum’s network dynamics also reflect a subdued activity with a marked decrease in ETH burn rate attributed to reduced transaction fees.
This technical aspect further complements a cautious Ethereum market narrative, poised on the brink of potentially significant shifts depending on external regulatory actions.
Despite all these, analysts like Ashcrypto suggest that the current volatility could set the stage for a strong rebound in the year’s third quarter. Drawing on historical patterns, Ethereum’s speculative forecast is potentially reaching the ,000 mark, provided market conditions align favorably.
Featured image from Unsplash, Chart from TradingView
Ethereum Technical Analysis: ETH Bulls Maintain Drive Amid Fluctuations and Uncertainty
 As ethereum trades at ,135, technical indicators present a nuanced picture for traders. Oscillators largely suggest neutrality with a mix of bullish signals, while moving averages indicate a balance of both positive and negative signals across different time frames. Ethereum Ethereum’s current price is around ,135 per unit, with an intraday range between ,116 and […]
Bitcoin News
Bitcoin Brushes $73,794 Peak Before Midday Price Fluctuations
 The price of bitcoin had a tumultuous day on Thursday dropping below the ,000 threshold at 12:30 p.m. Eastern Time only to return back above the ,000 range shortly after. Bitcoin had tapped an all-time price high during the early morning trading sessions on Thursday by briefly tapping ,794. Bitcoin’s Rollercoaster Day Sees Dip Below […]
Bitcoin News
Bitcoin Technical Analysis: BTC’s Price Resilience Holds Steady Amidst Market Fluctuations

On Friday, the price of bitcoin fluctuated within a daily span from ,937 to ,347, with its market value reaching 6 billion. The trading activity for the day tallied up to .35 billion, showcasing a spike in investor involvement and market liquidity, which tends to diminish as the weekend approaches.
Bitcoin
The current sentiment towards bitcoin (BTC) is remarkably balanced, with a sentiment score of 54. This equilibrium reflects a cautious optimism among investors, straddling the line between bullish and bearish expectations according to technical analysis. This mood is underscored by recent variations in the Crypto Fear and Greed Index (CFGI), which has oscillated sharply, lately hitting levels that signify “greed” and then back to “neutral.”

The relative strength index (RSI) holds at a neutral point of 54, mirroring the sentiment portrayed by other market oscillators like the Stochastic and commodity channel index (CCI), which signal mixed feelings among market participants. Interestingly, the awesome oscillator hints at a bullish outlook, whereas the momentum Indicator suggests bearish tendencies, highlighting the market’s polarized sentiment.
Moving averages (MAs) across different time frames consistently suggest bullish prospects, with both simple and exponential moving averages (SMA and EMA) ascending from the 10-day through to the 200-day marker. This pattern indicates solid support for bitcoin’s current valuation, despite the day’s price swings. The daily chart accentuates a notable price dip following the approval of spot bitcoin exchange-traded funds (ETFs), succeeded by a large downturn and a subsequent effort to rebound.
Heavy resistance has been identified near ,000, with prices currently fluctuating between ,000 and ,800, signaling a tentative recovery phase absent of definitive signs of a trend reversal. The hourly chart shows reduced volatility with a slight upward trajectory, whereas the 4-hour chart offers a more consolidated perspective, displaying a mild upward trend. These resistance levels present potential short-term trading strategies hinging on breakout or reversal patterns.
Bull Verdict:
The analysis of bitcoin’s performance on Feb. 2, 2024, underlines resilience amidst market volatility. The observed price recovery, coupled with decent trading volume, highlights investor confidence and continued liquidity in the market. With MAs across all periods signaling a bullish trend and the awesome oscillator pointing towards a bull signal, BTC demonstrates a solid foundation for price growth. The neutral stance from the RSI, tempered by positive momentum in the hourly and 4-hour charts, suggests an underlying strength in bitcoin’s market position.
Bear Verdict:
Despite bitcoin’s show of resilience on Feb. 2, 2024, several indicators hint at an underlying market caution. The significant price drop highlighted in the daily chart, followed by a hesitant recovery, suggests vulnerability to more sell-offs and the absence of a definitive bullish reversal. Mixed signals from oscillators, particularly the contrasting sell signal from the momentum indicator, reflect investor uncertainty and a divided market sentiment. The neutral RSI, coupled with resistance levels that capped the day’s gains, underscores the challenges ahead for BTC.
Register your email here to get weekly price analysis updates sent to your inbox:
What do you think about bitcoin’s market action on Friday? Share your thoughts and opinions about this subject in the comments section below.
Stablecoin Market Sees Fluctuations With Some Coins Gaining and Others Reducing Supply

According to statistics, on March 26, the stablecoin economy was valued at 5 billion, with the top stablecoins representing .8 billion or 75% of the .17 billion in 24-hour global trade volume across the entire crypto market. In the last two weeks since March 11, 7.06 billion USDC and 351.57 million BUSD have been redeemed. Meanwhile, from March 14 to March 26, the number of tether stablecoins in circulation increased by 6.12 billion.
Stablecoin Circulation Changes
In recent weeks, the supplies of some stablecoins have decreased while others have increased. Today’s top ten stablecoins include USDT, USDC, BUSD, DAI, TUSD, FRAX, USDP, USDD, GUSD, and LUSD. According to statistics for the last month, USDC, BUSD, and GUSD experienced double-digit reductions in supply. The other top ten stablecoin assets recorded supply increases, with TUSD’s supply doubling or rising 112.3% higher than it was 30 days ago.
Among other stablecoin assets, liquity usd (LUSD) rose 16.2% and tether (USDT) increased by 12.7% over the last month. LUSD now has a market valuation of around 7.70 million, USDT’s market capitalization has risen to .70 billion, and TUSD’s market valuation has grown to .05 billion. On the other hand, USDC’s number of coins in circulation has dropped by 6.12 billion since March 11. Statistics for the last 30 days indicate that USDC lost 19.5% of its supply compared to last month.
BUSD and GUSD experienced the largest reductions, with GUSD losing 31.6% of its supply over the last 30 days. BUSD has reduced its supply by 30.6% since last month, and its market valuation is just above billion. According to Nansen’s proof-of-reserves tool, .3 billion BUSD is held by Binance. The stablecoin DAI issued by Makerdao has seen a 4.7% increase in circulation. Over the last month, FRAX recorded a 1.9% increase, and USDP has risen 8.5%.
What do you think the future holds for stablecoins and their role in the crypto market? Will we see continued growth and adoption or will they face new challenges and obstacles? Share your thoughts in the comments section below.