 Galaxy Digital CEO Michael Novogratz says he doesn’t believe the price of bitcoin will fall back down to the K-K level. “I think that’s the new floor unless something dramatic happens,” he described. “This has been a wild ride of an asset,” he added, noting that we’re in price discovery mode and if you look […]
Bitcoin News
Bitcoin NFTs Skyrocket With $425M in Sales This Week; Key Collections Cement Strong Floor Values

In the last week, markets for non-fungible tokens (NFTs) minted on top of Bitcoin have generated approximately 5.63 million in sales. The leading ten NFT collections over the seven-day period all originate from the Bitcoin blockchain. Several collections of Ordinal inscriptions based on Bitcoin are witnessing substantial trading volumes, establishing strong baseline values for these digital collectibles.
Bitcoin NFT Market Continues to Evolve
In the past six weeks, Bitcoin-based NFTs, also known as Ordinal inscriptions, have been selling at an impressive rate. In November, NFT sales from Bitcoin exceeded those from Ethereum, and this trend has persisted into December.
Data from cryptoslam.io this week reveals that Bitcoin achieved 5.63 million in NFT sales, surpassing the runner-up Solana, which recorded 4 million in seven days. Ethereum, previously the frontrunner in NFT sales, now ranks third with approximately .98 million in sales over the seven-day period.
Currently, the leading trio of marketplaces in the realm of Bitcoin-based NFT sales comprises Okx, Unisat, and Magic Eden. As of Dec. 20, 2023, Okx has a commanding lead, holding over 85% of the market share in this niche.
Unisat follows with an 8.3% share, while Magic Eden captures about 4.3%, according to data from Dune Analytics. In the past week, Magic Eden’s seven-day market data reports that Bitcoin Frogs has been the most traded collection in the BTC-based NFT space.
As for the market value, a Bitcoin Frog NFT had a floor price of 0.395 BTC, equivalent to ,241, based on the current BTC exchange rates. Magic Eden saw Bitcoin Frogs reach 193.26 BTC in sales volume, amounting to .43 million, within a week.
Across various platforms listing Bitcoin Frogs, the collection amassed a total of 328.95 BTC, or .35 million in sales. This week’s other notable collections include bitmap, early sub-100K Ordinals indicating they were minted before the 100,000th mark, MNCHRMS, Bitcoin Punks, Ordinal Maxi, Fuzzy Fox, and early sub-10K Ordinals.
Bitcoin Ordinal inscription collections, although not quite matching the value of leading Ethereum NFT collections such as Cryptopunks, Bored Ape Yacht Club (BAYC), and Mutant Ape Yacht Club (MAYC), are rapidly approaching their stature.
The market valuation of Cryptopunks stands at .14 billion, significantly overshadowing the 2 million market cap of Bitcoin Frogs. Yet, the market cap of Bitcoin Frogs is more comparable to that of BAYC, valued at 2 million, and MAYC, with a market cap of 4 million.
What do you think about Bitcoin-based NFT sales leading the ranks? Share your thoughts and opinions about this subject in the comments section below.
Bitcoin’s Unbreakable Floor? Analyst Predicts BTC Won’t Fall Below $35,000 Ever Again
Controversial Stock-to-Flow (S2F) model creator PlanB has recently made a bold prediction about Bitcoin (BTC) that’s captured the crypto community’s attention.
Via his social media handle X, PlanB stated that Bitcoin’s price would never plummet below the ,000 threshold again. PlanB supported his claim with a chart illustrating Bitcoin’s valuation trend about its intrinsic hash rate. According to PlanB, this relationship is a critical indicator of the digital currency’s enduring value.
Despite acknowledging potential black swan events or short-term market volatility, PlanB insists that based on the current fundamentals, particularly the cost of electricity ($/kWh) used in mining Bitcoin, the asset’s market value is “unlikely” to retract below the mentioned support level – ,000.
Mining And Market Arbitrage: A Key Factor
The crux of PlanB’s argument lies in the unique arbitrage opportunity that exists between Bitcoin miners and everyday users. Miners, who invest heavily in electricity to mine the digital asset, and users, who typically purchase Bitcoin with fiat currency on exchanges, create a dynamic market environment.
According to PlanB, this arbitrage might become even more pronounced with the advent of a potential launch of a spot Bitcoin Exchange-Traded Fund (ETF) in the US.
BREAKING: Bitcoin valuation based on difficulty (hashrate) increased to k yesterday. IMO this could mean that, apart from possible black swans or short term volatility, based on $/kWh-arbitrage fundamentals … BTC will never go below k ever again. pic.twitter.com/JPLkXieQAP
— PlanB (@100trillionUSD) November 27, 2023
PlanB suggests that miners, equipped with specialized knowledge about the market and the actual cost of producing Bitcoin, might begin to demand a premium when selling the cryptocurrency. This shift could fundamentally alter the way Bitcoin is traded and its perceived value.
The introduction of BTC spot ETFs, in particular, is expected to bring a new level of mainstream acceptance and investment into Bitcoin, potentially solidifying its price floor as predicted by PlanB.
Bitcoin Hash Rate And Market Dynamics
Delving deeper into the concept of Bitcoin’s hash rate, it’s essential to understand its role in securing the network and validating transactions. The hash rate basically measures the computational power being used to mine and process transactions on the blockchain.
A higher hash rate indicates more robust security and efficiency in the network, often correlating with increased investor confidence and, consequently, a higher asset valuation.
PlanB’s analysis posits that Bitcoin’s valuation will follow suit as the hash rate continues to rise, driven by technological advancements and increased mining activities. This relationship forms the basis of his prediction that Bitcoin will maintain a strong market position, unlikely to fall below the ,000 mark.
Currently, BTC is trading above ,000, marking an increase of over ,000 from the support level PlanB mentioned. Specifically, at the time of writing, Bitcoin’s price stands at ,605, reflecting a 2% rise in the last 24 hours.
Featured image from Unsplash, Chart from TradingView
Bitcoin’s $30K Floor — Willy Woo’s Onchain Analysis Predicts Enduring Stability Above Threshold

On November 21, 2023, the popular onchain analyst Willy Woo presented a detailed chart showcasing the cost basis density map of bitcoin. This analysis delves into BTC’s pricing history and transactional data, pinpointing critical areas of price stabilization and potential zones of support. In discussing the chart, Woo remarked that if the current pattern continues as it has, “we’ll probably never see BTC going below k again.”
Willy Woo Examines Bitcoin’s Price and Onchain Data for Key Consolidation and Support Zones
On Tuesday, November 21, marking a full month since October 22, bitcoin (BTC) has consistently stayed above the K threshold. Concurrently, onchain analyst Willy Woo informed his 1 million followers on social media platform X that if historical trends persist, BTC stands a solid chance of maintaining its position above the K mark without dipping below. While sharing a cost basis density map of bitcoin, Woo said:
We’ll probably never see [bitcoin] going below k again if this onchain pattern holds true… (8 for 8 so far). What you see here is bitcoin’s price discovery across 13 [years]. It’s a contour map [of] the [bitcoin] supply according to the price HODLers paid for their coins, and how it changed over time.
Woo details that the horizontal bands represent prices where many bitcoin holders paid similar amounts for their coins. This data shows a strong agreement on bitcoin’s value at those price levels. Woo’s chart shows that after a bear market if BTC reaches one of these strong horizontal price agreement bands leading into a halving event (when mining rewards are cut in half), the price typically never falls back down to test that support level again.
The analyst argues this “up only” pattern is because bitcoin adoption is still increasing rapidly. Whereas commodity markets see declining prices when saturation hits, bitcoin has grown from 10,000 users in 2010 to over 300 million today and is likely to keep expanding as more institutional investors get involved. Woo concluded that “this is only going to climb with a spot ETF.” Following Woo’s X post, a number of individuals responded to his claims. “I remember when you wrote the same thing in 2021,” a person remarked to the analyst.
“You’re wrong a lot, so now there’s a possibility of sub K,” another person added.
It’s important to note that while historical data can provide insights, they do not guarantee future price movements. Market conditions can and do change on a dime, and unforeseen events can lead to price fluctuations that defy historical patterns. External factors such as regulatory changes, macroeconomic trends, and technological advancements can significantly impact bitcoin prices. Take for instance the March 11, 2020 ‘Black Swan’ event which brought BTC prices below the K range.
On the other hand, if current trends remain consistent, Woo’s analysis over the past 13 years reveals robust zones of price discovery, periods of pre-halving reaccumulation, and instances where bitcoin’s value has traditionally consolidated prior to embarking on a new upward trajectory.
Yet, this isn’t the first instance where BTC advocates have asserted that its price will never fall below a certain range, employing advanced charting tools such as logarithmic growth bands and stock-to-flow (S2F) models. History has shown that these predictions are not foolproof, with some of bitcoin’s fluctuations entirely upending these models.
What do you think about Willy Woo’s assessment on Tuesday? Share your thoughts and opinions about this subject in the comments section below.
Analyst Sets $30,000 Floor For Bitcoin, But Can We Forget 2021’s Misfire?
The price of Bitcoin presses on towards the upside and, once again, touched a critical resistance close to ,000. The cryptocurrency could trend sideways at its current levels in the short term, leading analysts to find the support level that could withstand a spike in selling pressure.
As of this writing, Bitcoin trades at ,160 with sideways movement in the last 24 hours. BTC held a 2% profit the previous week, while Cardano (ADA) and Solana (SOL) took the lead in the current price action.
The History Of Bitcoin Reveals Mega Bottom For The Current Cycle?
On-chain analyst Willy Woo shared a prediction on his social media channels based on the Bitcoin Cost Basis Density. The analyst investigated the BTC supply dynamics to find where the cryptocurrency could hold off the bears.
Based on his findings, the analyst stated that Bitcoin is unlikely to revisit the ,000. As seen in the chart below, each time in BTC’s history that the supply moved to long-term investors, the cryptocurrency trends to the upside without returning to this price point: ,000 for the current cycle.
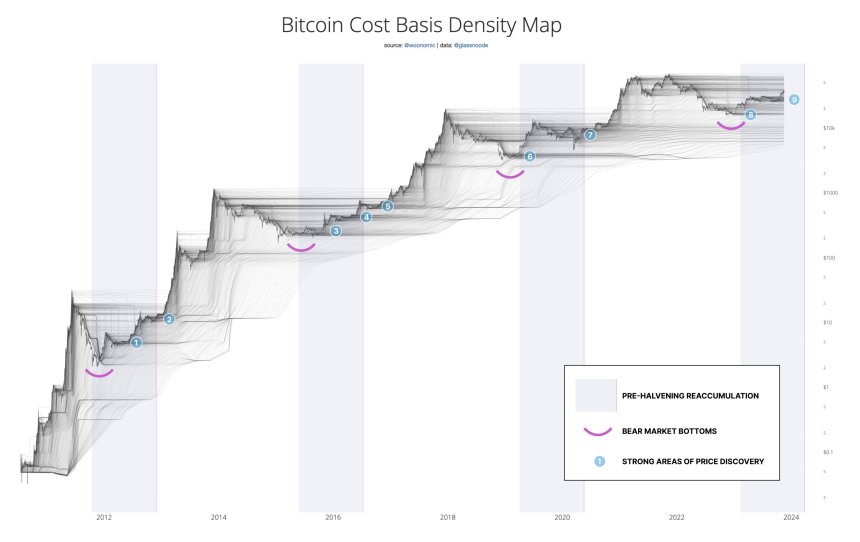
The analyst set 3 conditions to confirm this pattern: first, Bitcoin must be exiting a bear market; second, there must be signs of a “high agreed price;” finally, the cryptocurrency must be about to go through a “Halving Event.”
During the latter, the supply rewards for mining BTC are cut in half along with its production, which often leads to “supply shocks,” according to some analysts. Halving events coincide with the BTC bull run, but other analysts warned against corresponding Bitcoin bull runs with the reduction in its supply.
The Biggest Narrative Driving The Bull Run
However, Woo claims that the potential approval of a Bitcoin Exchange Traded Fund (ETF) might be the more significant catalyst for the cryptocurrency. If the US Securities and Exchange Commission (SEC) approves the product, billions of dollars flow into the cryptocurrency.
The analyst added:
Bitcoin is far from a commodity market at saturation. What we’re seeing across the 13 yrs of this chart is BTC’s widespread adoption. The network had 10,000 users in 2010, today there’s well over 300m people using it as a store of value technology. This is only going to climb with a spot ETF.
The majority of users replying to Woo’s forecast highlighted his 2021 prediction. At that time, the analyst also set some levels that were supposed to hold against a selloff but quickly folded against unprecedented selling pressure.
It remains to be seen if this prediction will suffer the same fate or if the Bitcoin price can hold above ,000 for the next bull cycle.
Cover image from Unsplash, chart from Tradingview
Bitcoin, Ethereum Technical Analysis: BTC Rebounds From Key Price Floor on Wednesday

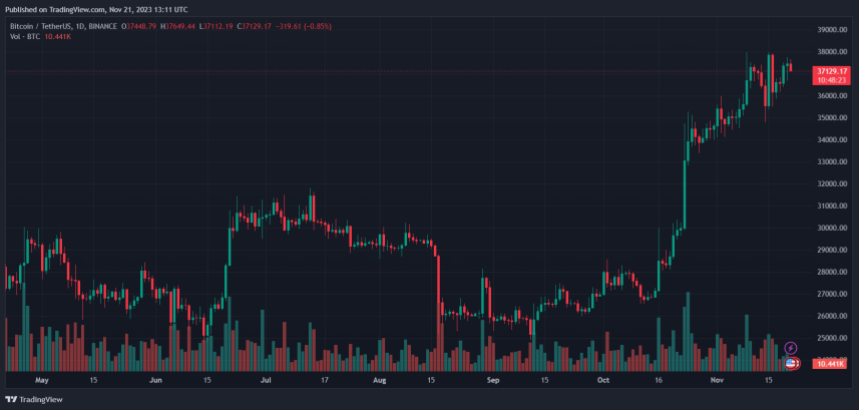
Bitcoin marginally rebounded on Wednesday, after the cryptocurrency collided with a key support point in yesterday’s session. Markets have consolidated Tuesday’s losses, with the global crypto market cap up 0.7% as of writing this. Ethereum remained under the ,700 level.
Bitcoin
Bitcoin (BTC) climbed marginally higher on Wednesday after the price bounced off a recent support point.
Following a low of ,216.00 on Tuesday, BTC/USD surged to a peak of ,632.90 earlier in the day.
The move pushed bitcoin further away from a recent floor of ,200, and closer to a ceiling at ,800.
From the chart, it appears that the rebound comes as the 14-day relative strength index (RSI), bounced from a support level of its own at 58.00.
At the time of writing this, price strength is now tracking at 60.52, with the next visible point of resistance at 67.00.
Should this upcoming ceiling be broken, then there is a good chance that BTC will re-enter the ,000 zone.
Ethereum
Ethereum (ETH) was largely lower in today’s session, despite moving away from a price floor of its own.
ETH/USD has fallen from an earlier peak of ,662.45, and as of writing this is now trading at ,648.07.
Although the cryptocurrency has moved away from its earlier peak, the price is trading above a floor of ,620.
This comes as bulls rejected a breakout of the 50.00 level on the RSI indicator, with the index now tracking at 50.63.
In the event that momentum begins to pick up in the upcoming days, ethereum could be soon back over ,700.
Register your email here to get weekly price analysis updates sent to your inbox:
Are markets consolidating ahead of the weekend? Leave your thoughts in the comments below.
Bitcoin, Ethereum Technical Analysis: ETH Stalls Around Key Price Floor, as BTC Bulls Remain Sidelined

Ethereum continued to trade around a key price floor of ,630 on Thursday, as price uncertainty in the market remained high. Volatility has slowed in recent days, leading to crypto prices mostly trending sideways. Bitcoin fell below a support point of its own earlier in today’s session.
Bitcoin
Bitcoin was trading marginally lower on Thursday, as the cryptocurrency moved below a key point of support.
BTC/USD bottomed out at ,404.36 earlier in the day, less than 24 hours after peaking at ,953.02.
The decline saw bitcoin fall under a price floor of ,600, before bulls intervened to send the cryptocurrency higher.
At the time of writing, BTC is now trading at ,701.34, which sees price below ,000 for a third straight day.
Although sentiment has been mostly bearish, price stability has largely remained, with traders so far avoiding a drop under ,000.
This could be tested as we head towards next week, with several key economic announcements set to be released in the United States.
Ethereum
Ethereum (ETH) tracked close to a support point of ,630 for a fourth straight session, as traders continued to fight to secure marker momentum.
Following a low ,611.15 on Wednesday, ETH/USD spiked to a peak of ,656.93 earlier in the day.
Price has since slipped, with the world’s second largest cryptocurrency now trading around the ,626.20 level.
The decline came as the 14-day relative strength index (RSI) hovered near a floor of its own at 36.00.
Looking at the chart, the index is now tracking at 36.30, with a move lower likely to trigger an increase in bearish pressure.
A move below ,600 remains a real possibility for the coming days.
Register your email here to get weekly price analysis updates sent to your inbox:
Could we see a downtrend occur as we head into the weekend? Leave your thoughts in the comments below.
Biggest Movers: DOGE Nears Key Price Floor, as TON Extends Gains
Dogecoin moved closer to a key support level on Friday, as the meme coin slipped for a second straight session. Today’s decline comes as the global crypto market cap edged lower, falling 0.77% lower as of writing. Toncoin was on the other side of the spectrum, hitting a one-week high.
Dogecoin (DOGE)
Dogecoin closed in on a collision with a key price floor on Friday, as the meme coin fell for a second straight day.
DOGE/USD dropped to a low of .0619 earlier in today’s session, following a high of .06308 the day prior.
As a result, dogecoin was a stone’s throw away from a support point at the .06000 mark.
This turn in sentiment comes after the price was unable to break out of a resistance level of .06500 on Wednesday.
The relative strength index (RSI) also failed to breach a ceiling of its own at 36.00, and is now tracking at 33.37.
Should this decline continue, bears will likely look to exit once the index reaches a floor around 32.00.
Toncoin (TON)
On the other hand, toncoin (TON) was mostly in the green during today’s session, as price remained near a one-week high.
Following a low of .40 on Thursday, TON/USD peaked at .44 earlier in the day, its highest point since last Thursday.
The move saw the token near a resistance level of .50, a point which was last hit on August 16.
Sentiment has somewhat shifted as the day progressed, as a result of the RSI hitting a ceiling of 58.00.
Currently, price strength is tracking at 54.44, and seems to be heading towards a floor around the 50.00 region.
In the event this target is reached, TON will likely move below .20.
Register your email here to get weekly price analysis updates sent to your inbox:
Will momentum continue to trend lower this weekend? Let us know your thoughts in the comments.
Bitcoin, Ethereum Technical Analysis: BTC Hovers Near Key Price Floor, Ahead of US Inflation Report
Bitcoin was hovering close to a key price floor near ,300 on Wednesday, as markets anticipated the upcoming U.S. inflation report. Consumer prices for last month are expected to remain at 5%, which could be seen as justifying the Federal Reserve’s decision to hike rates last week. Ethereum remained above ,800.
Bitcoin
Bitcoin (BTC) continued to consolidate on Wednesday, as markets awaited the latest inflation report from the United States.
Following a high of ,824.39 on Tuesday, BTC/USD dropped to an intraday low of ,375.60 earlier in today’s session.
Today’s move pushed bitcoin close to a key support point at ,300, however prices have since rebounded.
Overall, it appears that the previous drop took place following a breakout on the relative strength index (RSI).
Price strength moved below a floor at 43.00, with the index tracking at 42.63 at the time of writing.
Bitcoin is now trading at ,607.96.
Ethereum
Ethereum also hovered close to a support point of its own in today’s session, as overall market sentiment remained uncertain.
ETH/USD hit a bottom of ,835.70 on Wednesday, which comes a few days removed from price trading above ,000.
Overall, ethereum is now in the red for a fifth consecutive day, and is down nearly 10% within that period.
This recent run has sent the 25-day (blue) moving average (MA) lower, with the trend line fast approaching its 10-day (red) counterpart.
Although longer-term momentum is slowing, the fact that the 10-day MA is below the 25-day line, means an upwards crossover could lead to a bull run.
Should this occur, there is a good chance that the target for bulls will be to recapture the ,000 point.
Register your email here to get weekly price analysis updates sent to your inbox:
Do you expect inflation to fall further today? Leave your thoughts in the comments below.
NFT Floor Prices Plunging Amid Ongoing Crypto Market Pandemonium
The crypto markets has plunged by 14% over the past 24 hours, including the double whammy of Ethereum’s loss of 18% and Bitcon’s dip by 16% while NFT sales are also suffering from the crypto market crash but primarily because of ETH prices plummeting.
On a lighter note, NFT trading volume has incremented over the 24 hours by 54%, which is an excellent opportunity for collectors to hoard prized NFT collections.
The prices of high-end and popular nonfungible token collections like Bored Ape Yacht Club have also plunged; its lowest NFT floor price dropped by as much as 16%, or 7,000. The Bored Ape floor price plummeted by 11%, or roughly 74.5 ETH.
Nevertheless, the project has depreciated since May. On April 29, you can buy the cheapest Bored Ape NFT at 152 ETH or a whopping 9,000. You’ll see the enormous difference in the numbers.
Crypto Winter: Total Market Cap Drops By Trillion
The total market cap of all cryptocurrencies has dropped to as much as 9 billion on Monday. And NFT collections are following suit.
More popular blue-chip nonfungible token collections are crashing like Doodles dropping by 21% or a current floor price of 8.1 ETH or equivalent to ,650, Mutant Ape Yacht Club decreased by 22% or 14 ETH which is around ,100, Meebits that toggled down by 27% or a floor price of 2.8 ETH which is about .050, and Moonbirds that spiraled down by 16% which is about 16.2 ETH or ,250.
BTC total market cap at 9 billion on the daily chart | Source: TradingView.com
Suggested Reading | Dogecoin Shed 91% Of Its Value Since 2021 High – A Musk Tweet To Pump DOGE?
NFT Floor Price Drowns; Trading Volume Escalates
While the NFT floor price is in the hock, trading volume is increasing. Many collectors are taking advantage of falling ETH prices to grab blue-chip NFT collections at lower price tags.
Total nonfungible token sales are now at million, which may seem lower than the sales in early May, but it’s a significant improvement compared to the previous days. NFT market has risen remarkably by 54% in terms of trading volume over the past 24 hours.
Trading volume in 2021 was at billion, making this year’s stats a massive improvement. And the numbers can still increase in the following days. OpenSea NFT sales spiked to as much as 6 million. The nonfungible token market appears to be more robust now than ever despite the crypto struggles and uncertainty.
Suggested Reading | Ether Drops Below ,400, Pummeled By US Inflation And Difficulty Bomb Setback
Featured image from Blockworks, chart from TradingView.com
NewsBTC