 Google Trends data reveals a consistent increase in search interest for “CBDC,” which stands for central bank digital currency, over the past five years. The term has maintained a score above 20 since August 2022, on a scale of 1 to 100, where 100 signifies peak interest. CBDCs See Consistent Search Growth, Top Regions Include […]
Bitcoin News
Blackrock’s Bitcoin ETF Rockets to Top Five in 2024 ETF Inflows After Just 17 Days
Blackrock’s Ishares Bitcoin Trust (IBIT) has rapidly ascended to the upper ranks of the exchange-traded funds (ETFs) market, landing among the top five in terms of 2024 inflows in just 17 days, showcasing the burgeoning investor interest in cryptocurrency as a legitimate asset class.
Blackrock’s Bitcoin ETF Inflows Greater Than 99.98% of ETFs This Year
Blackrock’s Ishares Bitcoin Trust has ascended to the upper echelons of ETFs based on year-to-date inflows, landing a spot among the top five just 17 days post-launch.
Eric Balchunas, a senior ETF analyst at Bloomberg, highlighted this achievement on X, noting that IBIT had attracted more cash than 99.98% of ETFs, a staggering feat for a fund that’s barely over two weeks old. Some of this influx of investment can be attributed to a strategic shift among asset managers. Balchunas gives the example of Canadian asset manager Redwood, which transitioned from the Canadian Purpose Bitcoin ETF with fees greater than 1%, to the more cost-effective IBIT, which offers free management for the first billion in assets and a modest 25 basis points fee thereafter.
Also $IBIT now in Top 5 in YTD flows, which means it’s taken in more cash than 99.98% of ETFs. Not bad for 17 days old. pic.twitter.com/ehAsZWRoqK
— Eric Balchunas (@EricBalchunas) February 6, 2024
IBIT has amassed .2 billion in inflows, outpaced only by heavyweight index ETFs like the Ishares Core S&P 500 ETF (IVV) and the Vanguard 500 Index Fund ETF (VOO), which cater to traditional equity markets. This places IBIT in an elite group, not just within the realm of cryptocurrency funds but across the broader ETF market.
Fidelity’s Wise Origin Bitcoin Fund (FBTC) also makes an appearance in the top 10 of ETF asset gatherers this year, securing the eighth position with .7 billion in inflows. However, despite the impressive start for these bitcoin-centric funds, the overall investment pace into new spot bitcoin ETFs has shown signs of deceleration.
Yet, Blackrock’s IBIT and Fidelity’s FBTC distinguish themselves as the only funds among their peers to have maintained a consistent positive flow of investment since their market debut. This achievement underscores the growing investor appetite for bitcoin as a legitimate asset class within diversified investment portfolios.
The performance of Blackrock’s ETF is particularly noteworthy, with Bloomberg’s Balchunas reporting a top 0.02% placement against an estimated 10,000 ETFs worldwide, a testament to the robust demand for cryptocurrency investment products.
The competitive landscape among spot bitcoin ETFs is becoming increasingly clear, with ARK 21shares and Bitwise trailing behind Blackrock and Fidelity in terms of accumulated flows. Meanwhile, Grayscale’s converted spot bitcoin ETF is experiencing a gradual reduction in outflows, suggesting a potential stabilization in the market.
As the landscape of cryptocurrency funds continues to evolve, the success of IBIT and its peers will likely serve as a bellwether for the future of digital asset investment.
Do you think that inflows into spot bitcoin ETFs will continue throughout this year? Share your thoughts and opinions about this subject in the comments section below.
Ethereum Bearish Signal Reappears After Five Years To Threaten ETH’s Price
Ethereum has been one of the cryptocurrencies to maintain a reasonably high level even through multiple price crashes in the market. However, it seems like the altcoin will not be able to hold as it has done in the past with a dreaded bearish signal resurfacing to threaten the asset’s price.
Ethereum Addresses Holding More Than 1,000 Coins Fall
Over the last few years, the Ethereum whales have fervently held on to their coins. The large holders were some of the most convinced when it comes to the altcoin, with the number of wallets holding more than 1,000 coins maintaining above 2018 lows. However, the support has broken as conviction has declined.
Glassnode reported on Wednesday, September 20, that the number of ETH addresses holding more than 1,000 coins has finally fallen to 6,082. The last time that the figure was this low was back in 2018 when the bear market was in full bloom.
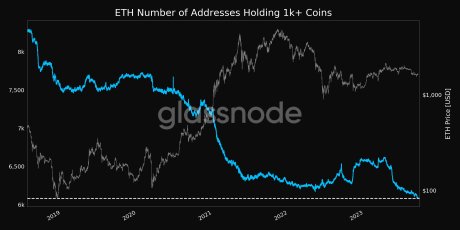
This means that for the last five years, this number has held, until now. The significance of this decline is evident in what happened the last time when the figure was this low. With the bearish trend that was recorded in 2018, expectations have turned to a decline for Ethereum’s price as well.
What Happened The Last Time?
In 2018 when this Ethereum metric was at this level, the altcoin’s price suffered massively. The year saw its price plunge from as high as ,367 to as low as in the span of 12 months. The low conviction that followed this would carry on into the next year, triggering a long bearish winter for ETH.
Ethereum’s already tepid hold on the ,600 level is also threatened by massive sell-offs. Over the last few days, there have been a series of large transactions all carrying massive amounts of ETH toward centralized exchanges.
The most recent of these transactions include 22,343 ETH worth .2 million at the time of the transaction being moved to Coinbase. Two hours later, Whale Alert flagged another large transaction carrying 16,500 ETH (.77 million) to the OKEx crypto exchange.
Since one of the major reasons why investors transfer tokens to centralized exchanges is to take advantage of their deep liquidity and sell their tokens, it is possible these whales are looking to sell these coins. In such a case, investors could be looking at massive selling pressure on the horizon for ETH, which could send its price back below the ,600 support.
Bankman-Fried Wants to See His Lawyers Outside Jail Five Days a Week

FTX founder Sam Bankman-Fried (SBF) is asking to be released from jail five days a week to work on his defense for the fraud trial against him set to begin in October. On Friday, Bankman-Fried’s lawyers complained to a judge in Manhattan that the currently proposed preparation time and regime for his case is “inadequate.”
SBF Seeks Daily Meetings With Lawyers at Courthouse and Laptop With Internet
Disgraced crypto mogul Sam Bankman-Fried is asking to be allowed to leave the Metropolitan Detention Center (MDC) in Brooklyn, New York, five days a week in order to meet with the members of his defense team at the federal courthouse in Manhattan.
The request comes just days after the 31-year-old founder and former chief executive of the failed cryptocurrency exchange FTX was jailed in the MDC based on allegations of witness tampering ahead of his trial scheduled to begin Oct. 2, Bloomberg and Reuters reported.
Prior to that, the former billionaire, who was arrested in the Bahamas and extradited to the U.S. about a month after FTX filed for bankruptcy protection in mid-November, had been living under house arrest at his parents’ home in California on a 0 million bond which was revoked.
In a letter to U.S. District Judge Lewis Kaplan, his lawyers described as “entirely inadequate” the conditions under which SBF is expected to prepare for his trial. They said that giving him just two days a week to review the large volume of evidence violated his right to effective counsel and pointed he has no dedicated computer or way to share materials with them online.
Federal prosecutors had offered to load documents onto hard drives that Bankman-Fried could use on computers at the MDC. According to the government, however, it’s not feasible to load all the documents onto an internet-enabled laptop. In a letter to Kaplan, the prosecutors also insisted that SBF had been offered “extraordinary accommodations” at the Brooklyn jail.
Sam Bankman-Fried has been accused of misappropriating funds of FTX customers worth billions of U.S. dollars. He allegedly used the stolen money to finance his Alameda Research hedge fund, buy expensive property and make political donations. He has pleaded not guilty. Next week, he will be arraigned on an amended indictment with seven fraud and conspiracy charges.
Do you think Bankman-Fried will be allowed to leave jail five days a week? Tell us in the comments section below.
BRC20 Token Economy Thrives Amidst Crypto Downturn, Surging 53% in Five Days

Despite the broader crypto-economy experiencing a downward trajectory, dropping 1.59% in the past 24 hours and hovering around .11 trillion, the BRC20 token economy has bucked this trend, expanding from 9 million to over 7 million within five days.
Impervious to Market Slump, BRC20 Tokens Defy the Odds
Built atop the Bitcoin blockchain, the recently established BRC20 token economy has seen significant growth in the past five days. As of Thursday, May 11, its total market valuation stands at 7 million, representing a 53% increase since May 7. Moreover, there are currently 14,450 BRC20 tokens in circulation – up from 13,530 four days prior – according to brc-20.io statistics.

Dune Analytics data compiled by user “cryptokoryo” reveals that the number of BRC20 transactions totaled 4,809,532 on May 12 at 10:15 a.m. (ET). Unquestionably, Bitcoin miners have relished the additional fees contributed to the network’s block subsidy in light of Ordinal inscriptions and BRC20 tokens’ arrival. Cryptokoryo’s BRC20 analytics indicate that since their inception, miners have accrued 987.34 BTC from BRC20 activities.
Although BRC20 tokens have resisted the wider crypto-economy’s decline, the BRC20 economy did plunge from the 5 million range to its present 7 million value – an 18% loss within the last day. Presently, the BRC20 market boasts approximately 6,477,610 in 24-hour volume and is dominated by the token ordi in terms of market valuation. A single ordi is trading hands for .56 per unit.
Hot on Ordi’s heels are BRC20 tokens vmpx, pepe, meme, and domo concerning market capitalization size. Alongside this burgeoning BRC20 economy, BRC20s, and Ordinal inscriptions have contributed to the Bitcoin blockchain’s current backlog. Although fees and unconfirmed transactions have decreased, between 280,000 and 310,000 unconfirmed transactions remain pending confirmation.
What do you think about the BRC20 growth over the past five days? Share your thoughts about this subject in the comments section below.
Bitcoin Miners Breathe a Sigh of Relief as Difficulty Drops 1.45% After Five Consecutive Increases

Bitcoin’s network has been putting miners through the wringer lately, with five straight difficulty increases that had them on edge. However, on May 4, 2023, at block height 788,256, the network difficulty level took a dip, dropping by 1.45% and bringing the overall difficulty down to 48.01 trillion for the next two weeks.
Bitcoin Difficulty Takes a Dip After Five Straight Increases
Bitcoin’s difficulty level finally dropped on May 4, 2023, after increasing five times since the February 24 increase of 9.95%. The five difficulty increases combined equated to a 22.62% increase, and the latest drop brings it down 1.45% lower. The change occurred at Bitcoin block height 788,256. At the time of writing, the network’s hashrate is 355.90 exahash per second (EH/s).

Just two days ago, the Bitcoin network hit a major milestone as its hashrate soared to an all-time high of 491 EH/s at block height 787,895. But with the next difficulty adjustment just around the corner on May 18, 2023, and less than 2,000 blocks away, miners are bracing themselves for what’s to come. While the recent downward difficulty drop has given them some much-needed relief, current block times are still hovering above the ten-minute average. In fact, the last block interval was a lengthy ten minutes and 49 seconds.
In addition, the Bitcoin network is currently grappling with a mempool with over 200,000 unconfirmed transactions waiting to be processed by miners. To expedite the process, users are shelling out a high-priority fee of .05 per transaction, while a medium-priority transfer will set them back .61. As for the top mining pools on May 4, Foundry USA takes the cake with 96.62 EH/s of hashpower, accounting for 27.17% of Bitcoin’s total hashrate. Trailing behind are Antpool (80.38 EH/s), F2pool (48.72 EH/s), Binance Pool (38.16 EH/s), and Viabtc (27.61 EH/s).
What do you think the future holds for Bitcoin’s difficulty level? Will it continue to rise steadily, or can we expect more dips in the coming months? Share your thoughts in the comments section below.
Biggest Movers: DOGE Loses Five Days’ Worth of Gains on Wednesday
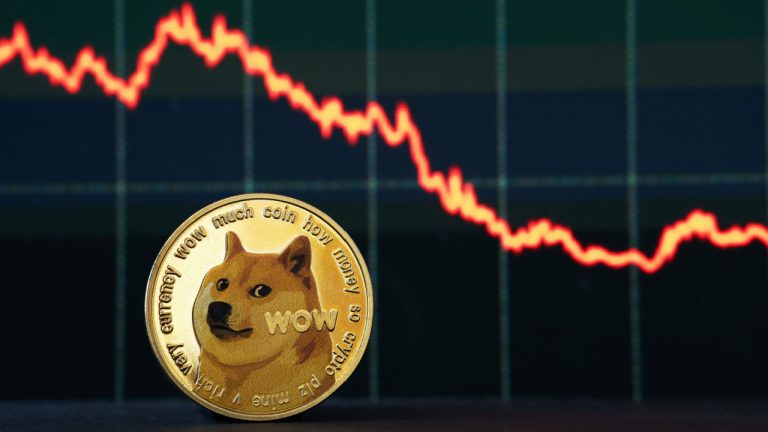
Dogecoin saw a five-day winning streak snapped on Wednesday, with today’s drop engulfing recent gains. The meme coin fell by as much as 6% in today’s session, as sentiment in the crypto market shifted. Solana was also lower, plunging by 9%.
Dogecoin (DOGE)
Dogecoin (DOGE) plunged on Wednesday, as bears entered the market, snapping a five-day win streak in the process.
Following a low of .0853 last Friday, DOGE/USD surged to a peak of .0950 during yesterday’s session.
These gains were wiped today, as the meme coin fell to a low of .0851 earlier in the day.
One of the main catalysts for the drop seems to be a breakout on the relative strength index (RSI), which fell below a floor at 60.00.
At the time of writing, the index is tracking at 54.98, which is marginally higher than a floor at 53.00.
DOGE has since rebounded, and is currently at .08815, however should the RSI continue to fall, the coin could move below .0850.
Solana (SOL)
Another notable mover on Wednesday was solana (SOL), which fell by as much as 9% today.
SOL/USD dropped to a bottom at .27 earlier in the day, which comes following Tuesday’s peak at .22.
As a result of the decline, solana fell to its weakest point since last Tuesday, when the token traded at a low of .83.
Like with dogecoin, today’s drop seems to have coincided with a breakout on the RSI indicator, which moved below 57.00.
Price strength is currently at a reading of 53.36, and is fast approaching a lower point of support at 51.00.
If this downturn continues for the remainder of the week, there is a strong possibility that SOL will move below .00.
Register your email here to get weekly price analysis updates sent to your inbox:
Is today’s downturn simply a matter of profit capturing? Let us know your thoughts in the comments.
MATIC Flashes Five Technical Signals That Led To Previous 10,000% Rally
MATIC, the native token to Polygon is up more than 6% intraday, but could be on the cusp of much more, according to a handful of technical signals.
The last time these five buy signals appeared, MATIC went on an incredible, 10,000% rally in a matter of only four months. Could these same conditions be foretelling of yet another explosive breakout?
Five Bullish MATIC Technical Signals
The recent rally in MATIC has moved the cryptocurrency past Dogecoin and into the number 9 rank by market capitalization. But the upside in the token might only be beginning.
Polygon is preparing to launch its zero-knowledge Ethereum Virtual Machine (zkEVM) beta mainnet on March 27 and has been tapped by major companies Meta, Disney, Adidas and Starbucks, giving it plenty of fundamental value.
From a purely technical perspective, MATIC could be ready to pop. Five potential bullish signals are triggering or close to it, that in the past when combined led to a 10,000% price increase.

Momentum is increasing and flipped bullish | MATICUSD on TradingView.com
LMACD
It’s no surprise given the positive narrative in Polygon that the MATIC token is gaining momentum. That increase in momentum can be seen in the weekly Logarithmic Moving Average Convergence Divergence indicator, otherwise known as the LMACD.
The tool is crossing above the zero line on an already green histogram, while the MACD line has passed through the signal line from below.

Bollinger Bands
If MATIC can maintain current price levels or higher on the one-week timeframe, the token will have closed outside of the weekly Bollinger Bands. A close outside of the upper band is a buy signal and can suggest strong continuation if the bands begin to expand and price rides the upper band higher.

SuperTrend
At the very same level as the upper Bollinger Band, the SuperTrend has been tapped, triggering a buy signal. The signal actually appeared last week, and has since been confirmed.

Ichimoku
Continuing to highlight the important confluence of indicator resistance potentially being broken at this very moment, MATICUSD 1W has pushed into the Ichimoku cloud and is nearly at the top of it. Once outside the cloud, it’s clear skies for higher prices.
The Tenkan-sen and Kijun-sen are also crossed bullish and price is above the two lines, which are rising to show a trending market. Very little Chikou span resistance is located above this level.

TD Sequential
Last but not least brings timing into play, with MATIC about to face off against TDST downtrend resistance, indicated by the red line created by the TD Sequential indicator. The token hasn’t made it through quite yet, but adds to the stacking signals appearing on the same weekly timeframe.

Another 10,000% Rally?
The last time all of these signals appeared simultaneously, MATICUSD climbed by 10,000% in only four months. Another 100x would take the cryptocurrency to over 0 a token. While another rally of that size is unlikely, a promising uptrend could be nearing a breakout. Considering the confluence of resistance at this level, failure would also be catastrophic and crush confidence further in the token.
Whales Across These Five Chains Are Heavy On Stablecoins, Should You Be Too?
Crypto whales all across the board have been seemingly taking more conservative positions in stablecoins since the bear market started. This has evolved into larger holdings in dollar-pegged cryptocurrencies which have very low volatility. These digital assets have since become a safe haven for investors who are looking to escape highly volatile tokens but still keep their funds in the crypto market.
Crypto Whales Move To Stablecoins
Usually, there has been a marked increase in the stablecoin holdings of the top Ethereum whales but this trend of moving into stablecoins seems to not be localized to just Ethereum whales alone. Data shows that the holdings of whales across 5 blockchains are increasingly skewing towards stablecoin holdings.
The 5 blockchains in this report are Ethereum, Fantom, BNB Chain, Avalanche, and Polygon, and takes a look at the holdings of the top 1,000 whales. The holdings of the largest whales across all of these chains are mostly in the native tokens of the chain, but stablecoins such as USDT and USDC are increasingly important to them.
For the top 1,000 ETH whales, USDC and USDT currently account for 2 million (26.9%) and 0 million (22.7%) of their holdings respectively. BNB Chain whales leaned even more heavily with BUSD making up 41.19% (5 million) and USDT making up 16.22% (4 million) of their holdings.
USDT market dominance at 7.68% | Source: Market Cap USDT Dominance on TradingView.com
Fantom (FTM) whales were more into USDC with 30.75% ( million) of their holdings in the stablecoin, and 4.67% (.8 million) in fUSDT. Avalanche whales hold 74.2% (5 million) of their holdings in USDT, and 5.68% (.3 million) in USDC. Polygon whales allocated the least to stablecoins with only 6.09% (.1 million) held in USDC.
Time To Flee For Safety?
Whale holdings and their investment trends can often sway investor sentiment because it shows what these large holders are thinking about the crypto market. Their recent move to stablecoin holdings shows that they expect the market prices to go much lower in the near future.
This is not strictly out of line given that indicators show that the crypto market has yet to see its bottom. Previous bear markets have seen the prices of digital assets such as bitcoin and Ethereum falling more than 80% each, putting the market bottom of bitcoin at around ,000.
Given this, and the fact that the market follows the price of bitcoin, if it is not at the bottom, it is a good time to seek safe haven in these digital assets. It helps investors preserve the value of their funds while waiting for better market conditions to start reinvesting.
Featured image from Schroders, chart from TradingView.com
Follow Best Owie on Twitter for market insights, updates, and the occasional funny tweet…
Five Months Of Fear: When Will The Bitcoin Carnage End?
Data shows the Bitcoin market has mostly showed a sentiment of fear and extreme fear for around five months now as the price continues to struggle.
Bitcoin Fear And Greed Index Continues To Point At A Fearful Market
As per the latest weekly report from Arcane Research, the crypto market has remained fearful this week as prices show no signs of recovery.
The “fear and greed index” is an indicator that tells us about the general sentiment among Bitcoin and crypto investors.
The metric uses a numeric scale that runs from one to hundred for displaying the sentiment. Values below fifty usually denote “fear,” while values above the mark indicate “greed.”
Index values of above 75 and below 25 signify that the market is facing extreme greed and extreme fear, respectively.
The fear and greed index being in the vicinity of fifty may be taken as a sign that the sentiment is rather neutral at the moment.
Now, here is a chart that shows the trend in the Bitcoin fear and greed index over the past year:
It looks like the indicator is still observing a rather low value | Source: Arcane Research’s The Weekly Update – Week 17, 2022
As you can see in the above graph, the Bitcoin fear and greed index has a value of 27 this week, showing that the market is near extreme fear.
Related Reading | Altcoin Aversion: Why Bitcoin And Stablecoin Dominance Is On The Rise
With the exception of some brief spikes to neutral sentiment, this fearful sentiment has griped the crypto market for over five months now.
Bitcoin has been facing carnage during this period and so far there hasn’t been any signs of it stopping anytime soon.
Related Reading | Bitcoin Taker Buy-Sell Ratio Rebounds Back Into “Hold” Zone
The report notes that one of the factors that go into measuring the sentiment is the relative performance of altcoins against Bitcoin. Recently, altcoins have been doing very badly, thus adding to the fear sentiment.
Currently, it’s unclear when a neutral or greedy sentiment may return to the crypto market. Prices will likely have to show any real rebounds if the investor mindset has to improve.
BTC Price
At the time of writing, Bitcoin’s price floats around k, up 1% in the last seven days. Over the past month, the crypto has lost 15% in value.
The below chart shows the trend in the price of the coin over the last five days.
Looks like the price of the crypto has surged up over the last twenty-four hours | Source: BTCUSD on TradingView
Bitcoin seems to have been continuing its consolidation further this week as the coin has still remained trapped below the k mark.
Featured image from Unsplash.com, charts from TradingView.com, Arcane Research
NewsBTC