 As bitcoin continues to lead the cryptocurrency market, its notable climb beyond previous peaks has drawn the interest of investors and supporters alike. The dominant cryptocurrency’s latest performance suggests it might approach a triple top, potentially exceeding ,000. However, reaching the six-figure mark will be a significant psychological challenge, and it may fall short of […]
Bitcoin News
Potential Downtrend In Play? TON Struggles As Price Falls Below $7.7
TON has experienced a dramatic price shift, falling below .7 three days after reaching an all-time high of .2. This sudden decline has caught the attention of investors and market analysts, raising concerns and sparking discussions about the potential implications of this sharp reversal.
It also follows a period of intense volatility and highlights the unpredictable nature of the cryptocurrency market. With TON’s price trajectory undergoing significant fluctuations, it’s essential to examine the factors contributing to this downturn and explore what this could mean for the future of TON and its investors.
This article delves into an analysis of the recent price movements and potential outcomes of TON’s sudden drop after setting a record high. As of the time of writing, TON has a market capitalization of over billion, a trading volume of over 2 million, and a price drop of 4.03%, trading at around .3 over the past 24 hours. Despite a decline of 5.77% in market capitalization, the trading volume for TON is up by 40.90%.
Market Volatility And Recent Price Movements For TON
On the 4-hour chart, TON is currently attempting a break below the 100-day Simple Moving Average (SMA) after it has successfully broken the .7 support mark.

A careful examination of the 4-hour Composite Trend Oscillator indicator suggests that TON may actively go bearish as the signal line and the SMA of the indicator are attempting to cross below the zero line.
Meanwhile, on the 1-day chart, TON’s price is currently declining toward the .7 support mark. It can be observed here that after TON hit its all-time high of .2, the crypto asset has been dropping down with strong bearish momentum candlesticks.
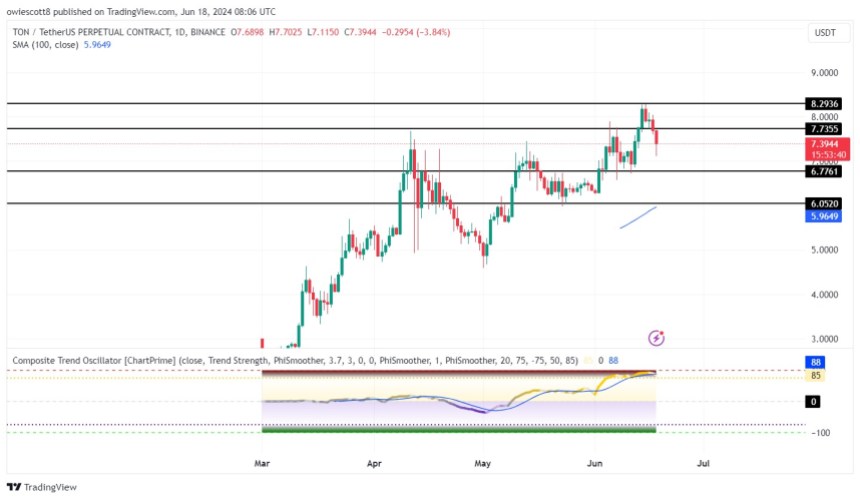
Additionally, the signal line and SMA of the Composite trend oscillator indicator on the 1-day chart are currently trending in the overbought section, with the signal line attempting a cross below the SMA, indicating a bearish move could be on the horizon.
Thus from the 4-hour and 1-day price actions and formation of the indicator used for this analysis, it can be suggested that the price of TON may actively go bearish.
Technical Analysis: Key Support And Resistance Levels
TON’s abrupt fall below .7 after reaching an all-time high of .2 underscores the inherent volatility and unpredictability of the cryptocurrency market. Consequently, if the price of TON continues to move downward below the 100-day SMA toward the .7 support level and breaks below it, it may decline further to challenge the .05 support level.
However, if TON’s price fails to break below the .7 support mark, it will begin to ascend toward the .7 resistance level again. TON could ascend further to challenge the .2 resistance mark and possibly move on to set a new high if this level is breached.
Bitcoin Falls Below $67K, More Than 75K Traders Liquidated Amid Market Decline
 On Tuesday, the price of bitcoin (BTC) fell to an intraday low of ,696 per unit, marking a 3.3% decrease over the last 24 hours. This decline resulted in the liquidation of 0.25 million in long derivatives positions, with .87 million of this amount comprised of BTC long positions. Bitcoin Shudders Below ,000 The global […]
Bitcoin News
Mexican Billionaire Ricardo Salinas Urges Followers to Buy Bitcoin as Nigerian Naira Falls Under a Satoshi
 Ricardo Salinas Pliego, one of the wealthiest billionaires in Mexico, has urged his followers to purchase Bitcoin as a hedge against the devaluation of fiat currencies. Salinas Pliego recommended purchasing bitcoin in response to a social media post reporting on the fall of the value of the Nigerian naira under a satoshi. Mexican Billionaire Ricardo […]
Bitcoin News
Expert Charts 1,400% Course To $7.5 For XRP Price As RSI Falls To All-Time Low
Crypto analyst Egrag Crypto has provided another bullish narrative for the XRP price. This time, he outlined two scenarios that could occur and cause the crypto token to experience a breakout, potentially sending it as high as .5. This comes with the recent revelation that XRP’s Relative Strength Index (RSI) has reached its lowest ever.
Time For An XRP Price Breakout
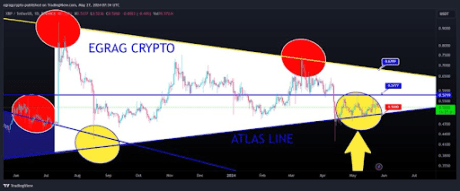
Egrag Crypto shared a chart in an X (formerly Twitter) post that showed that the crypto token could rise to .5 when it accomplishes the breakout, which the crypto analyst claimed is imminent. Egrag highlighted a “White Triangle” breakout on the chart, which he stated is “aligning perfectly” with the previous charts and the Fib 0.702 to 0.786 levels.

He added that the measured move is projected to be between .2 and .5 before XRP could take off and climb to .5. Egrag further remarked that the “critical breakout point” for XRP is around .70 and .7’5 and that the crypto token is “poised” to achieve this breakout in the “next couple of weeks.
Egrag warned that XRP could still experience significant declines before then, stating that a retest of the breakout might be on the cards. However, he is convinced that a “MEGA RUN for XRP is on the horizon.”
Meanwhile, for the second scenario of how XRP could achieve its impending breakout, Egrag Crypto highlighted an ‘Atlas Line’ on the XRP chart and claimed that the breakout point for XRP is at .6799. He noted that XRP is still holding strong “like a boss” on the atlas line, suggesting it shouldn’t be long before it breaks above .6799.
In the meantime, .5777 and .5000 are key price levels that XRP holders should monitor. Egrag labels them resistance and support levels for XRP’s upward trend along this atlas line.
XRP Hits Its Lowest RSI In History
Egrag revealed in a more recent X post that XRP’s RSI is at its lowest ever. He noted that this assertion was based on the monthly time frame and shared a chart to prove his claim. Following his revelation, Egrag highlighted how bullish this was for XRP, stating, “If this isn’t a positive signal, I don’t know what is.”
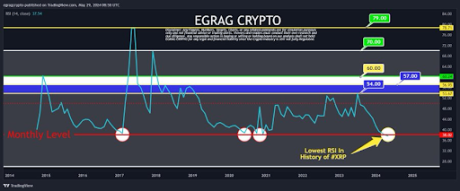
The chart he shared showed that XRP’s Relative Strength Index is at 38, which is indeed bullish for the crypto token. Low RSI levels are considered a buy signal since they suggest that the coin is oversold and undervalued. Therefore, crypto investors might be looking to accumulate XRP, with these buy orders expected to trigger a move to the upside for the crypto token.
At the time of writing, XRP is trading at around .52, up almost 1% in the last 24 hours, according to data from CoinMarketCap.
Shiba Inu Elliot Wave Count Falls Into Place, Here’s Where The Bullish Wave 4 Says The Price Is Headed
Crypto analyst Capt Toblerone recently provided insights into the Shiba Inu (SHIB) future trajectory using the Elliot Wave Theory. This suggested that the meme coin’s recent price correction was simply part of a bigger picture, with the analyst predicting the meme coin will hit a new all-time high (ATH) on its next leg up.
SHIB’s Price Is Headed Towards .00022
Capt Toblerone shared a Shiba Inu chart on his X (formerly Twitter) platform, which showed that Shiba Inu will rise to as high as .00022000 when Wave 3 of the five-way sequence takes place. The chart shows that Wave 2 of the sequence was currently taking place, with SHIB witnessing a corrective move.
A rise to .00022000 would create a new all-time high (ATH) for the second-largest meme coin by market cap, with its current ATH at .00008845. Capt Toblerone’s analysis also showed that Shiba Inu could hit this new ATH by September this year. Interstingly, Shiba Inu’s price isn’t expected to peak there, as the chart also showed that the meme coin could hit another ATH when Wave 5, which is also a bullish move, takes place later on.
In the meantime, SHIB is facing corrective Wave 2, with the meme coin declining by over 7% in the last 24 hours. This follows its recent impressive price rally when it gained over 15% and even flipped Cardano to become the tenth-largest crypto token by market cap.
Although Shiba Inu has once again dropped out of the top 10 rankings with its recent price decline, the meme coin could easily break into it again if it eventually rises to .00022, as Capt Toblerone predicts. Shiba Inu undoubtedly has the bullish momentum to enjoy such price gain since this bull run is expected to be a meme supercycle.
Bitcoin Analyst Is Also Bullish On Shiba Inu
Crypto analyst and early Bitcoin investor Jeremie Davinci recently reaffirmed his bullish sentiment toward Shiba Inu. He mentioned in an X post that the meme coin will break out and rise to as high as .00006000 when this downward trend is over. He further revealed that he will be looking to accumulate more SHIB as he sees an opportunity to make money.
Crypto analyst Oscar Ramos also recently mentioned that SHIB is set to run to its current ATH and “beyond.” He added that the meme coin is ready to shed another zero and rise to .0001. The crypto analyst had previously highlighted this price level as his target for Shiba Inu in this bull run.
At the time of writing, Shiba Inu is trading at around .00002604, down in the last 24 hours, according to data from CoinMarketCap.
Bitcoin’s Runes Protocol Hype Falls Short: Significant Drop in Activity and Fees
 It has been 29 days since the halving and the launch of the Runes protocol, and since May 1, Runes activity has been underwhelming, falling short of the expectations set months prior. Similarly, the trend of Ordinals inscriptions has significantly declined over the past month. Runes Protocol’s Initial Excitement Dwindles Amid Decreased Activity Before the […]
Bitcoin News
This Week’s Biggest Crypto Gainers and Losers: Cheelee Rises as Pendle Falls
 On Monday, the cryptocurrency market maintained steady growth, with its valuation reaching .3 trillion—an increase of 1.72% over the last 24 hours. Over the past week, six cryptocurrencies have posted double-digit gains, while around two dozen have experienced significant losses. Crypto Asset Market Sees Varied Performance This week saw a mixed performance within the crypto […]
Bitcoin News
Injective (INJ) Price In Danger If It Falls To Crucial Support Level: Analyst
INJ, the native token of the Injective Network, commenced May with a fluctuating price action marked by a series of significant losses and gains. As INJ attempts to establish a stable price trajectory, popular market analyst with X handle Crypto Tony has highlighted a pivotal support zone for the altcoin in the coming weeks.
INJ Must Not Fall Below .30 Level, Analyst Warns
In an X post on Friday, Crypto Tony shared a vital insight on the INJ market which could create a sentiment of caution among many traders. The renowned analyst stated that INJ must maintain a market price above the .30 price zone, warning that a dip below this support level could spell danger for investors.
While Crypto Tony did not say the extent of this danger, the possible loss seems to be likely massive as his statements implied the INJ bull traders could struggle to re-establish market control should the token’s price fall below the specified threshold. Furthermore, the analyst stated that early investors of INJ including himself would be immune to this potential downside. However, he still plans to pull out of the Injective market should the token lose its .30 support zone.
Currently, INJ trades around .70 reflecting a gain of 4.68% in the last day after a period of intense market volatility. The altcoin appears to be gathering momentum for a bullish trend following negative performances in recent weeks resulting in a decline of 24.07% in the last 30 days.
What’s Next For Injective?
With respect to a highly anticipated crypto bull run, INJ, which gained by over 3,000% in 2023, has been marked by several analysts as one potentially favorable altcoin for investment in the coming weeks.
Interestingly, these sentiments have been bolstered in recent weeks by a series of positive developments on the Injective network. For instance, Injective recorded 2.4 million transactions in a single day marking a new milestone in daily transactions for the Layer 1 network.
In particular, the Injective 3.0 network upgrade has also been recently approved which is expected to tackle the inflationary problems of the INJ by decreasing the token’s minimum and maximum creation rate by 25% and 30%, respectively over the next two years on a uniform quarterly basis.
Through these deflationary measures, it is expected that INJ would experience an increased scarcity which could, in turn, drive up the altcoin’s market value, thus contributing to a positive performance in the expected crypto bull run. However, investors are reminded that all cryptocurrencies are subject to varying levels of market volatility and are admonished to trade with all necessary caution.
INJ trading at .66 on the daily chart | Source: INJUSDT chart on Tradingview.com
NewsBTC
Crypto Expert Encourages Investors To Buy The Dip As Bitcoin Price Falls To $64,000
The Bitcoin price took a sharp downturn recently, dipping below ,000 and raising concerns among investors. However, a crypto analyst has encouraged the crypto community to buy more Bitcoin at this time, suggesting that the decline presents an opportunity to acquire BTC at a lower price.
Bitcoin Decline Signals Prime Buying Opportunity
Michael van de Poppe, a popular crypto analyst and enthusiast, has remained optimistic about Bitcoin’s future outlook, urging the broader crypto community to view the cryptocurrency’s recent dip as a buying opportunity.
In a recent X (formerly Twitter) post, the analyst shared insights on the crypto market, noting the regular occurrence of both bullish and bearish activities, which contribute to the market’s balance and stability. He also revealed that price corrections were normal in the crypto market, independent of market performance or conditions.
Poppe has encouraged investors and crypto enthusiasts to buy more Bitcoin now that the price is currently trading at ,528, according to CoinMarketCap. Over the past week, the cryptocurrency has witnessed significant price declines, plummeting by 4.64%.
This unexpected price decline has been attributed to the crackdown on Silk Road Bitcoin, an online black market that allows users to purchase illegal and unethical commodities anonymously using Bitcoin.
According to ZachXBT, a crypto community member, the United States government transferred 30,175 BTC worth .1 billion of Silk Road hack funds to Coinbase. This massive Bitcoin transaction has possibly led to the cryptocurrency’s present decline, fueled by bearish news and market volatility.
“At peak bullish momentum, you’ll see a huge impact of every bearish narrative. This time, it’s the Silk Road Bitcoin being transferred. Anyway, buy the dip,” Poppe stated.
BTC’s Peak Anticipated Before Halving Event
In another X post, Poppe revealed disheartening news, noting that a critical price zone had been lost for Bitcoin. The crypto analyst asserted that the cryptocurrency would not witness a surge to new all-time highs during this pre-halving phase unless it breaks through resistance levels at ,000.
The analyst foresees a period of consolidation for BTC, highlighting that during this time altcoins are expected to gain traction while Bitcoin undergoes a correction phase. He further disclosed that a price correction for Bitcoin indicates a healthy and organic market cycle.
Poppe has stated that Bitcoin’s area of interest lies between the range of ,000 to ,000. Concluding his post, the analyst further encouraged investors to acquire Bitcoin, emphasizing that “dips are for buying in these markets.”