 Mauricio Di Bartolomeo, co-founder and CSO of Ledn, a Canada-based bitcoin lending platform, stated that Latam citizens are shifting to elect governments supporting bitcoin as a better money alternative. In an interview with Bitcoin News, Di Bartolomeo stressed that presidents like Bukele in El Salvador and Milei in Argentina have shown Latam that proposals including […]
Bitcoin News
Unlocking The Dogecoin Code: One Factor Holds The Key To Its Next Ascent
Dogecoin, the meme-inspired cryptocurrency that took the internet by storm in 2021, has seen a recent uptick in price. However, experts are cautioning investors against mistaking this blip for the start of a moon mission.
DOGE Price Volatility Takes A Vacation
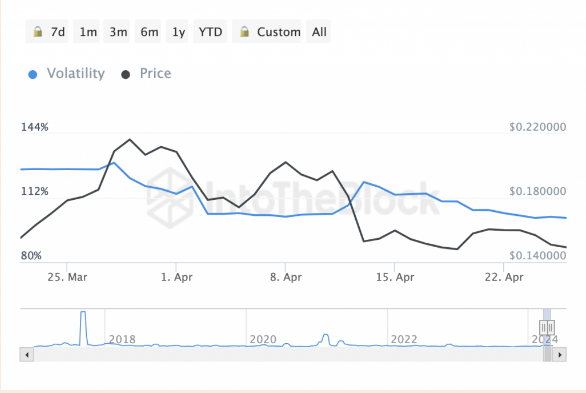
One factor tempering enthusiasm is Dogecoin’s current lack of volatility. While price swings are often a hallmark of the cryptocurrency market, DOGE’s volatility has hit a 30-day low.
This calmness suggests the recent price increase might not translate into a sustained upward trend.
Memecoins like Dogecoin thrive on volatility, and the current lull suggests a period of price stability, which isn’t necessarily bad, but it’s unlikely to trigger the explosive rallies we’ve seen in the past.
Dogecoin Network Activity: Apathy Or Accumulation?
Another dampener on the celebratory champagne showers is the low user activity on the Dogecoin network. The number of active addresses, which indicates user engagement, is currently hovering around 52,000.
This is a significant drop compared to March 2024, when a surge in active addresses coincided with a price jump to .22.
Historically, spikes in Dogecoin’s user activity have foreshadowed price increases. The current low suggests a lack of excitement or, perhaps, a period of accumulation by investors who are waiting for the right moment to jump in.
DOGE Stuck In Consolidation: A Sideways Serenade Or Coiling For A Leap?
For the past few weeks, Dogecoin’s price has been stuck in a consolidation phase, oscillating between .14 and .16. This sideways movement, while frustrating for those hoping for a quick return, could be a sign of a different kind of preparation.
Consolidation periods often precede significant breakouts. While it doesn’t guarantee a future surge, it suggests the price is finding support and could be coiling for a potential leap.
A Glimmer Of Hope: MVRV Z Score Hints At Undervaluation
A beacon of optimism comes from the MVRV Z Score, an indicator that suggests Dogecoin might be currently undervalued.
This metric essentially compares the market value of a coin to its historical value. A score below a certain threshold suggests the coin might be undervalued and has room for growth.
A Slow Burn Or A Surprise Spark?
The current data paints a picture of a cautious future for Dogecoin’s price. While a major rally seems unlikely in the immediate future, there are underlying hints that suggest potential for growth.
The low volatility and user activity could be signs of consolidation and accumulation, respectively, both of which could precede a future price increase.
Featured image from @inevitable360/X, chart from TradingView
Analyst Discusses Bitcoin Price Path To Heighten Fear Factor
MilkyBull, a well-known personality in the world of cryptocurrency analysis, has drawn attention lately for his analysis of Bitcoin’s price trajectory and his prediction of a situation that might cause more fear in the market.
MilkyBull’s analysis delves into the subtleties of Bitcoin’s movement, identifying patterns and trends that could have a big impact on investor mood.
Bitcoin Triggering Anxiety In The Market
According to the analyst, the market will get even more fearful of the Bitcoin price path before it bottoms out and continues to rise. The analyst claimed that because of the current price of BTC, Blackrock iShares Bitcoin Trust (IBIT) saw its first-ever outflows since the approval of the Bitcoin Spot Exchange-Traded Funds (ETFs).
Furthermore, he reminded us that positive news always denotes the peak of a Bitcoin bull cycle, while negative news denotes the bottom. With this notion, investors could position themselves for the next trajectory BTC takes.
To further explore his narrative, MilkyBull drew attention to a previous analysis regarding Bitcoin’s final local bottom in this cycle. Given that BTC is following the PA (Price Action) of 2017, MilkyBull believes that the crypto asset might have bottomed out or come close to it.
Historically, the bull market support band strongly sustains the Bitcoin market in bull cycles. As a result, the analyst is confident that Bitcoin’s price may wick through the support and recover.
Another aspect highlighted by the expert is the Global liquidity during past bull cycles. Presently, Global liquidity is closely linked to Bitcoin at a level where it recovered in October 2022 and October 2023, which led to the inception of a massive surge in the digital assets markets, sparking a massive surge in the whole cryptocurrency market.
With the macro volatility on Tuesday, MilkyBull stated that Bitcoin is at a pivotal juncture for the last local bottom before it resumes its rise to the cycle peak. Though the market does not always respond to such expectations, the majority of members in the crypto space are requesting a correction to ,000.
BTC Poised For A Breakout On The Upside
Another crypto analyst Captain Faibik has also spotted the largest cryptocurrency asset undergoing a price recovery lately. According to the expert, although BTC is currently seeing a rebound, it is still moving inside the falling wedge formation.
Related Reading: Bitcoin Loses Historical Level, Analyst Says “Reclaim And Bounce, Or Die”
Thus, Bitcoin’s bullish investors must overcome the ,000 resistance level for the digital asset to break out from this formation. Should BTC break out from this formation successfully, Captain Faibik anticipates a notable move on the upside toward ,000.
Given that BTC is already trading above ,000, all eyes are now set on the ,000 price level. At the time of writing, BTC was situated at ,701, indicating a rise of over 5% in the past day. Data from CoinMarketCap shows that its market cap has increased by 5%, while the trading volume is down by 21%.
Bitcoin To $45,000 Or $30,000? Analyst Reveals Key Factor That Will Drive The Decision
The flagship cryptocurrency, Bitcoin, looks to be at a crossroads as it continues to trade flat, indecisive about whether to move downward or upward. Commenting on this current price action, crypto analyst Eric Krown Crypto reveals key factors that will decide Bitcoin’s next move.
Bitcoin In “Outlier Land”
In a video posted on his YouTube channel, Eric Krown used the Stochastic indicator to analyze Bitcoin’s current price and predict what direction the crypto token was likely headed. Based on his analysis, Krown noted that the current Stochastic level was pointing to a potential correction that was well overdue for Bitcoin.
The analyst claimed that a correction would likely see Bitcoin drop to the ,000 range, with him marking the ,000 price level as the “worst-case scenario.” Meanwhile, he noted that the 5-day HPDR bands were still showing that the median was around ,500. As such, he expects that BTC could still see a move to that price level or ,000 in the short term.
Krown believes that Bitcoin staying below ,000 means that the correction is likely to come at some point, hinting that Bitcoin could end up closing February in the red. However, a move above ,000 will validate a move to the upside, with the crypto token likely to rise above ,000 and climb to as high as ,000, the analyst claimed.
BTC To Follow History Or Defy Expectations?
Krown also alluded to historical data to prove that Bitcoin’s monthly close in the red was imminent. He stated that Bitcoin usually averaged about three consecutive three months in the green before having a red month. The longest number of months in which Bitcoin has gone in the green is said to be seven.
Therefore, he was suggesting that it wasn’t out of place for February to be a red month for the flagship crypto token, considering that it has ended every month in the green since September. Those gains came largely due to the excitement over the potential approval of the Spot Bitcoin ETFs.
Bitcoin has recently continued to defy expectations, and there is the possibility that February could still end up being a bullish month for BTC. Interestingly, data from Coinglass shows that February (alongside October) is the most bullish month for the flagship crypto token, with Bitcoin closing February in the red on just two occasions.
At the time of writing, Bitcoin is back above ,000, up in the last 24 hours, according to data from CoinMarketCap.
How XRP Price Could Surge To $1.5: Crypto Analyst Explains Key Factor
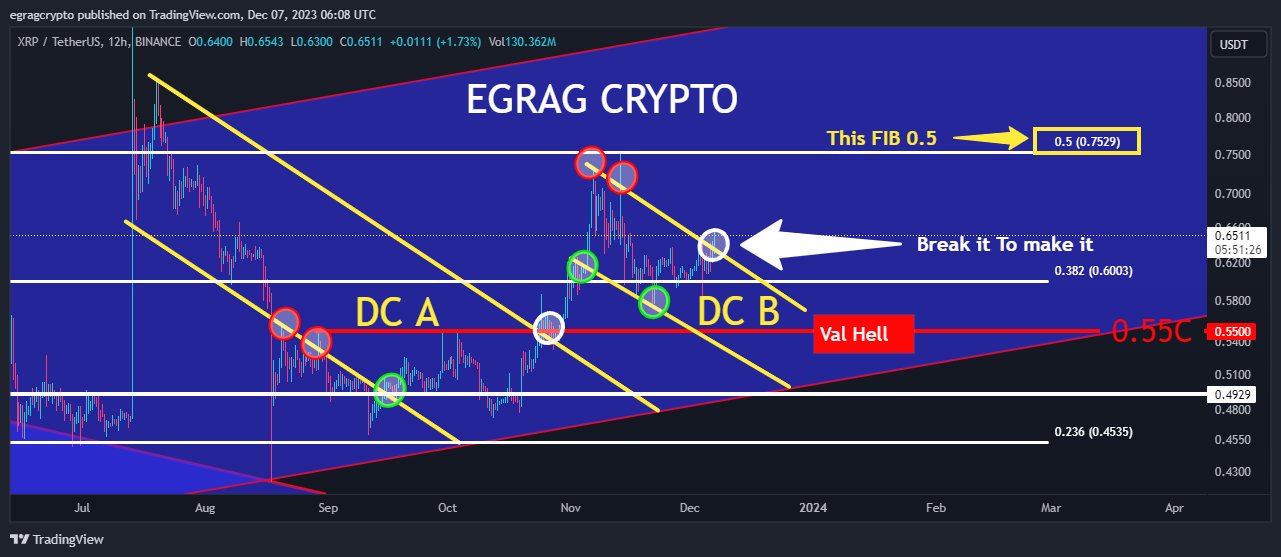
Crypto analyst Egrag has published a new short-term price prediction for XRP, indicating a possible rise should the price overcome a critical technical hurdle. Egrag’s analysis looks at the 12-hour chart of the XRP/USD trading pair, where a trend channel breakout could trigger a short-term buy signal.
XRP Price Breakout Imminent?
According to the crypto analyst, the price has recently been moving within a descending channel (DC). Now, XRP is at an inflection point that could have a significant impact on its price. Egrag has identified the structure as “DC B”, a bearish pattern where the asset has formed lower highs and lower lows.
A key focus of Egrag’s analysis is XRP’s interaction with this pattern. Since the beginning of the chart pattern, the price has twice touched the upper trend line, which serves as resistance, and twice touched the lower trend line, which serves as support.
Currently, the XRP price is about to retest the upper line of the trend channel for a third time. Should it succeed in breaking out of the downtrend channel, this would be an extremely bullish sign. From mid-July to the end of October, the price was already in a descending channel, which Egrag refers to as “DC A” in the chart.
After XRP broke out of the downward channel A, the price rallied by over 50%. Something similar could happen now if history repeats itself. Egrag explained, “XRP seems to be mirroring its previous price action within a descending channel (DC). Check out the chart below to see how price is attempting to break out of DC B. The next challenge for XRP is to surpass descending channel B to reach Fib 0.5.”
What’s Next?
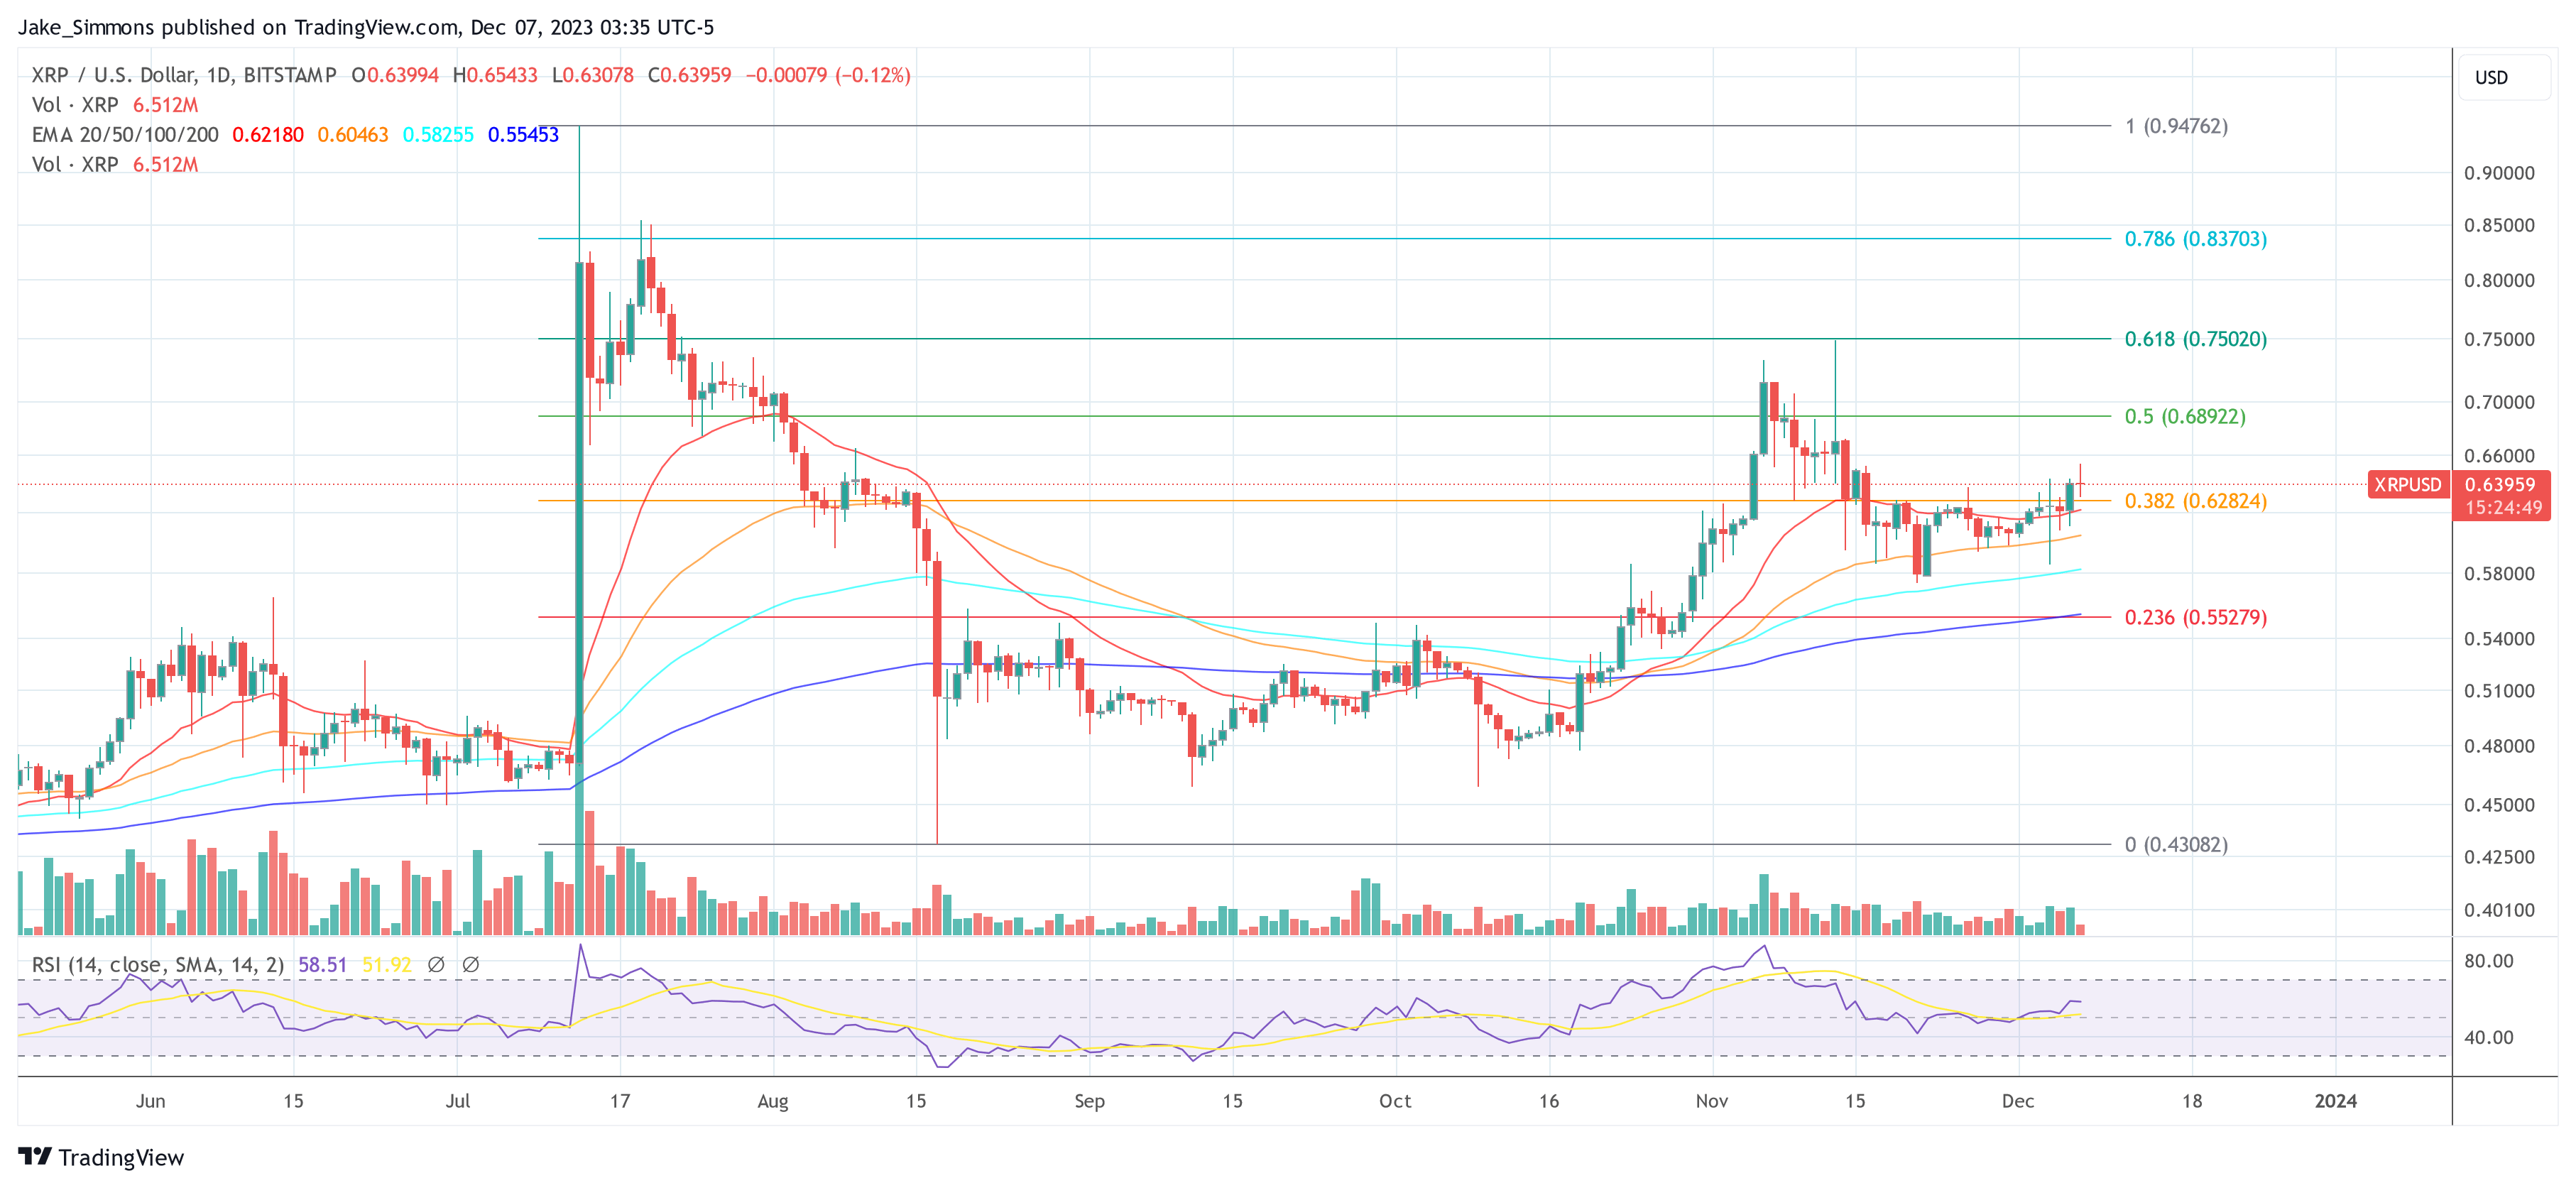
Should a breakout succeed, the 0.5 Fibonacci retracement level at .7529 would be the next major resistance in Egrag’s chart. An upward breakout above this level could indicate the start of a trend reversal that could drive the price towards the .30 to .50 range.
“A breakthrough past the 0.5 Fibonacci level hints at upward momentum, signaling a shift from a downtrend to a potential uptrend, instilling confidence. […] Pay close attention: Fib 0.5 at a price target of 0.7529c could be the gateway to a potential move towards 1.3-1.5$,” Egrag explains, suggesting that such a move would be an important indicator for traders.
In conclusion, Egrag advises investors to keep a close eye on trading volume and overall market sentiment, as these factors will play a crucial role in the asset’s ability to reach and exceed these crucial levels.
At press time, XRP traded at .63959.
Litecoin (LTC) Near-Term Route Could Be Determined By This Factor
Litecoin (LTC) could be heading the bearish route. According to CoinMarketCap, LTC has nosedived by 0.52% or trading at .50 as of press time.
- Litecoin going the bearish track
- LTC down by 0.52%, trading at .50
- LTC engulfing candlestick shows increased selling pressure
In the past few days, LTC is seen to be hovering close to its midpoint. Notably, Litecoin is down by 12.75 from its five-day high yet spiked by 7.26% compared to its five-day low that registered at .56.
LTC price is gliding above the key resistance level. The support is now spotted at .17 and resistance is present at .13. In essence, LTC could experience extreme volatility once the price rally loses steam.
Litecoin Trading at Low Volumes
It can be observed that Litecoin has been trading at ridiculously low volumes lately which means that today’s trading volume is comparably low to the coin’s average trading volume in the past week.
Now, the improvement in market performance has restored the faith of many LTC buyers. It seems there could be hope for a bullish momentum.
However, the 62- range could be getting in the way of a bullish movement. In turn, LTC is seen to have plunged below the EMA ribbons to convey a strong selling or bullish streak.
More so, the recent formation of an engulfing candlestick pattern showed a strong uptick in terms of selling activity.
There is a strong knock-back of higher prices seen close to the 20 EMA that could initiate a near-term disengagement before any opportunities for revival come to light.
LTC RSI Shows Intense Selling Pressure
The buying upturn of Litecoin has propelled the altcoin to test higher levels in the past month. So, while the bears corroborate the -ceiling, Litecoin still sees an ascending channel pattern in this specified timeframe.
Following a short-term compression phase spotted close to the EMA ribbons, LTC finally witnessed a bearish breach splicing under the EMA ribbons. As of press time, LTC has found key support at the .7-zone.
Source: TradingView.com
So, even though the EMA ribbons aren’t looking so positive, the bears aim to shift the near-term trend. Striking a bearish punch on the ribbons would most likely strengthen the selling pressure.
A rebound is spotted at the level that can aid the buyers in triggering a sluggish movement drawing close to the EMAs. Now, any close under this support line could open up the altcoin to a prolonged setback.
When this happens, LTC may dart closer towards the -zone with the bulls going in to trigger intense buying pressure.
RSI for Litecoin shows a strong selling trump card. Now, a prolonged pullback will only work in the favor of the sellers. But, OBV presenting higher troughs showed a minimal bullish divergence.
An uptick in the key support zone can potentially help the buyers to put an end to near-term bleeding. Nevertheless, LTC’s ADX is still having a hard time improving its delicate position.
LTC total market cap at .9 billion on the daily chart | Source: TradingView.com
Featured image from Analytics Insight, chart from TradingView.com
NewsBTC
This Factor Helped to Push Ethereum’s Nexus Mutual (NXM) Up 40% Today
It appears that crypto bulls are back in full force: Ethereum and Bitcoin have pressed 4-5% over the past hour and altcoins have done even better, bouncing swiftly from the weekend lows.
One coin, in particular, has stood out: Wrapped NXM (WNXM) or NXM, an Ethereum-based coin for the Nexus Mutual protocol that has gained over 40% in the past 24 hours.
According to CoinGecko, the coin has gained 44.6% in the past 24 hours, reaching its highest price in many days at .
Related Reading: Here’s Why This Crypto CEO Thinks BTC Soon Hits ,000
Why is the Ethereum Coin Surging
The Ethereum-based coin is surging due to the launch of Yearn.finance’s Yinsure platform.
Users of Yinsure can stake WNXM within the platform and receive the SAFE governance token as a reward. Investors have reported earning around 2-5% per day on their deposits, meaning it’s a very attractive investment opportunity for those within the DeFi space.
As a result, WNXM is moving higher as investors seek to capture the yield.
The Ethereum-based SAFE alone is up around 700% since it launched just 24 hours ago.
Related Reading: This European Crypto Exchange Was Just Hacked for Million
Top Investors Bullish on NXM
Even if the short-term allure of buying NXM ends due to the SAFE pool becoming overcrowded, top investors within and outside of the crypto space are optimistic about the coin and the underlying project.
Remi Tetot, the co-founder of macro research firm Global Macro Investor, recently commented that he thinks Nexus Mutual is crucial as the value of coins locked in DeFi grows, along with the number of users:
“NXM is unique in its offering but also in the way its price model works. Nexus Mutual also have the advantage of 1st mover in the insurance space in crypto….”
He added that he expects the coin to outperform Ethereum in the short term due to the project’s underlying mutual model:
“NXM price collapsed in the last crypto correction, between Sept 2nd and Sept 6th, from (intraday) to nearly . It is now back to and slowly climbing up. While many people, might have got scared by the volatility in price, the collapse was actually a great opportunity for people to purchase at a decent price. As NXM is getting more awareness, we can expect it to outperform Ethereum short term. Especially if their model is confirmed.”
Other bulls include Jason Choi of the Spartan Group.
Related Reading: It’s “Logical” for Ethereum To Reject At Current Prices: Here’s Why
Featured Image from Shutterstock
Price tags: wnxmusd, wnxmbtc, wnxmeth, nxmbtc, nxmusd, nxmeth
Charts from TradingView.com
This Factor Helped to Push Ethereum's Nexus Mutual (NXM) Up 40% Today
Unexpected Factor That Suppressed Bitcoin Bulls in 2019 Is Now Gone
If you’ve been involved in the Bitcoin market over the past year, you know of PlusToken.
PlusToken was a Ponzi scheme with a focus on the Asian cryptocurrency space that was active in 2019. In offering depositors of Bitcoin, Ethereum, EOS and other cryptocurrencies high levels of interest, the operators of the scam managed to garner billions worth of assets. Per some reports, the scam held upwards of billion worth of largely BTC and ETH at its peak.
Related Reading: Crypto Tidbits: Ethereum Surges 20%, US Banks Can Hold Bitcoin, DeFi Still in Vogue
Eventually, the pyramid collapsed; in around July of 2019, the operators of the scam began restricting withdrawals, then began to run from the authorities.
Some ringleaders escaped; others were caught by authorities.
Regardless, from July to as late as early this year, the remaining operators of PlusToken dumped millions of dollars of Bitcoin on the market.
Analysis by the pseudonymous on-chain analyst “Ergo” argued that there was around 1,000 BTC — then worth around ,000,000 — sold every day by the scammers.
Reports from chain analysis companies suggest that PlusToken is largely what caused the crash to ,400. Some argue that PlusToken was also the catalyst for the early 2019 rally to ,000.
Chart of BTC's price action in 2019 from TradingView.com
Fortunately for bulls, reports have just revealed that all the leaders of the multi-billion-dollar scam have been apprehended.
Operators of Multi-Billion-Dollar Bitcoin Scam Apprehended
According to Dovey Wan, founding partner of Primitive Ventures, all members of the PlusToken leadership have been arrested:
“27 core PlusToken team members are all arrested by Chinese police, the biggest crypto scam in the history so far, B worth of crypto is scammed… there are a series of legal enforment actions in past 12 months as it’s core team are all over the world took quite a while.”
FINALLY
27 core PlusToken team members are all arrested by Chinese police, the biggest crypto scam in the history so far, B worth of crypto is scammed
Bulls now have little to no baggage
and lets send it to the
pic.twitter.com/SiDJVSqA5J
— Dovey 以德服人 Wan
(@DoveyWan) July 30, 2020

The commentator suggested that this is pivotal for the Bitcoin bull case as the coins they still hold are now unlikely going to be sold.
It isn’t clear what PlusToken’s administrators had when they were arrested. However, 0 million worth of cryptocurrency was moved from their addresses over the past few months. As reported by NewsBTC, DTC Capital’s Spencer Noon wrote on the matter:
“This week the following #PlusToken funds have been on the move to exchanges and new addresses for mixing: – 22k BTC (3m USD) – 789k ETH (3m) – 26m EOS (m) – 20m XRP (m). The big question: can the crypto markets absorb this volume or are we headed lower?”
Wan, citing information she knows, suggested the figure is closer to billion. Whatever the exact figure, she added that with these arrests, “bulls have little to no baggage,” meaning Bitcoin can be sent “to the moon.”
One of Many Bullish Fundamentals
With PlusToken-related funds unlikely to be moved every again, a massive source of selling pressure is now gone. But this is but one of many positive catalysts for the Bitcoin and crypto market.
Mike Novogratz, CEO of Galaxy Digital, told CNBC on Tuesday that Bitcoin has the potential to reach ,000 this year.
He cited the money printing by the central banks of the world, which should boost the scarce assets of Bitcoin and gold.
Related Reading: On-Chain Metric Signals the BTC Market Isn’t Overheated: Why This Is Bullish
Featured Image from Shutterstock
Price tags: xbtusd, btcusd, btcusdt
Charts from TradingView.com
Unexpected Factor That Suppressed Bitcoin Bulls in 2019 Is Now Gone
This Golden Bull Market Factor Predicts Bitcoin Will Rocket to $14k
Bitcoin price has broken up out of its trading range and has potentially also broken out of a massive, multi-year triangle.
If the breakout can hold and confirm, the first logical target according to an important bull market factor would be ,000.
Bulls Push Bitcoin Price Out of Sideways Range, Causing the Cryptocurrency to Skyrocket
Since early May, Bitcoin price has traded sideways in an increasingly tighter range. Starting early last week, the cryptocurrency began the start of a rally.
The surge caused an initial lift in the Bollinger Bands, which had previously reached a tightness not seen since the November 2018 drop to ,200. It was then on Bitcoin bulls to follow through, or risk a “head fake” according to the technical indicator’s creator.
But bulls have indeed followed through, pushing Bitcoin today through resistance at ,500 and setting another higher high on high timeframe price action.
BTCUSD Daily Triangle Breakout | Source: TradingView
If the cryptocurrency can close today’s daily price candle above the key level and hold it as support, it may be the start of a new Bitcoin uptrend.
BTCUSD faces a pair of sell signals on daily timeframes, however, stimulus packages expected today could keep the asset pumping.
Related Reading | What Happens Next? Bitcoin Range Falls To Tightest Point In History
If it does continue to rally from here, the first major resistance is likely at ,000, according to one crypto analyst.
3/ If we do breakout then a first major area of resistance will be the k area, based on the Golden Ratio Multiplier.
That would be the 1.6 x multiple which has been previous resistance at this early stage of bull markets.
Live chart: https://t.co/7mM9DRe33Z pic.twitter.com/zCfDEh4LCC
— Philip Swift (@PositiveCrypto) July 27, 2020
BTCUSD Resistance Lies At ,000 According To The Golden Ratio
The entire cryptocurrency community is talking about Bitcoin’s breakout from its boring trading range. Momentum pent up from spending such a long time consolidating below resistance could send the cryptocurrency surging much further if the breakout holds.
The first stop and major resistance level above here, according to crypto analyst Philip Swift, is ,000.

XBTUSD Daily Golden Ratio Multiplier | Souce: TradingView
Not only is this the level where the cryptocurrency was rejected from in June 2019, prompting another year of downtrend in the asset class, it is also a target based on the golden ratio. Swift claims that this multiplier has acted as resistance in the past during “early stage” bull markets.
Fibonacci ratios are used to find potential support and resistance in financial assets. Multiples of 1.6x or the golden ratio of 1.618 can have significant reactions when price approaches. Either these areas mark where potential reversals may occur, or they act as key levels that once broken through can have a dramatic effect.
Related Reading | How Will Bitcoin Respond To Its Biggest Listing Yet? The United States
If Bitcoin price can continue to push higher, and breach through ,000, two strong resistance levels remain. One is ,000 where the first lower high took place in 2018 before starting the bear market. The second, of course, is the asset’s former all-time high of ,000.
Could Bitcoin follow gold, which recently smashed through its all-time high and is still climbing ahead of the expected stimulus announcement today from the United States?
This Technical Factor Suggests Bitcoin Will Soon See Explosive Volatility
Bitcoin’s bulls are currently engaged in an intense battle to break above the heavy resistance the cryptocurrency faces at ,500.
The selling pressure seen here has been enough to stop the benchmark digital asset from seeing any type of intense uptrend, but it still remains a possibility that this level is shattered in the near-term.
One factor that could be contributing to this volatility is BTC’s Bollinger Bands’ width recently reaching historic support. This technical trend typically occurs before the cryptocurrency makes a massive movement.
That being said, today’s climb could mark the start of this big movement, and there are several technical factors that seem to favor Bitcoin seeing further upside.
One analyst is noting that a decisive close above ,500 on one of the crypto’s 4-hour candles could be just what is needed for it to make another bid at ,000. How it reacts to this psychologically significant level will likely determine how it trends in the months ahead.
Bitcoin Inches Higher as Analysts Watch for It to Make a Massive Movement
At the time of writing, Bitcoin is trading up just under 1% at its current price of ,450. This is around the price at which the cryptocurrency has been trading at since it first pushed off of its recent lows of ,200.
How it trends from here may be largely dependent on whether or not it is able to surmount the heavy selling pressure sitting around ,500.
It has posted some slight rejections at this level already, but it has yet to see any sharp decline as a result.
One factor to be aware of in the near-term is that a technical indicator hit a level that historically forecasts major volatility less than two days ago.
A popular pseudonymous crypto analyst spoke about this in a recent tweet, explaining that Bitcoin’s Bollinger Band’s width hitting historic support indicates that a large movement is looming on the horizon.
“BBand width is at historic support again. Something big [is] happening very soon. Place your bets,” he explained.

Image Courtesy of Byzantine General. Chart via TradingView
Here’s Why This Next Movement May Favor BTC Buyers
It is important to note that Bitcoin’s buyers may be the beneficiaries of this potentially imminent volatility.
According to a recent blog post from another respected trader, a sustained close above ,500 on the cryptocurrency’s 4-hour candle would indicate that a movement to ,000 is imminent.
“If we get a close above 00 on a 4H candle then if the level seems to be holding as support throughout the daily close then I think a decent long position could be taken with pretty low risk,” he explained.

Image Courtesy of CryptoCactus. Chart via TradingView
How Bitcoin reacts to this level will determine which direction it trends in throughout the summer months.
Featured image from Shutterstock.

Charts via TradingView.