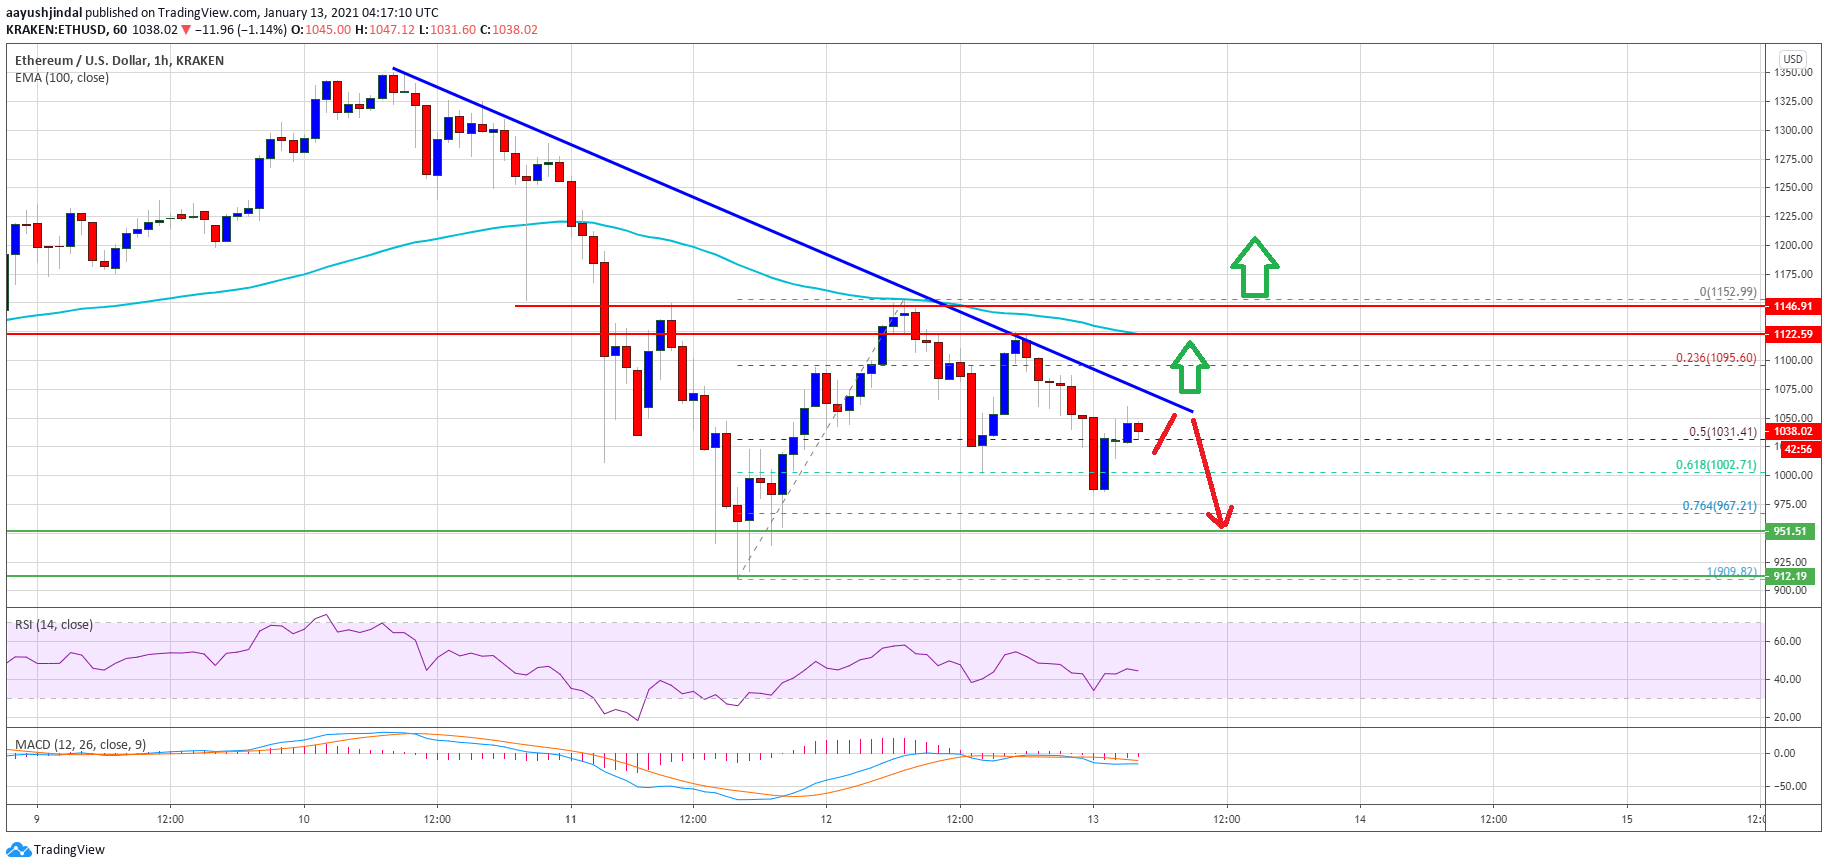
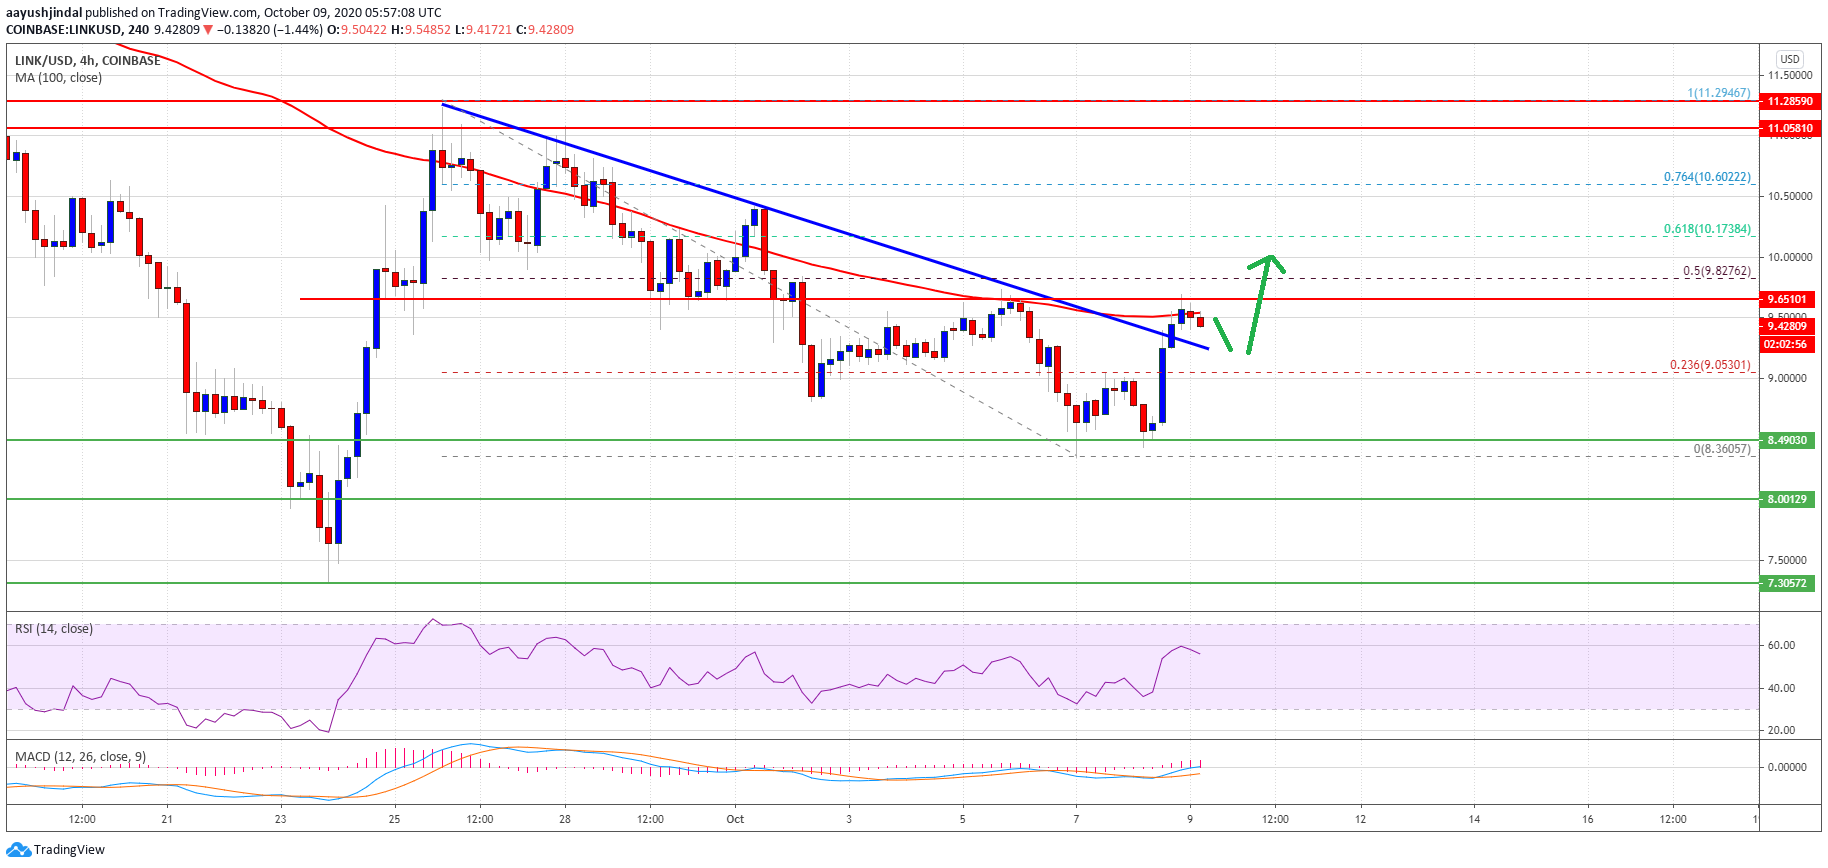
Bitcoin price is showing recovering signs above ,000 against the US Dollar. BTC is facing an uphill task at ,000 and it is likely to continue lower towards ,000.
- Bitcoin is correcting higher from ,865 and it is trading above the ,000 resistance.
- The price is facing a strong resistance near ,000 and the 100 simple moving average (4-hours).
- There is a short-term contracting triangle forming with resistance near ,000 on the 4-hours chart of the BTC/USD pair (data feed from Kraken).
- The pair could face a strong resistance near the ,800 and ,000 levels in the near term.
Bitcoin Price Remains At Risk
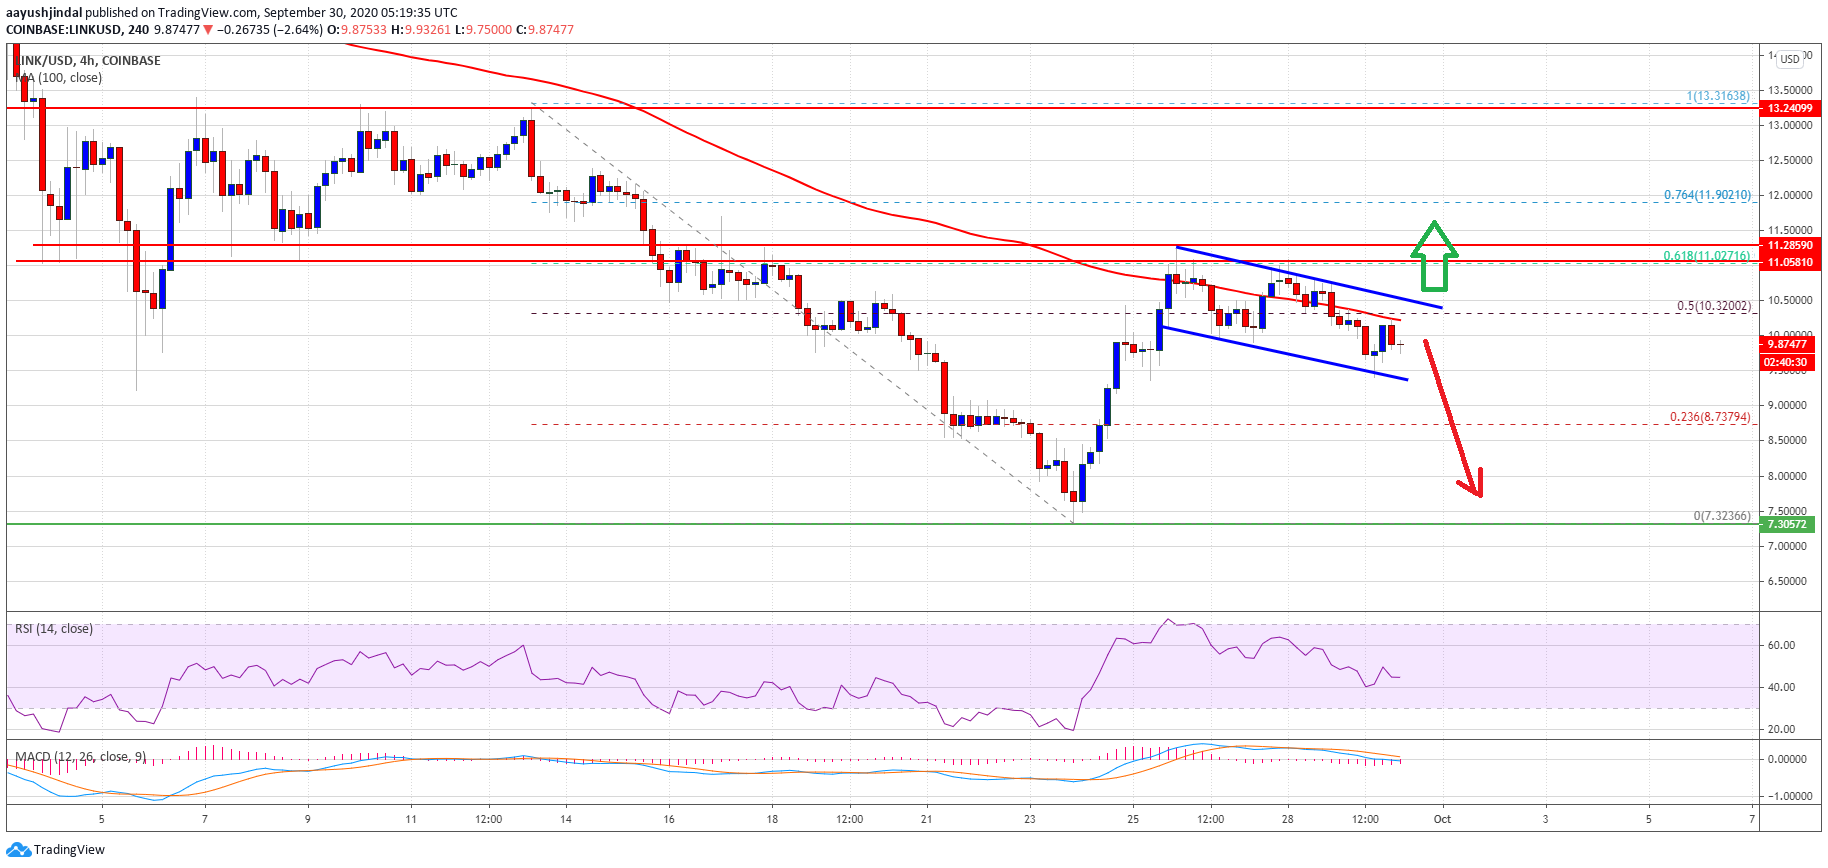
This past week, bitcoin price saw a sharp decline below the ,000 and ,000 support levels against the US Dollar. The BTC/USD pair even tumbled below the ,000 support and settled well below the 100 simple moving average (4-hours).
A low was formed near ,800 before the price started an upside correction. It broke the ,000 level and it even recovered above the ,500 level.
There was also a test of the 50% Fib retracement level of the downward move from the ,847 swing high to ,867 low. There is also a short-term contracting triangle forming with resistance near ,000 on the 4-hours chart of the BTC/USD pair.
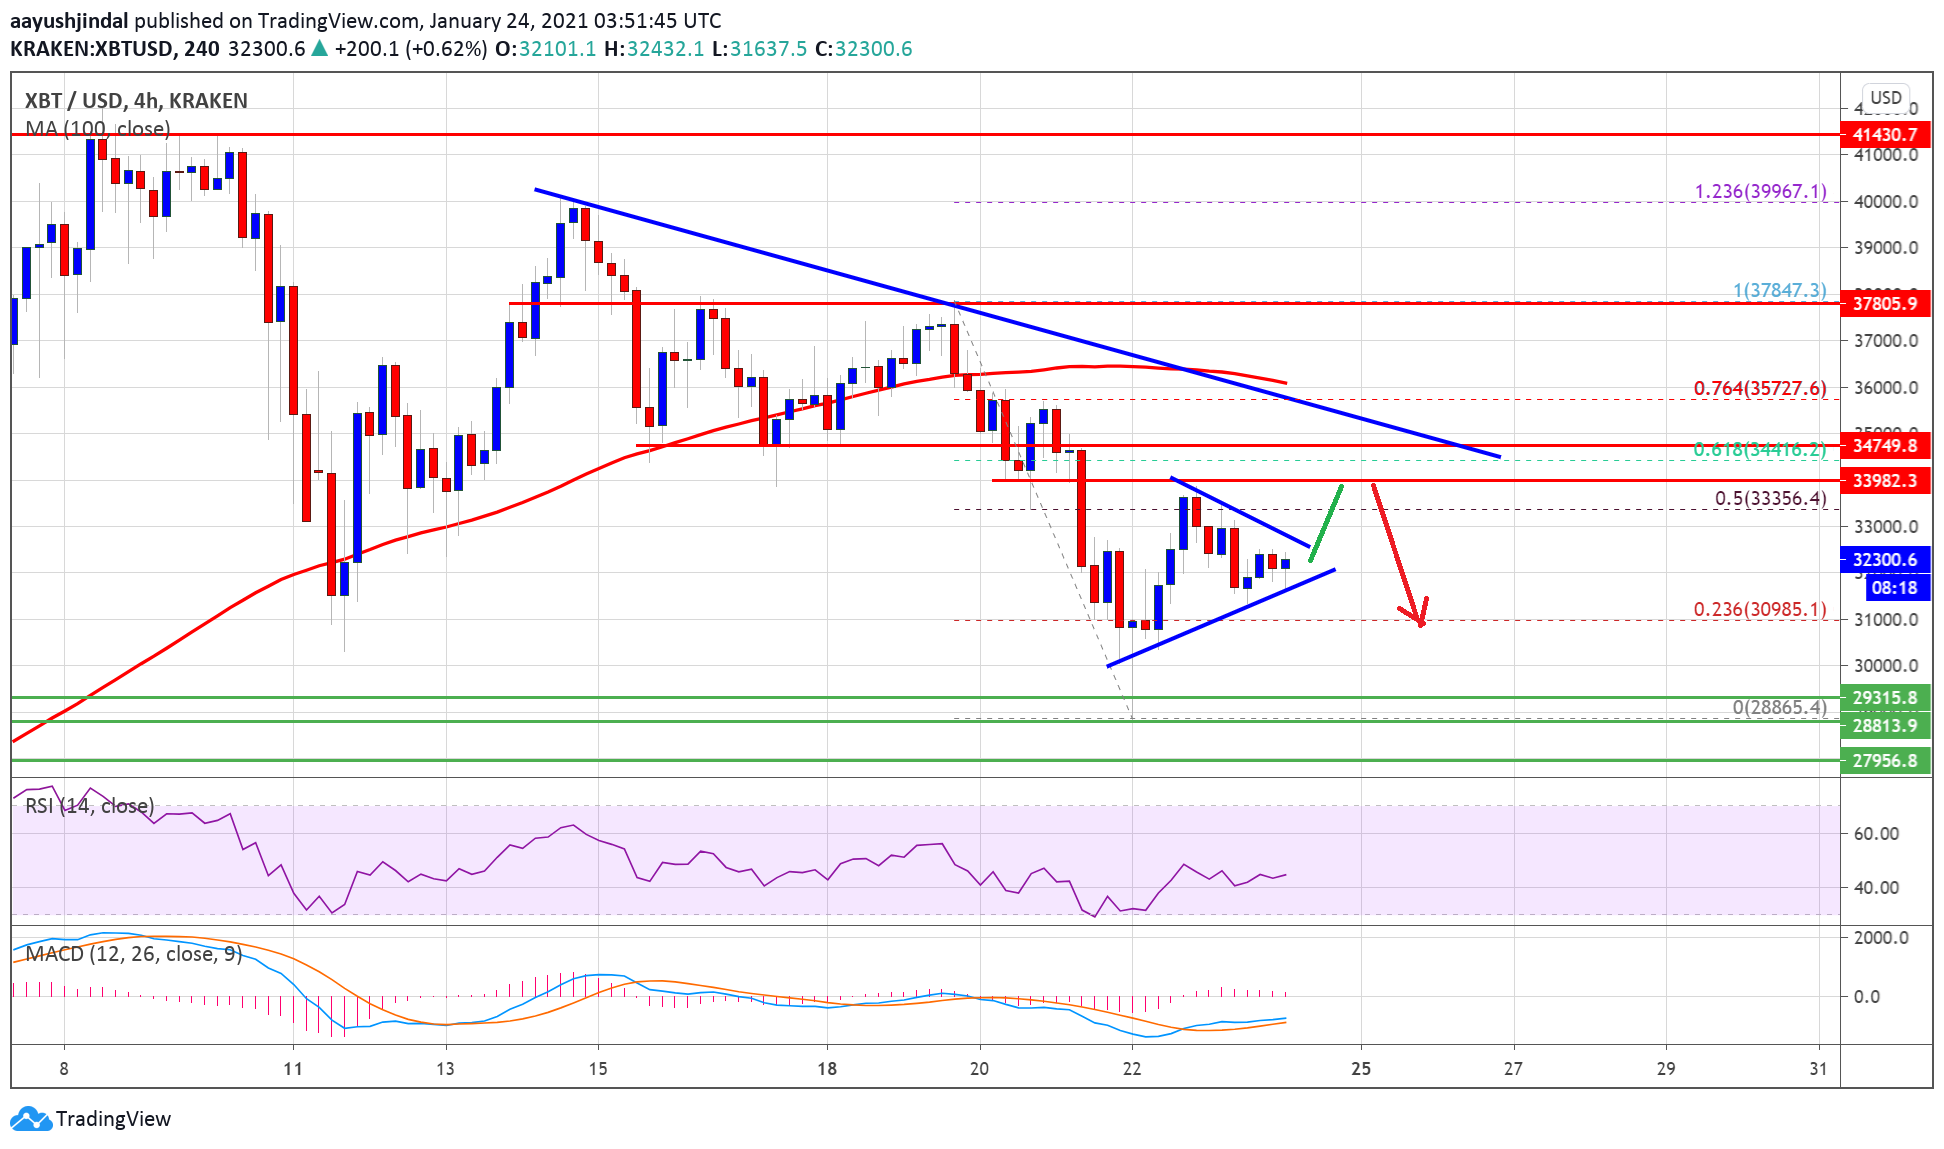
Source: BTCUSD on TradingView.com
If there is a triangle break, the price could face hurdles near the ,800 and ,000 levels. There is also a key bearish trend line forming near ,500 on the same chart. It is close to the 61.8% Fib retracement level of the downward move from the ,847 swing high to ,867 low.
A close above the ,000 and ,500 resistance levels could open the doors for a larger increase. The next major hurdle is near the ,000 level.
Fresh Drop in BTC?
If bitcoin fails to clear the ,500 and ,000 resistance levels, there is a risk of another decline. An initial support on the downside is near the ,800 level.
A clear break below the ,800 and ,500 support levels could clear the path for a push towards the ,000 support zone in the near term. Any more losses might call for a test of ,800.
Technical indicators
4 hours MACD – The MACD for BTC/USD is slowly gaining momentum in the bullish zone.
4 hours RSI (Relative Strength Index) – The RSI for BTC/USD is rising towards the 50 level.
Major Support Level – ,000
Major Resistance Level – ,000