 The volume of daily transactions on the Bitcoin network has seen a significant decline since Jan. 28, 2024, with numbers falling from peaks above 600,000 to below 300,000 transactions per day. This downturn is in sync with a decrease in the daily creation of Ordinal inscriptions, overall easing congestion and reducing onchain fees. Network Activity […]
Bitcoin News
Bitcoin Price Faces Threat As Analyst Foresees $55 Million Liquidation
According to data from CoinMarketCap, Bitcoin (BTC) has maintained its upward price trajectory over the last day, gaining by 4.04% to briefly trade above the ,000 mark. As BTC now hovers around the ,100 price zone, investors and market experts remain highly speculative about the token’s next action. On that note, popular analyst Ali Martinez has called a major prediction that could spell weighty losses for many investors.
Liquidity Hunters Target ,810 In Potential Bitcoin Price Manipulation Plot
In an X post on Friday, Martinez predicted an incoming dip in Bitcoin’s price driven by a planned liquidation. Using data from the cryptocurrency futures trading platform, CoinGlass, the analyst stated the Bitcoin liquidation heatmap indicated that there is potential strategic liquidation in play.
According to the #Bitcoin liquidation heatmap, there’s a potential strategy unfolding where liquidity hunters could drive the price of $BTC down to ,810. This move is aimed at triggering liquidations amounting to .73 million! pic.twitter.com/monFlZmvQ6
— Ali (@ali_charts) February 9, 2024
Martinez stated that liquidity hunters in the BTC market could be looking to push the token’s price as low as ,810 for personal benefits. For context, liquidity hunters are traders or investors who actively seek opportunities in the financial markets to exploit changes in liquidity.
This set of market players often targets specific price levels where there is a concentration of stop-loss orders or where market liquidity is expected to be thin. By triggering liquidations or capitalizing on price movements, liquidity hunters aim to profit from short-term market inefficiencies.
According to Martinez, the liquidity hunters in the BTC market are currently looking to induce an estimated 3% decline in the token’s price. While this change may seem minimal, it represents an astounding .73 million in liquidations. Based on these numbers, BTC traders and investors should be wary of potentially significant losses in the coming days.
BTC Price Overview
The premier cryptocurrency has recently taken flight, gaining by 8.6% in the last two days after a flat period of consolidation stretching to the beginning of February. Interestingly, the asset’s pathway to higher gains appears more confident with recent developments in the Bitcoin spot ETF market, which recorded a total net flow of 3 million on February 8 – the highest value of that metric since January 17.
At the time of writing, Bitcoin trades at ,238, with a 0.26% gain in the last hour. Meanwhile, the coin’s daily trading volume has soared by 56.33% and is now valued at .42 billion. In addition, BTC maintains its top spot in the crypto market with a total market cap of 4.67 billion.
BTC trading at ,229 on the daily chart | Source: BTCUSDT chart on Tradingview.com
NewsBTC
NBA Faces Class Action Lawsuit Over Voyager Digital Promotion
 A class action lawsuit has been filed against the National Basketball Association (NBA), accusing the league of gross negligence through its marketing agreements with the now-bankrupt crypto exchange Voyager Digital Holdings, leading to investor losses of over .2 billion. NBA Hit With Class Action Lawsuit Over Alleged Negligent Crypto Promotions The NBA is embroiled in […]
Bitcoin News
Ethereum Price Faces Big Move – Can Bulls Send ETH To $2,500?
Ethereum price gained traction and climbed above ,350. ETH is now showing positive signs and might extend gains toward the ,500 level.
- Ethereum is gaining bullish momentum above the ,350 zone.
- The price is trading above ,320 and the 100-hourly Simple Moving Average.
- There was a break above a key rising channel forming with resistance near ,350 on the hourly chart of ETH/USD (data feed via Kraken).
- The pair might correct lower, but dips could be limited below the ,335 support zone.
Ethereum Price Turns Green
Ethereum price formed a base above the ,220 level and started a decent increase. ETH outperformed Bitcoin and was able to clear a few hurdles near the ,350 level.
There was a break above a key rising channel forming with resistance near ,350 on the hourly chart of ETH/USD. The bulls pumped the pair toward the ,400 level. A high was formed near ,389 and the price is now consolidating gains.
There was a minor decline below the ,365 level. Ether dipped below the 23.6% Fib retracement level of the recent increase from the ,282 swing low to the ,389 high.
Ethereum is now trading above ,320 and the 100-hourly Simple Moving Average. On the upside, the first major resistance is near the ,380 level. The next major resistance is near ,420, above which the price might rise and test the ,485 resistance.
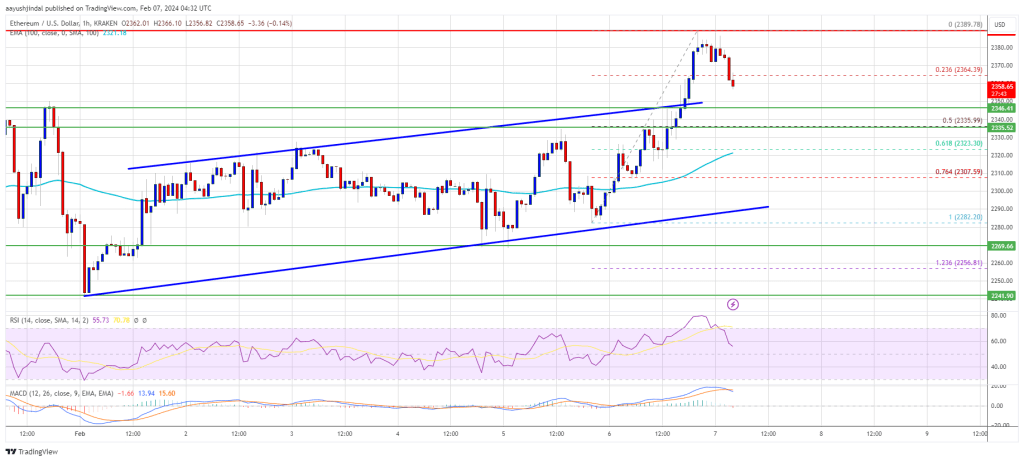
Source: ETHUSD on TradingView.com
If the bulls remain in action, they could even pump the price above the ,550 resistance. In the stated case, the price could rise toward the ,550 level.
Another Drop in ETH?
If Ethereum fails to clear the ,380 resistance, it could start a downside correction. Initial support on the downside is near the ,350 level and the channel trend line.
The next key support could be the ,335 zone or the 50% Fib retracement level of the recent increase from the ,282 swing low to the ,389 high. A clear move below the ,335 support might send the price toward ,250. The main support could be ,220. Any more losses might send the price toward the ,120 level.
Technical Indicators
Hourly MACD – The MACD for ETH/USD is losing momentum in the bullish zone.
Hourly RSI – The RSI for ETH/USD is now above the 50 level.
Major Support Level – ,335
Major Resistance Level – ,380
Solana Faces First Outage of the Year; Engineers Deploy Fix as SOL Dips 3%
The Solana layer one (L1) blockchain is currently experiencing a service disruption, with the Solana Status website revealing that engineers are actively probing the cause. Validators on mainnet have received instructions to implement an upgrade to version 1.17.20 and to initiate a system reboot.
Solana Network Experiences Disruption, Prompting Urgent Upgrade and Reboot
Presently grappling with its first outage of the year, Solana has otherwise maintained a 99.8% operational status over the preceding 90 days, notwithstanding the interruption. This setback is part of a series of disruptions that Solana has encountered in 2020, 2021, and 2022, during which times the blockchain was offline for extended periods, unable to generate blocks.
An initial status update, tagged “mb-020624” on the Solana Status web portal, indicates that the development team is delving into the problem. Additionally, updates regarding the situation have been communicated to the public via the Solana Status X account.
“Engineers from across the ecosystem are readying a new validator software release, which includes a patch to address an issue which caused the cluster to halt,” the Solana Status X account posted. “Validator operators should prepare for an upgrade and restart of the network.” The social media account associated with Solana added:
Mainnet validator operators: release version v1.17.20 is ready — please upgrade and restart.
The operator of the X account further left a Github page with instructions on how to restart. Solana’s native crypto asset SOL dipped more than 3% on the news trading for just over per unit. SOL is the fifth largest crypto asset by market capitalization valued at .12 billion on Feb. 6, 2024.
What do you think about the Solana network outage? Share your thoughts and opinions about this subject in the comments section below.
SOL Price Faces Big Move – Can Bulls Send Solana To $120?
Solana is attempting a fresh increase from the zone. SOL price could gain bullish momentum if it manages to clear the 0 and 4 resistance levels.
- SOL price started a fresh decline from the 6 resistance against the US Dollar.
- The price is now trading above and the 100 simple moving average (4 hours).
- There was a break below a key bullish trend line with support at 0 on the 4-hour chart of the SOL/USD pair (data source from Kraken).
- The pair could start another increase if it surpasses the 0 and 4 levels.
Solana Price Faces Key Test
Solana price started a fresh decline after it struggled to clear the 6 level like Bitcoin at ,800. There was a clear move below the 2 and 0 support levels.
Besides, there was a break below a key bullish trend line with support at 0 on the 4-hour chart of the SOL/USD pair. However, the bulls were active near the level and the 100 simple moving average (4 hours). The price is now attempting a fresh increase above the level.
The price retested the 0 zone and the 50% Fib retracement level of the downward move from the 6.41 swing high to the .95 low. SOL is now trading above and the 100 simple moving average (4 hours).
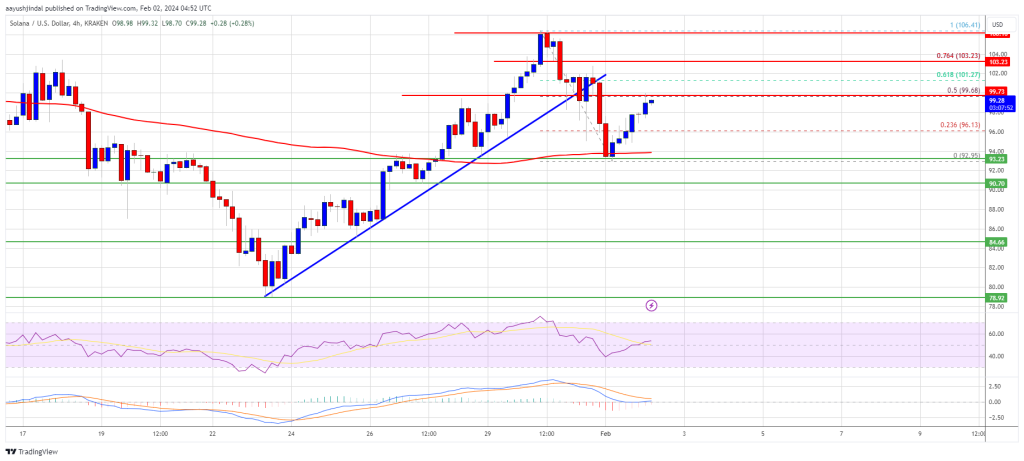
Source: SOLUSD on TradingView.com
Immediate resistance is near the 0 level. The next major resistance is near the 4 level or the 76.4% Fib retracement level of the downward move from the 6.41 swing high to the .95 low. A successful close above the 4 resistance could set the pace for another major increase. The next key resistance is near 2. Any more gains might send the price toward the 0 level.
Another Decline in SOL?
If SOL fails to rally above the 0 resistance, it could start another decline. Initial support on the downside is near the level and the 100 simple moving average (4 hours).
The first major support is near the level, below which the price could test . If there is a close below the support, the price could decline toward the support in the near term.
Technical Indicators
4-Hours MACD – The MACD for SOL/USD is gaining pace in the bullish zone.
4-Hours RSI (Relative Strength Index) – The RSI for SOL/USD is above the 50 level.
Major Support Levels – , and .
Major Resistance Levels – 0, 4, and 2.
‘Quantum Cats’ Launch Faces Technical Glitches, Taproot Wizards Postpones NFT Sale

“Quantum Cats” Bitcoin NFTs was marred by technical issues, forcing the company to postpone the sale. Despite an initially successful minting of nearly 1,000 cats, server overload led to an unexpected delay, causing frustration among eager buyers.
‘Quantum Cats’ Bitcoin NFT Launch Stumbles: Rescheduled Amid Technical Woes
The sale of Taproot Wizards’ first collection of Bitcoin inscriptions, “Quantum Cats,” faced technical difficulties, causing frustration among users and leading to an unforeseen postponement. This setback occurred during the launch of the debut collection, designed to commemorate the Bitcoin improvement proposal known as OP_CAT.
The initial sale, featuring approximately 3,000 digital cats, began with a two-hour “whitelist” window at 17:00 UTC on Monday. However, due to unexpected technical issues, the sale was abruptly pushed to Tuesday. Taproot Wizards, in a statement on social media platform X, attributed the delay to overwhelming demand exceeding server capacity.
Despite the hiccups, the project successfully minted nearly 30% of the cats on Monday, equivalent to roughly 1,000 units, generating an estimated 100 bitcoin (about .3 million). Each cat was priced at 0.1 bitcoin, or ,300, potentially raising up to 300 bitcoin (.9 million) upon complete sale.
The setback marks a rocky start for Taproot Wizards, which previously secured .5 million in a seed funding round last November. The firm’s focus on the burgeoning field of Bitcoin inscriptions, particularly through the Ordinals protocol, has been met with high expectations. Notably, the “Genesis Cat,” the first item in the Quantum Cats series, fetched a remarkable 4,000 at a recent Sotheby’s auction.
Originally, the sale was scheduled to pause for an hour following the two-hour whitelist window before resuming for general public purchase. However, the complications led to a flurry of complaints on the project’s Discord channel.
In response to the mishap, Udi Wertheimer, co-founder of Taproot Wizards, announced a rescheduled minting date, set for Thursday, Feb. 1, at 12pm ET. The revised plan extends the whitelist mint to five hours, concluding at 5pm ET, followed by a one-hour break before the public mint begins at 6pm ET. This adjustment aims to accommodate global time zones and acknowledge the efforts of early risers around the world.
Wertheimer reassured that despite the technical difficulties, all transactions processed on the original minting day were secure, with nearly 1,000 cats minted successfully. He confirmed that all funds and cats are safe, promising that everyone who initiated a transaction would receive a Quantum Cat. The distribution of these cats to wallets is scheduled for the day following the mint, with a dedicated website enabling users to identify their minted cats.
Reflecting on the challenges faced during the mint and the team’s determination to rectify the situation, Wertheimer drew a parallel with the company’s journey. He noted that on Feb. 1, 2023, they mined the first 4MB block on Bitcoin with the first Taproot Wizard, overcoming significant hurdles the night before. Drawing inspiration from this milestone, Wertheimer expressed confidence in delivering Quantum Cats to the world and taking Bitcoin to new heights, despite the current setbacks.
Are you going to try and get a cat in the public mint? Share your thoughts and opinions about this subject in the comments section below.
Ethereum Price Recovery Faces Major Barrier, Can Bulls Overcome Bears?
Ethereum price is attempting a recovery wave above the ,240 zone. ETH could gain bullish momentum if it clears the ,300 resistance zone.
- Ethereum started an upside correction above the ,200 zone.
- The price is trading above ,240 and the 100-hourly Simple Moving Average.
- There was a break above a connecting bearish trend line with resistance near ,265 on the hourly chart of ETH/USD (data feed via Kraken).
- The pair might start a steady increase if it clears the ,300 resistance zone.
Ethereum Price Regains Strength
Ethereum price formed a base and started a recovery wave above the ,220 resistance zone. ETH cleared the ,240 resistance zone like Bitcoin to move into a short-term bullish zone.
However, the bears were active near the ,300 zone. A high was formed at ,307 before there was a pullback. The price declined below the ,280 level. It broke the 23.6% Fib retracement level of the recovery wave from the ,170 swing low to the ,307 low.
The bulls are now active above the ,240 support and the 50% Fib retracement level of the recovery wave from the ,170 swing low to the ,307 low. Recently, there was a break above a connecting bearish trend line with resistance near ,265 on the hourly chart of ETH/USD.
Ethereum is now trading above ,240 and the 100-hourly Simple Moving Average. On the upside, the first major resistance is near the ,280 level. The next major resistance is near ,300, above which the price might rise and test the ,350 resistance.
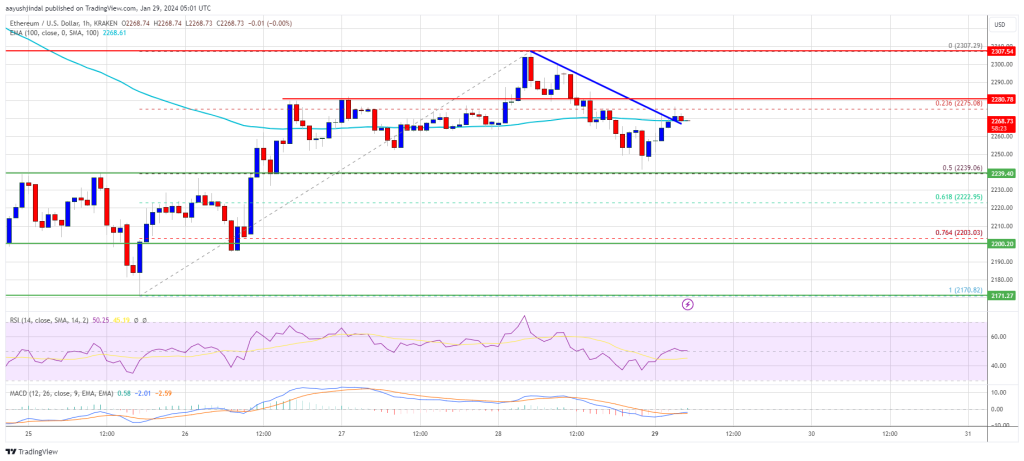
Source: ETHUSD on TradingView.com
If the bulls push the price above the ,350 resistance, they could aim for ,420. A clear move above the ,420 level might start a decent increase. In the stated case, the price could rise toward the ,550 level.
Another Decline in ETH?
If Ethereum fails to clear the ,300 resistance, it could start another decline. Initial support on the downside is near the ,240 level.
The next key support could be the ,220 zone. A daily close below the ,220 support might start another major decline. In the stated case, Ether could test the ,170 support. Any more losses might send the price toward the ,120 level.
Technical Indicators
Hourly MACD – The MACD for ETH/USD is losing momentum in the bullish zone.
Hourly RSI – The RSI for ETH/USD is now above the 50 level.
Major Support Level – ,220
Major Resistance Level – ,300
Ethereum Faces Market Tremors As Celsius Offloads $1 Billion in ETH
Ethereum (ETH) is about witnessing a potential sell-off worth billion. This significant transaction is rooted in actions by Celsius, a bankrupt crypto lender. Reports from on-chain analyst Lookonchain indicate that Celsius initiated the transfer of 459,561 ETH, estimated to be worth around .014 billion, to various exchanges.
The breakdown of this large-scale distribution includes 297,454 ETH (6.5 million) moved to Coinbase Prime, 146,507 ETH to Paxos Treasury, and smaller sums totaling 7,800 ETH (.2 million) sent to FalconX and Coinbase, respectively. Despite this transfer, Lookonchain disclosed that Celsius still maintains a reserve of 62,468 ETH, valued at roughly 9 million.
Celsius transferred 459,561 $ETH(.014B) out 9 hrs ago.
297,454 $ETH(6.5M) → #CoinbasePrime
146,507 $ETH (3.3M) → #PaxosTreasury
7,800 $ETH(.2M) → #FalconX
7,800 $ETH(.2M) → #Coinbase.And #Celsius still has 62,468 $ETH(9M) left.https://t.co/O71a2LfeKg pic.twitter.com/adcxQA3POn
— Lookonchain (@lookonchain) January 26, 2024
This significant transfer carries significant weight in the Ethereum market. It poses a challenge as it exerts considerable pressure on Ethereum’s price, with potential implications for broader market sentiment. Ethereum could see a significant plunge if the .014 billion worth of ETH is sold simultaneously.
Celsius’ Previous Ethereum Transactions
Celsius’ latest Ethereum transactions aren’t isolated events. LookonChain has previously spotted significant transfers linked to Celsius, including a deposit of 13,000 ETH ( million) on Coinbase and 2,200 ETH ( million) to FalconX.
While these moves indicate Celsius’ proactive strategy in managing its financial challenges, they also signal potential volatility for Ethereum’s market value.
Furthermore, Arkham Intelligence reports that between January 8 and January 12, Celsius liquidated over 5 million worth of Ethereum. The primary objective of these sales is to fulfill obligations to creditors.
Dune Analytics also highlighted the pattern of large-scale Ethereum redemptions, noting redemptions exceeding .6 billion. Since last year’s Shanghai update, this figure represents the highest Ethereum redemptions recorded.
As part of its bankruptcy proceedings, Celsius continues liquidating Ethereum holdings to pay off debts.
Ethereum’s Market Reaction
In the aftermath of Celsius’s Ethereum transactions, the asset has seen a nearly 10% decline in value over the past week, dropping from a high above ,600 to around ,186 yesterday. However, Ethereum has slightly recovered, rising by 2.2% in the past 24 hours, with a trading price of ,258 at the time of writing.
Amid these market developments, Michael van de Poppe, a renowned crypto analyst, has identified three key factors that could signal a bullish phase for ETH. A significant element is Bitcoin’s market behavior, often setting the tone for altcoins.
Van de Poppe notes that Bitcoin’s indications of bottoming out usually precede rallies in altcoins, suggesting a potential upturn for Ethereum. He also emphasizes the increasing excitement around spot Ethereum ETFs, which could catalyze Ethereum’s market value in the coming weeks.
Additionally, Ethereum’s impending network upgrades, which aim to reduce transaction costs significantly, are expected to enhance the network’s efficiency and scalability, potentially boosting its market appeal.
The momentum towards $ETH is probably going to come in the next few weeks.
Arguments:
– #Bitcoin bottoming out is a trigger for altcoins to make a new run.
– Ethereum Spot ETF hype.
– Ethereum launching new upgrades to reduce 90% of the costs. pic.twitter.com/N8bDi52F8M— Michaël van de Poppe (@CryptoMichNL) January 25, 2024
Featured image Unsplash, Chart from TradingView
XRP Faces Bearish Pressures Amid Market Downturn: Analysts Divided On Next Move
XRP, the native cryptocurrency of the Ripple network, became a focal point in the face of the recent downturn in the broader market, facing the consequences of breaching a crucial support level and prompting uncertainties regarding its immediate outlook.
In tandem with Bitcoin’s descent below the ,000 mark and Ethereum’s stumble beneath ,200, XRP mirrored the trend, slipping below the pivotal .51 threshold for the first time since January 3.
XRP Vulnerability Sparks Differing Views
This abrupt breakdown laid bare the vulnerability of XRP’s current standing, triggering a wave of speculation about its potential trajectory in the near term.
Amid the market turbulence, analysts have offered a spectrum of conflicting predictions, leaving investors to navigate a complex landscape characterized by mixed signals.
The varying assessments of XRP’s future add an additional layer of uncertainty to an already tumultuous market environment, compelling investors to carefully weigh their options and stay attuned to the dynamic nature of cryptocurrency markets.
JD, a technical analyst, identified a long-term triangular pattern in XRP’s price chart. He predicts a potential further decline towards the lower trendline of this pattern, with the .28-.33 range identified as a potential “buy-the-dip” zone.
#XRP – May be creating “Hidden Bullish Divergence” on weekly (candle body close below red line would negate divergence)
A “wick” down the orange box is very possible. (Orange box been posted since November 2023!)
My personal DCA: 0.28 – 0.33 (HEAVILY!), 0.45, 0.51, 0.59
Don’t… pic.twitter.com/ipMsM0p7ZE
— JD
(@jaydee_757) January 23, 2024
Ali Martinez, a veteran market observer, warned of a potentially steeper descent if XRP fails to hold above .55. Based on his Jan. 18 analysis, a breach of this level could trigger a significant drop, plummeting the token towards the .34 mark.
$XRP is currently grappling to maintain its footing at the crucial .55 support level. Should this support fail to hold, be prepared for a possible sell-off scenario that could see #XRP descending toward .34! pic.twitter.com/6oKObjpnnm
— Ali (@ali_charts) January 18, 2024
Alternatively, XRP Shark, another analyst, presented a more optimistic outlook. While acknowledging the possibility of a drop to the .35-.45 range, XRP Shark sees this as a potential buying opportunity and predicts a subsequent substantial recovery for the token.
Looking to load up a bit on XRP in the coming time between .35-.45
I personally think that will be the bottom area of this move down and a violent move to the upside is following. Invalidation below .30 cents (would be pretty bad to see it go past that level)
— XRP_Shark (@XRP_Shark) January 22, 2024
At the time of writing, XRP was trading at .51, down 0.4% and 9.3% in the last 24 hours and seven days, respectively, according to data from Coingecko.
XRP Faces Critical .51 Threshold
The .51 threshold is one of the most important price zones for XRP because a retreat from this level could push the token below the psychological .50 level.
Despite the varied predictions, one consensus emerges: the short-term outlook for XRP appears bearish. With analysts anticipating further declines if crucial support levels are not held, investors should brace for potential volatility in the immediate future.
However, a closer look reveals glimmers of potential hope. Both XRP Shark and JD anticipate a future rebound for the token, albeit at different price points. This suggests that while the near-term may be turbulent, the longer-term prospects for XRP may not be devoid of promise.
Featured image from Pixabay, chart from TradingView