 Juan Tacuri, a major promoter of the cryptocurrency Ponzi scheme Forcount, later renamed Weltsys, has pleaded guilty to conspiracy to commit wire fraud in the Southern District of New York. The scheme primarily targeted Spanish-speaking communities in the U.S., and Tacuri benefited significantly, amassing millions from his fraudulent activities. Scheduled for sentencing on Sept. 24, […]
Bitcoin News
XRP Price Faces Hurdles: Will It Overcome the Obstacles?
XRP price is slowly moving higher above the .5200 zone. It is now facing hurdles near .5320 and might correct lower in the near term.
- XRP is attempting a fresh increase above the .5250 zone.
- The price is now trading above .5220 and the 100-hourly Simple Moving Average.
- There was a break below a key bullish trend line with support at .5260 on the hourly chart of the XRP/USD pair (data source from Kraken).
- The pair could correct lower toward the .5220 support before the bulls appear again.
XRP Price Gains Traction
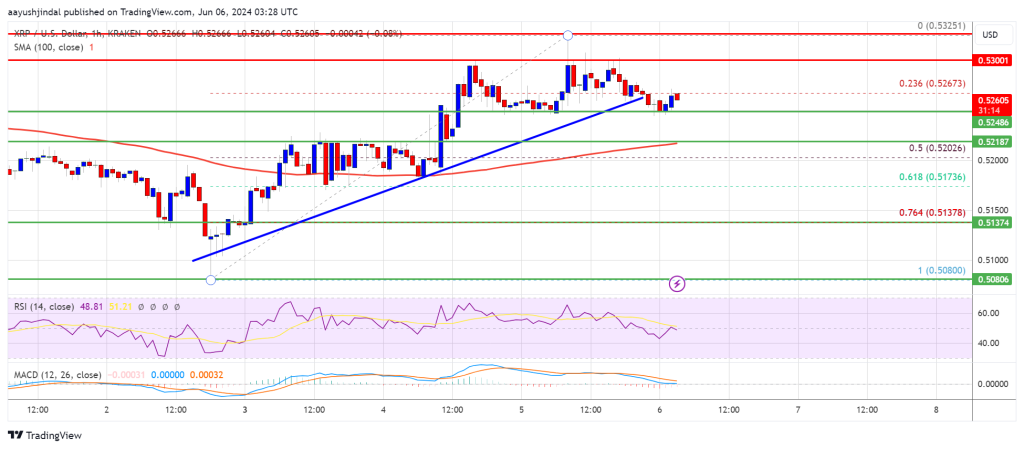
XRP price remained well-supported above the .5120 zone and extended its increase like Bitcoin and Ethereum. The price was able to clear the .5200 and .5250 levels.
There was a clear move above the .5300 resistance and the price tested the .5320 zone. A high was formed at .5325 and the price is now correcting gains. It traded below the 23.6% Fib retracement level of the upward move from the .5080 swing low to the .5325 high.
There was also a break below a key bullish trend line with support at .5260 on the hourly chart of the XRP/USD pair. The pair is now trading above .5220 and the 100-hourly Simple Moving Average.
On the upside, the price is facing resistance near the .5200 level. The first key resistance is near .5320. The next major resistance is near the .5350 level. A close above the .5350 resistance zone could send the price higher. The next key resistance is near .550.
If there is a close above the .550 resistance level, there could be a steady increase toward the .5560 resistance. Any more gains might send the price toward the .5650 resistance.
More Losses?
If XRP fails to clear the .5350 resistance zone, it could continue to move down. Initial support on the downside is near the .5260 level.
The next major support is at .5200 or the 50% Fib retracement level of the upward move from the .5080 swing low to the .5325 high. If there is a downside break and a close below the .520 level, the price might accelerate lower. In the stated case, the price could decline and retest the .5120 support in the near term.
Technical Indicators
Hourly MACD – The MACD for XRP/USD is now losing pace in the bullish zone.
Hourly RSI (Relative Strength Index) – The RSI for XRP/USD is now below the 50 level.
Major Support Levels – .5260 and .5220.
Major Resistance Levels – .5300 and .5320.
Lawyer Pleads Guilty in $9.5M Crypto Ponzi Scheme — Faces 5 Years in Prison
 David Kagel, a disbarred California attorney, pleaded guilty to orchestrating a cryptocurrency Ponzi scheme that defrauded victims of over .5 million. Kagel, 85, promised high returns through artificial intelligence trading bots and falsely claimed to hold million in bitcoin to secure investments. He used his attorney position to instill trust, providing fake letters on […]
Bitcoin News
Ethereum Faces an Uphill Battle: Can It Overcome the Challenges?
Ethereum price extended its decline and tested the ,720 support. ETH is now consolidating and facing many hurdles near the ,800 level.
- Ethereum extended its decline and tested the ,720 zone.
- The price is trading below ,820 and the 100-hourly Simple Moving Average.
- There is a new bearish trend line forming with resistance at ,810 on the hourly chart of ETH/USD (data feed via Kraken).
- The pair could continue to move down if it breaks the ,720 support.
Ethereum Price Holds Support
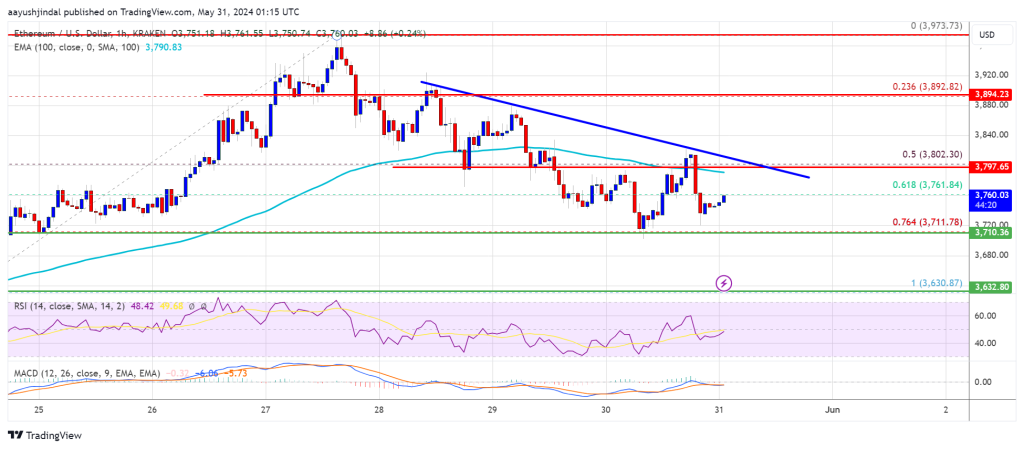
Ethereum price remained in a short-term bearish zone and declined below the ,800 support zone, like Bitcoin. ETH even traded below the 50% Fib retracement level of the upward move from the ,631 swing low to the ,975 high.
However, the bulls were active near the ,720 support zone. They protected the 76.4% Fib retracement level of the upward move from the ,631 swing low to the ,975 high.
Ethereum price is now trading below ,800 and the 100-hourly Simple Moving Average. If there is a fresh increase, ETH might face resistance near the ,800 level. There is also a new bearish trend line forming with resistance at ,810 on the hourly chart of ETH/USD.
The first major resistance is near the ,850 level. An upside break above the ,850 resistance might send the price higher. The next key resistance sits at ,890, above which the price might gain traction and rise toward the ,950 level.
If the bulls push Ether above the ,950 level, the price might rise and test the ,000 resistance. Any more gains could send Ether toward the ,080 resistance zone.
More Losses In ETH?
If Ethereum fails to clear the ,800 resistance, it could continue to move down. Initial support on the downside is near the ,720 level.
The next major support is near the ,640 zone. A clear move below the ,640 support might push the price toward ,550. Any more losses might send the price toward the ,500 level in the near term.
Technical Indicators
Hourly MACD – The MACD for ETH/USD is losing momentum in the bearish zone.
Hourly RSI – The RSI for ETH/USD is now below the 50 zone.
Major Support Level – ,720
Major Resistance Level – ,800
Indian Citizen Faces 20 Years in US Prison for Stealing Crypto in $37M Coinbase Spoofing Scam
 An Indian national has pleaded guilty in the U.S. to wire fraud conspiracy for stealing over million by spoofing crypto exchange Coinbase’s website. He and his co-conspirators created a fake Coinbase Pro site to steal login credentials and two-factor authentication codes, transferring victims’ cryptocurrency to their own wallets. Guilty Plea in M Coinbase Crypto […]
Bitcoin News
Ontario ‘Crypto King’ Faces Major Fraud and Money Laundering Charges
 The Ontario Securities Commission (OSC) announced on May 15 that two Ontario residents have been charged with offenses under the Criminal Code of Canada as part of Project Swan, a joint investigation by the Durham Regional Police Service (DRPS) and the OSC. Aiden Pleterski, self-proclaimed “Crypto King,” is charged with fraud over ,000 and laundering […]
Bitcoin News
Bitfarms Terminates CEO Geoffrey Morphy, Faces $27 Million Lawsuit
 Bitfarms Ltd., a global bitcoin mining company, has announced the immediate termination of Geoffrey Morphy as president and CEO, along with his removal as a director. Following his dismissal, Morphy filed a lawsuit against the company, seeking million in damages for alleged breach of contract and wrongful dismissal. Bitfarms is set to defend against […]
Bitcoin News
XRP Price Faces Uphill Battle: Struggles to Initiate Fresh Upside
XRP price is struggling to clear the .5120 resistance. The price could decline again in the near term if it stays below .5060 and .5120.
- XRP is struggling to gain pace for a move above the .5120 level.
- The price is now trading below .5050 and the 100-hourly Simple Moving Average.
- There is a short-term declining channel forming with resistance at .5040 on the hourly chart of the XRP/USD pair (data source from Kraken).
- The pair could start a decent increase if there is a close above the .5120 resistance.
XRP Price Stuck Near .50
Yesterday, we discussed how XRP price started a recovery wave, like Bitcoin and Ethereum. There was a move above the .4950 and .50 resistance levels.
The price even moved above .5100, but the bears were active near the .5120 resistance. A high was formed at .5120 and the price is now correcting gains. There was a move below the 50% Fib retracement level of the upward move from the .4865 swing low to the .5120 high.
The price is now trading below .5050 and the 100-hourly Simple Moving Average. However, the bulls are active above the 61.8% Fib retracement level of the upward move from the .4865 swing low to the .5120 high.
Immediate resistance is near the .5040 level and the 100-hourly Simple Moving Average. There is also a short-term declining channel forming with resistance at .5040 on the hourly chart of the XRP/USD pair. The first key resistance is near .5060. A close above the .5060 resistance zone could send the price higher.
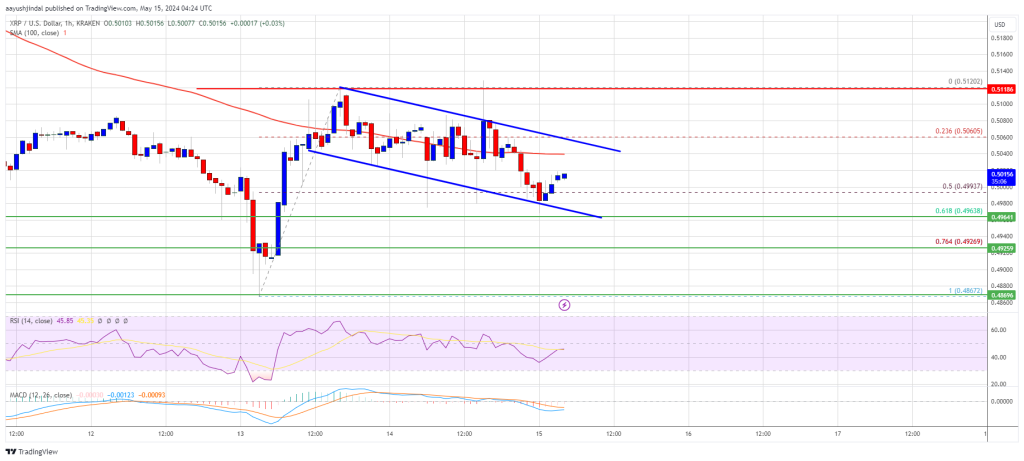
The next key resistance is near .5120. If the bulls remain in action above the .5120 resistance level, there could be a rally toward the .5250 resistance. Any more gains might send the price toward the .5350 resistance.
More Losses?
If XRP fails to clear the .5040 resistance zone, it could continue to move down. Initial support on the downside is near the .4965 level. The next major support is at .4925.
If there is a downside break and a close below the .4925 level, the price might accelerate lower. In the stated case, the price could even drop below the .4865 support zone.
Technical Indicators
Hourly MACD – The MACD for XRP/USD is now losing pace in the bearish zone.
Hourly RSI (Relative Strength Index) – The RSI for XRP/USD is now below the 50 level.
Major Support Levels – .4965 and .4925.
Major Resistance Levels – .5040 and .5120.
Coinbase Faces System Wide Outage, Affirms Funds Are Safe
 Coinbase, one of the largest U.S.-based cryptocurrency exchanges, reported a system-wide outage in its services, affecting customers’ crypto operations. On its status site, Coinbase stated that it was aware that “some users may experience failures when sending crypto or withdrawing fiat,” and declared it was working to fix this issue. Later, the exchange recognized experiencing […]
Bitcoin News
BNB Price Faces Crucial Test: Will $600 Withstand the Pressure?
BNB price is attempting a fresh increase from the 0 zone. The price must settle above the 0 resistance to gain bullish momentum.
- BNB price started a fresh increase after it cleared the 5 resistance zone.
- The price is now trading above 0 and the 100 simple moving average (4 hours).
- There is a key bullish trend line forming with support at 2 on the 4-hour chart of the BNB/USD pair (data source from Binance).
- The pair could gain bullish momentum if it clears the 2-0 resistance zone.
BNB Price Holds Support
After forming a base above the 5 level, BNB price started a fresh increase. There was a steady increase above the 5 and 5 resistance levels, like Ethereum and Bitcoin.
The bulls pushed the price above the 0 pivot level and the 61.8% Fib retracement level of the downward move from the 8 swing high to the 82 low. It is now trading above 0 and the 100 simple moving average (4 hours).
There is also a key bullish trend line forming with support at 2 on the 4-hour chart of the BNB/USD pair. The pair seems to be consolidating near the 76.4% Fib retracement level of the downward move from the 8 swing high to the 82 low.
Immediate resistance is near the 2 level. The next resistance sits near the 8 level. A clear move above the 8 zone could send the price further higher.
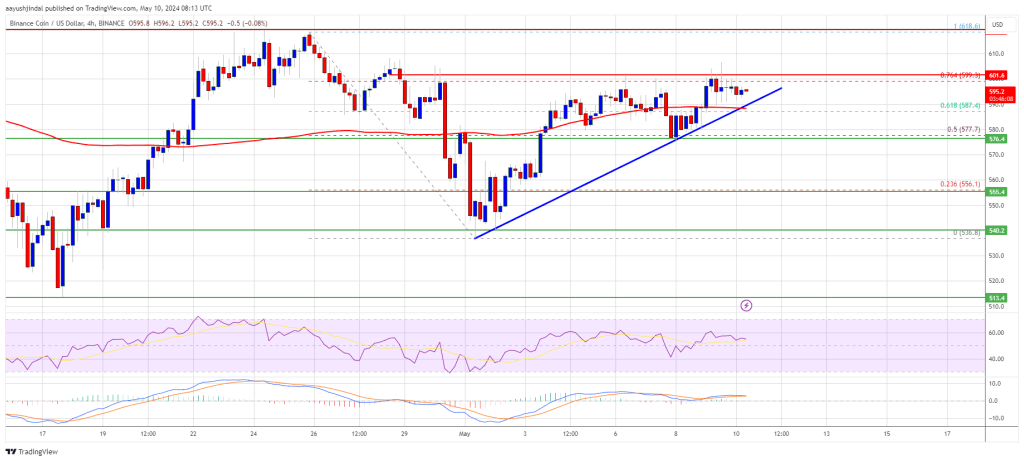
Source: BNBUSD on TradingView.com
In the stated case, BNB price could test 5. A close above the 5 resistance might set the pace for a larger increase toward the 0 resistance. Any more gains might call for a test of the 0 level in the coming days.
Are Dips Supported?
If BNB fails to clear the 2 resistance, it could start a downside correction. Initial support on the downside is near the 2 level and the trend line.
The next major support is near the 8 level. The main support sits at 5. If there is a downside break below the 5 support, the price could drop toward the 0 support. Any more losses could initiate a larger decline toward the 0 level.
Technical Indicators
4-Hours MACD – The MACD for BNB/USD is gaining pace in the bullish zone.
4-Hours RSI (Relative Strength Index) – The RSI for BNB/USD is currently above the 50 level.
Major Support Levels – 2, 8, and 5.
Major Resistance Levels – 2, 8, and 0.