Key Highlights
- ADA price failed to stay above the .0760 support and extended losses against the US Dollar (tethered).
- There was a break below a key bullish trend line with support at .0760 on the hourly chart of the ADA/USD pair (data feed via Bittrex).
- The pair may perhaps continue to move down towards the .0730 or .0720 support.
Cardano price is slowly moving lower against the US Dollar and Bitcoin. ADA/USD could accelerate declines towards the .0720 support in the near term.
Cardano Price Analysis
Recently, cardano price settled below the .0800 support level against the US Dollar. It resulted in a fresh decline and the ADA/USD pair declined below the .0780 support and the 100 hourly simple moving average. During the decline, the price traded below the 50% Fibonacci retracement level of the last major wave from the .0703 low to .0820 high.
More importantly, there was a break below a key bullish trend line with support at .0760 on the hourly chart of the ADA/USD pair. The pair settled below the .0760 support, which is a short term bearish sign. The next support is near the .0730 level. It represents the 76.4% Fibonacci retracement level of the last major wave from the .0703 low to .0820 high. Below .0730, the price will most likely decline towards the .0720 support area. If there is an upside correction, the .0760 level and the 100 hourly SMA are likely to act as hurdles. Above the .0760 resistance, the price may resume its upward move.
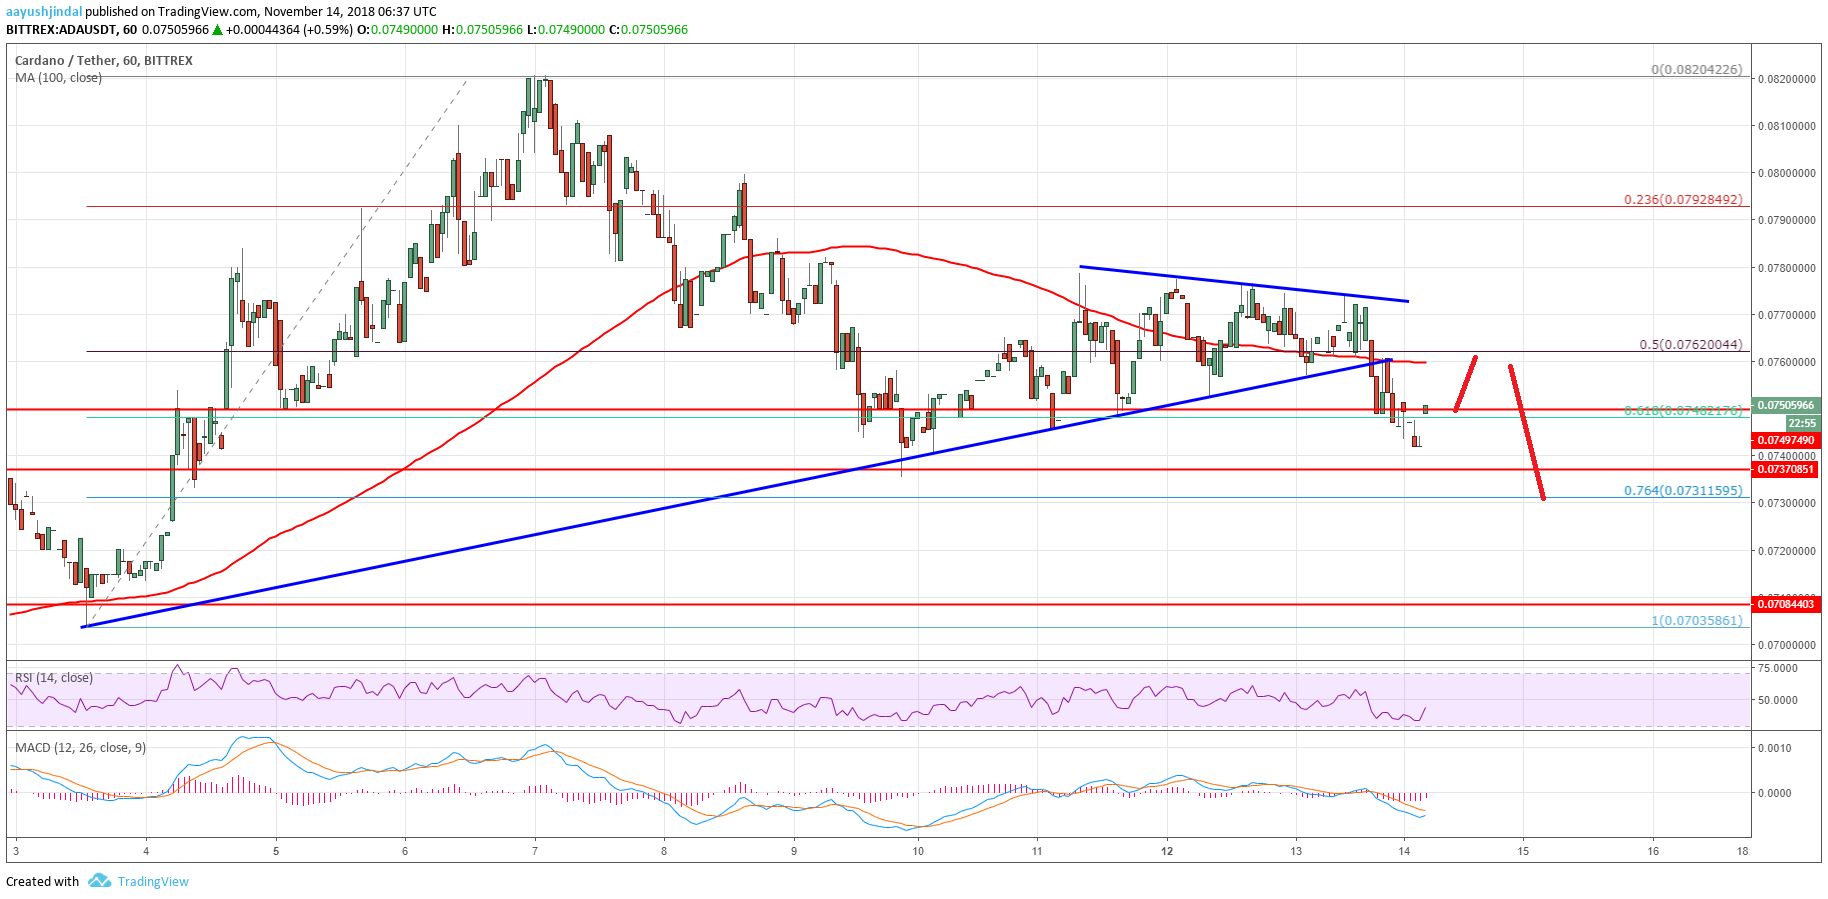
The chart indicates that ADA price moved into a short term bearish zone below the .0760 support and the 100 hourly SMA. If buyers struggle to push the price back above .0760 and .0762, there could be more losses towards .0720.
Hourly MACD – The MACD for ADA/USD is placed heavily in the bearish zone.
Hourly RSI – The RSI for ADA/USD is currently attempting a recovery from the 30 level.
Major Support Level – .0720
Major Resistance Level – .0762
The post Cardano Price Analysis: ADA/USD Could Extend Declines To .072 appeared first on NewsBTC.


