Key Highlights
- Ethereum classic price declined further and even broke .00 against the US dollar.
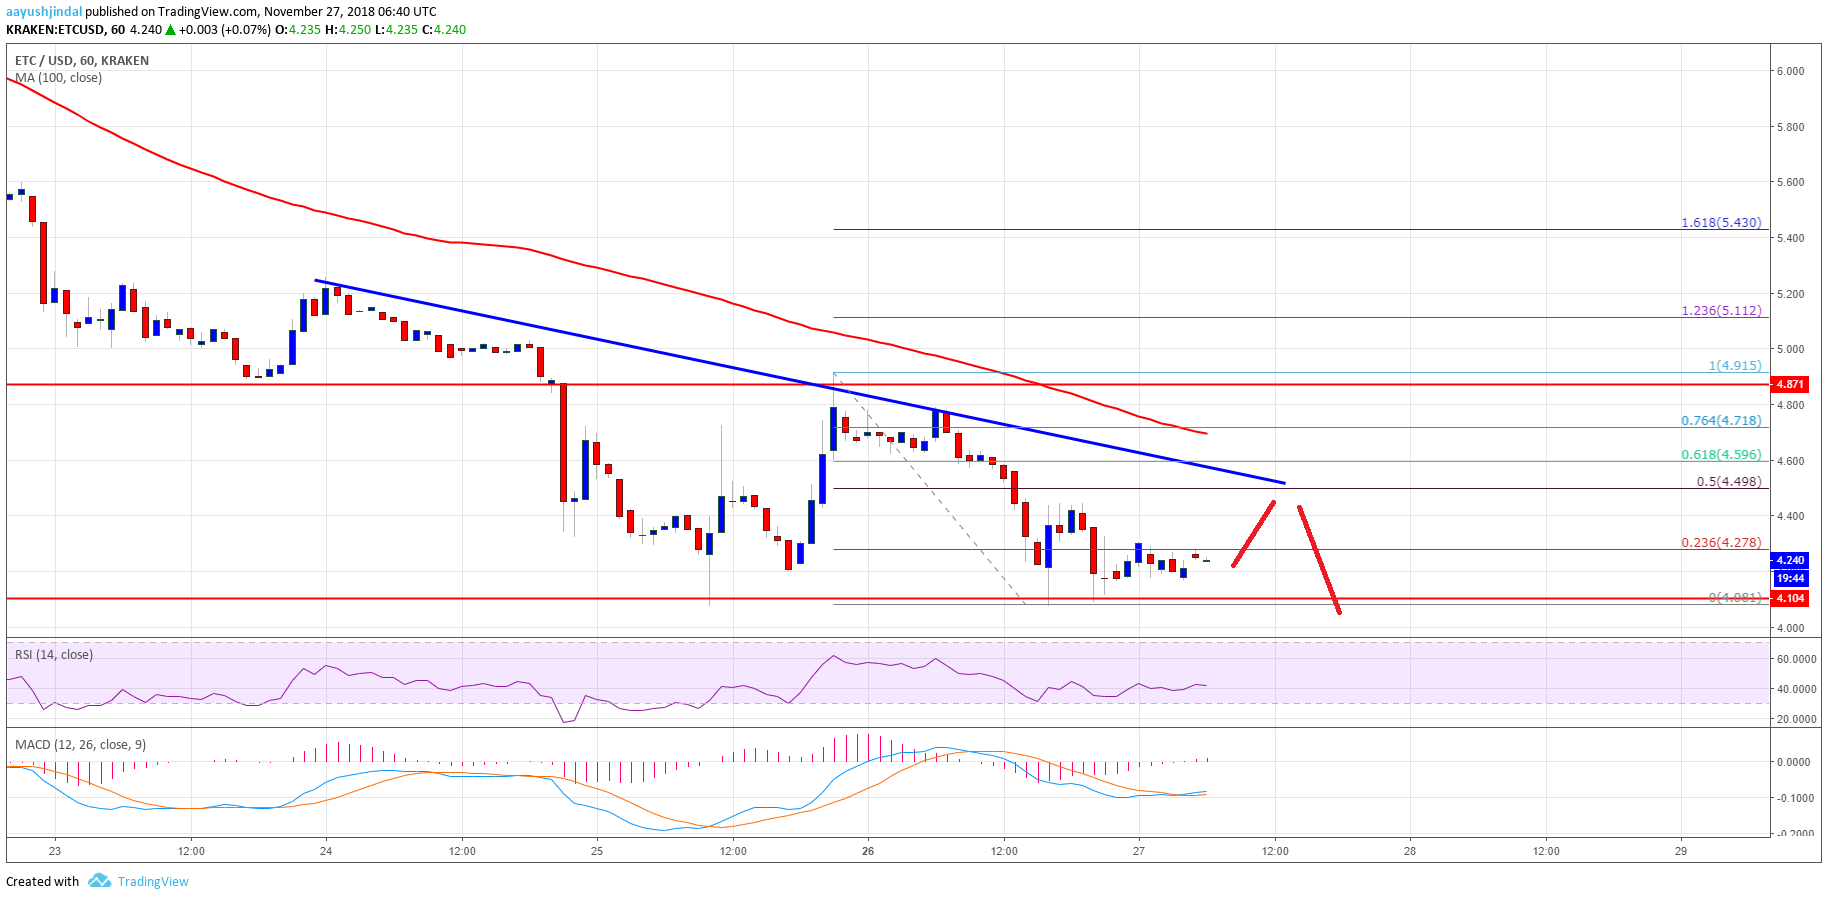
- There is a key bearish trend line formed with resistance at .10 on the hourly chart of the ETC/USD pair (Data feed via Kraken).
- The pair is likely to find sellers near .10, .20 and .40 if there is an upside correction.
Ethereum classic price extended losses against the US Dollar and Bitcoin. ETC/USD remains sell on rallies if there is a recovery towards the .40 level.
Ethereum Classic Price Analysis
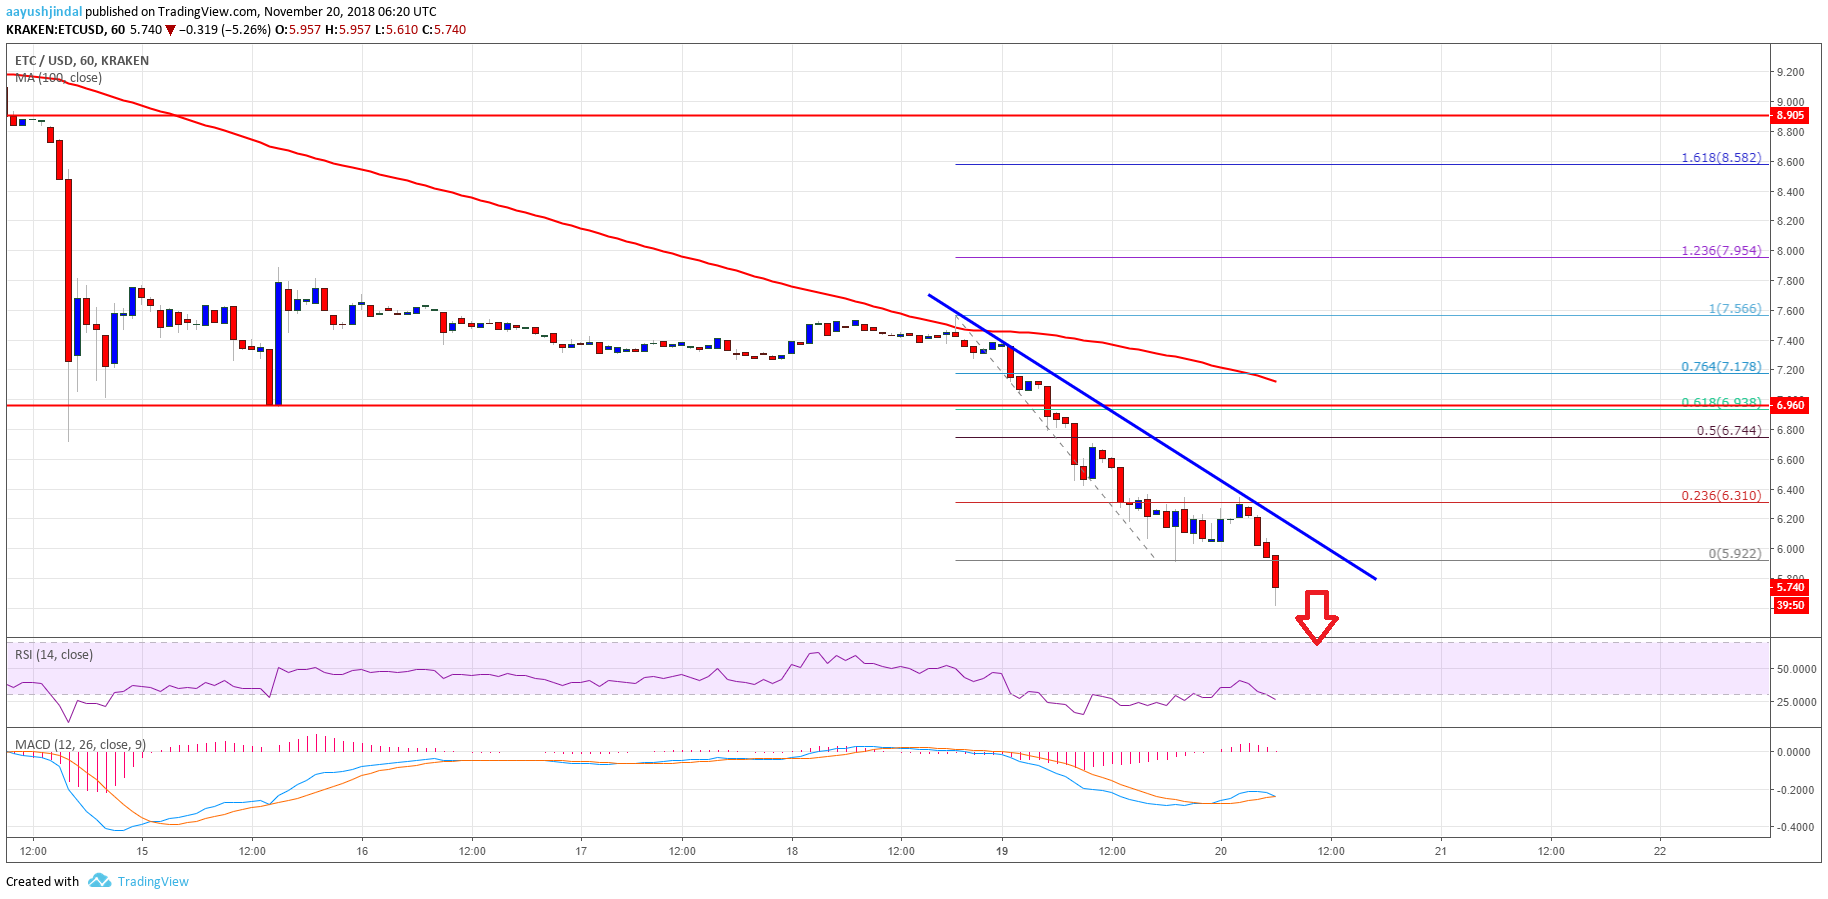
In the last analysis, we discussed that ETC price could revisit the .00 level against the US dollar. The ETC/USD pair did trade lower and broke the .50 and .25 support levels. The price settled below the .40 support and the 100 hourly simple moving average. There decline was such that the price even broke the .00 support level. A new yearly low was formed at .91 and the price remains in a bearish zone.
An initial resistance is near the 23.6% Fib retracement level of the recent decline from the .71 high to .91 low. Moreover, there is a key bearish trend line formed with resistance at .10 on the hourly chart of the ETC/USD pair. If there is a break above the trend line, the price could trade towards the .40 resistance. An intermediate resistance is the 50% Fib retracement level of the recent decline from the .71 high to .91 low. If there is an upside correction above .10 or .20, the price could face a strong selling interest near the .40 level.
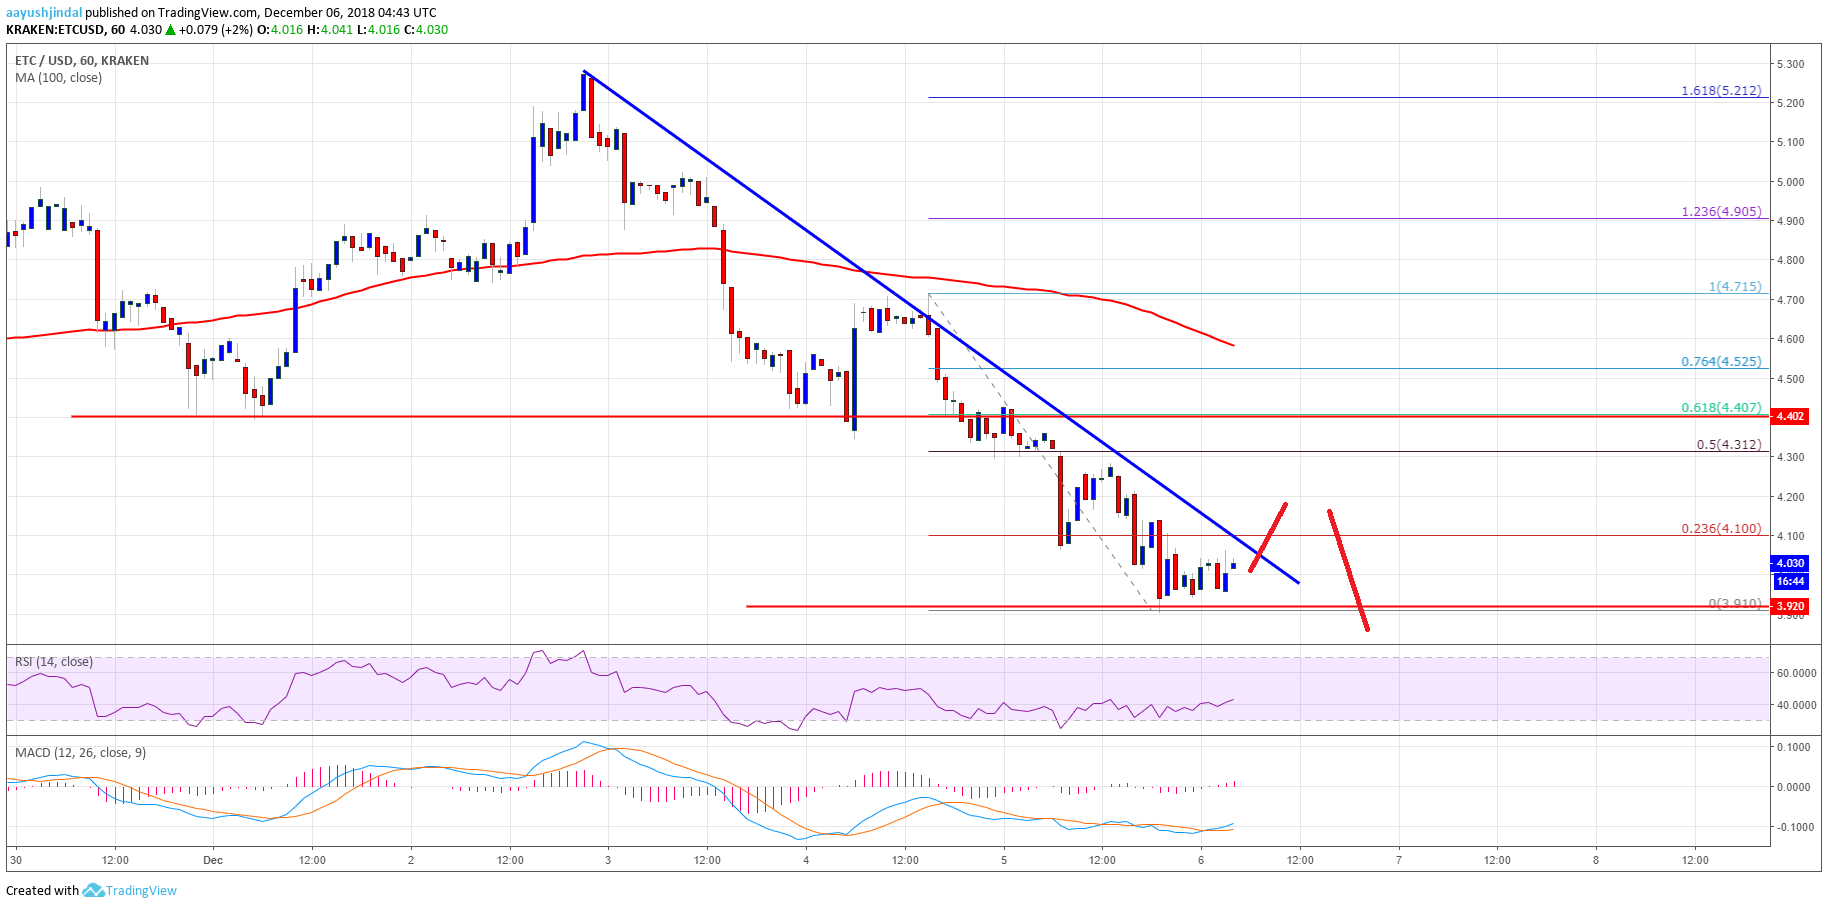
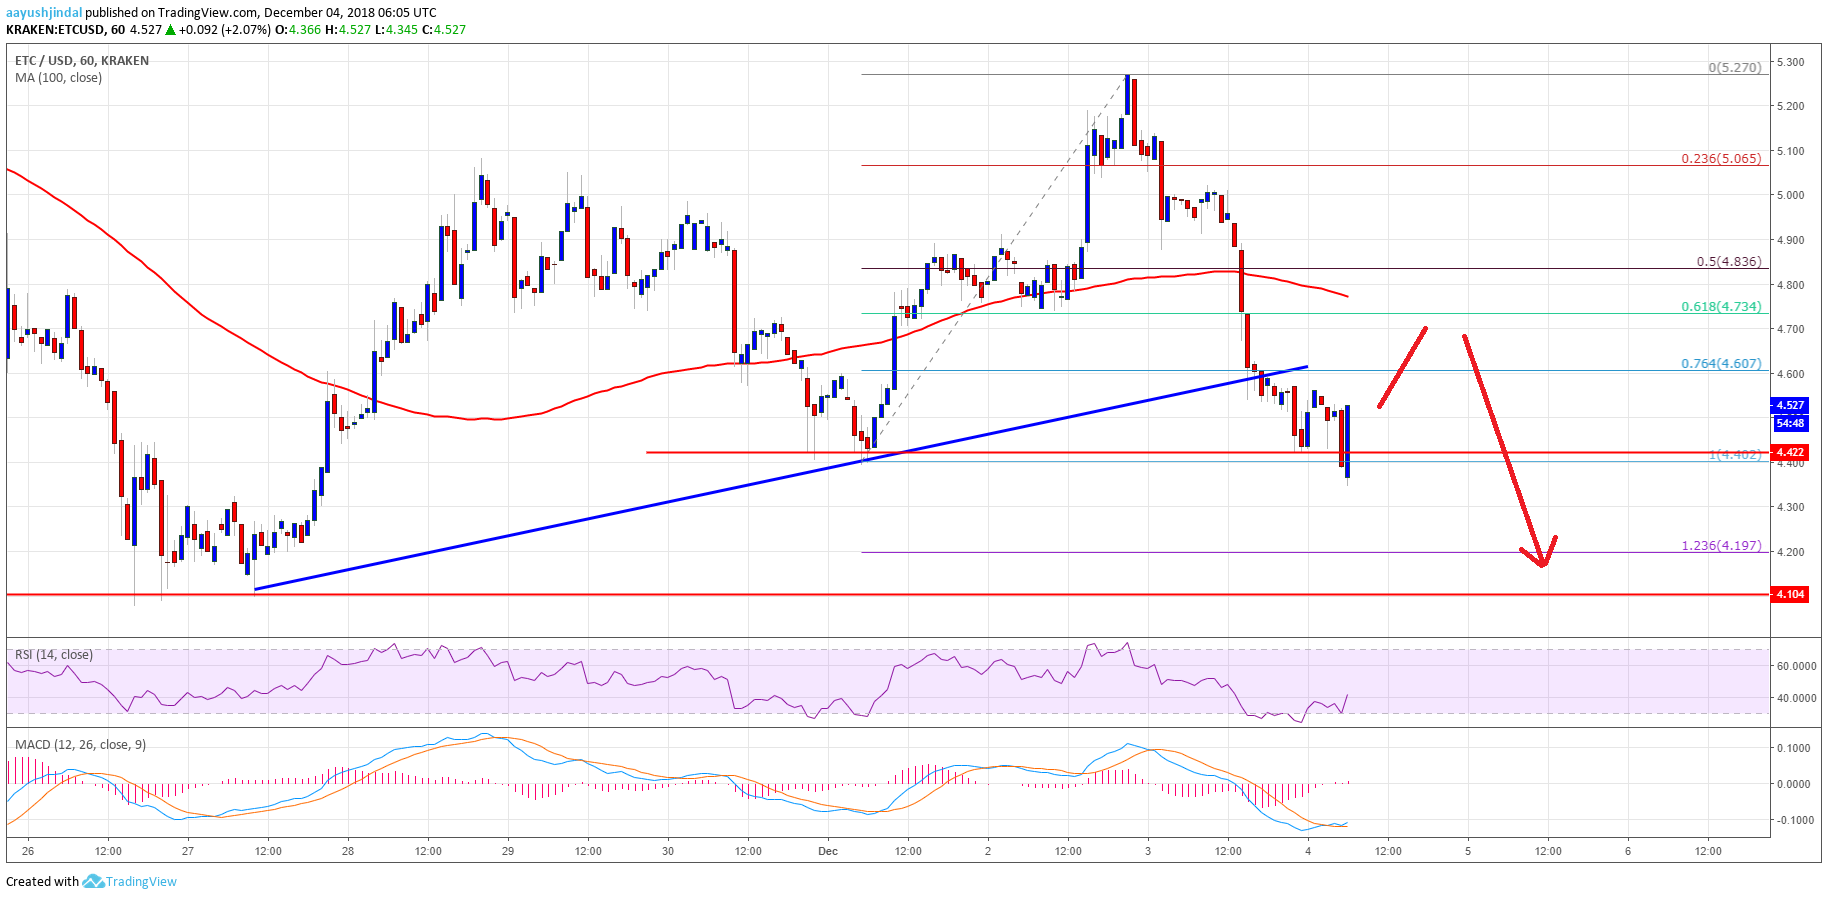
The chart suggests that ETC price is faced an increased selling pressure below .40. After a short term correction, the price is likely to resume its decline below the .00 and .90 levels.
Hourly MACD – The MACD for ETC/USD is currently slightly placed in the bullish zone.
Hourly RSI – The RSI for ETC/USD is slowly moving higher towards the 50 level.
Major Support Level – .00
Major Resistance Level – .40
The post Ethereum Classic Price Analysis: ETC/USD Remains Sell Near .40 appeared first on NewsBTC.