As ABN AMRO drops its exploration of a crypto wallet product, the Dutch bank says it’s seeking to launch a blockchain platform for trade inventory.
CryptScout #BitFeed RSS – Bitcoin and Cryptocurrency News 24/7
Despite Dropping, Ethereum (ETH) is Bullish and May Even Be a Store of Value
- Ethereum (ETH) prices drop 5.5 percent from 0
- The development of Ethereum 2.0 will reinforce ETH
Despite competition and the threats of Binance Chain, Ethereum will leverage on their first mover advantage as a time-tested platform and recover. Besides, the promise of Ethereum 2.0 and implementation of EIP 1234 means scarcity and ETH holders would be the primary beneficiaries.
Ethereum Price Analysis
Fundamentals
That Ethereum is enjoying a first-mover advantage in a field that is already crowding with competitors offering faster and cheaper alternatives is correct. Entrants like Tron, EOS and now Binance Chain may prove too “speedy or scalable” for a platform that is already grappling with scalability and dApps shifting camps thanks to VMs that are compatible with open source Ethereum.
Although plans are there to increase the throughput of the network via Shasper for example, similar platforms as Tron and EOS are operating with irresistible offers as well as a scalable network though with a tinge of centralization thanks to consensus algorithm deployed.
Even so, there is hope, and as Ethereum seek to migrate from a proof-of-work to a proof-of-stake system, the activation of Constantinople was at the back of consensus that mining rewards would fall from three to two in readiness of a freeze that will not only see rewards decrease but inflation drop to 0.5 percent during Serenity.
In the short-term, this may disadvantage or even dis-incentivize miners, but in the long-term, odds are, Ethereum (ETH) prices could soar thanks to scarcity—both in rewards and inflation, better placing the second most valuable coin as a perfect store of value with smart contracting capabilities, better than Bitcoin.
1/ Why ETH is positioned to be a Store of Value (SoV)
It’s been said that ETH attracted temporary reservation demand and hoarding because investors needed a store of ETH to participate in the many ICO’s in 2017, but now that demand has dried up, dropping the price of ETH 90%.
— James Spediacci ⟠ (@JamesSpediacci) March 17, 2019

Candlestick Arrangements
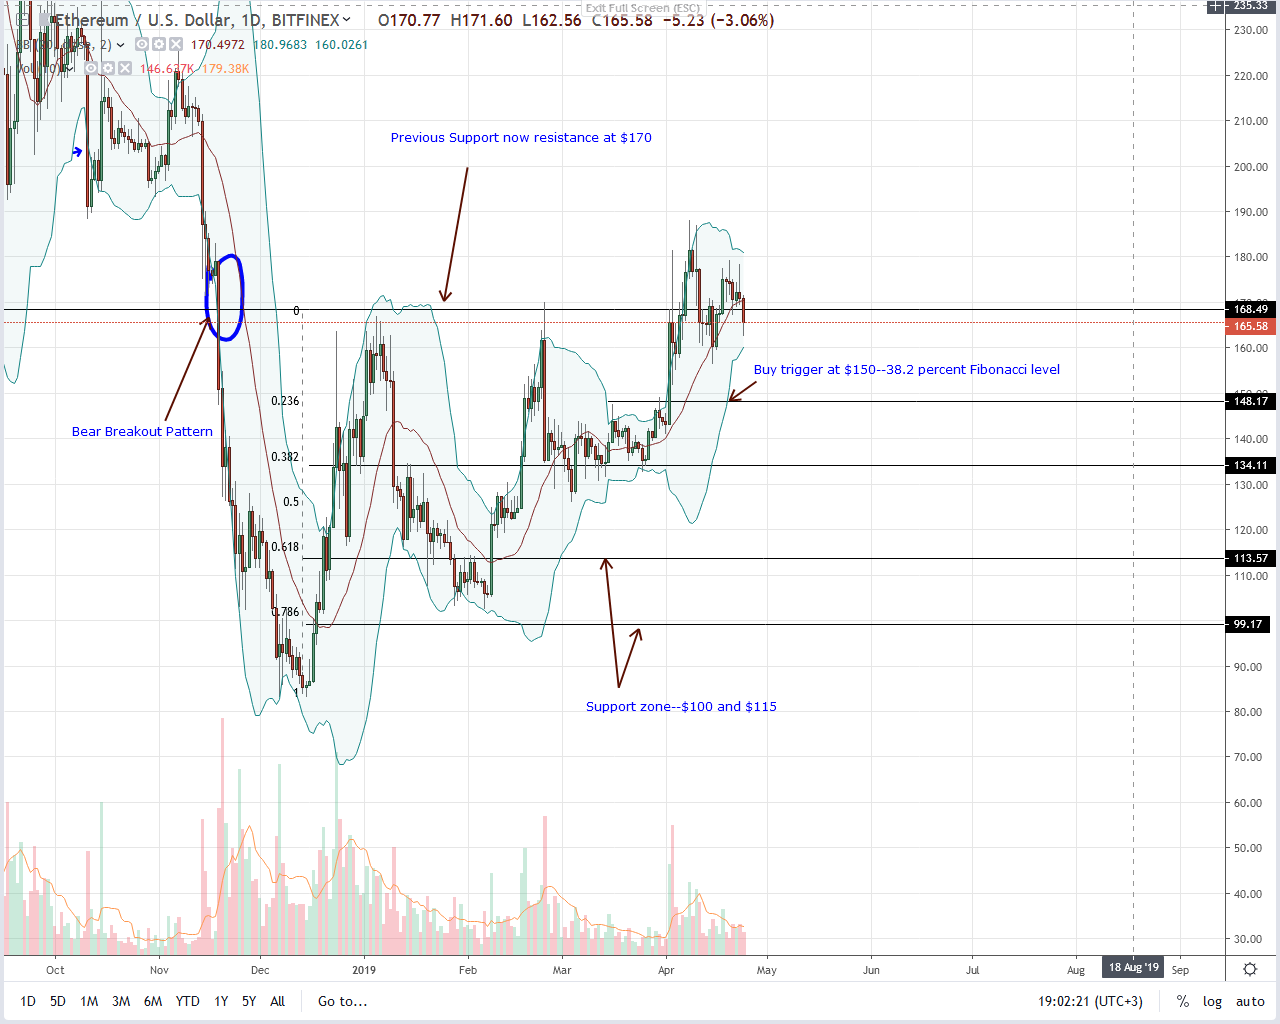
Changing hands at 5 with a market cap of ,372 million, Ethereum (ETH) is under pressure and cracking. It is down 5.5 percent in the last 24 hours. Even so, it is not as positive despite the coin trading within a bullish breakout pattern.
First, it is clear that sellers of Apr-11 are in control. That is so because, from an effort versus result point of view, buyers didn’t fully reverse losses of Apr-11. Besides, although trending above 0 in a bullish breakout pattern, accompanying volumes were low and prices didn’t rally above 0 confirming buyers of Apr-2 setting in motion the next wave of higher high propelling prices towards 0 as laid out in our last ETH/USD trade plan.
Even so, any drop below Apr-15 lows at 5 could see ETH collapse back to 5 or Apr-2 lows in a retest before trend resumption.
Technical Indicators
Average volumes stand at 181k in a bullish breakout pattern. Ideally, ETH buyers would be back in control if prices edge past 0 with high volumes exceeding 575k of Apr-2 or even Feb-24 at 880k in a bullish breakout pattern that will trigger participation as prices rally to 0.
Chart courtesy of Trading View
The post Despite Dropping, Ethereum (ETH) is Bullish and May Even Be a Store of Value appeared first on NewsBTC.
Will Ripple (XRP) Bulls of Jan 30 Flow Back and Prop Dropping Prices?
- Ripple prices down 5.2 percent
- TaoTao exchange launching in mid-May and supports Ripple (XRP)
- Transaction volumes low but as prices retest main support, participation may spike
After pressure from the community, CMC is listening to feedback and may adjust their methodology so that investors can have a fuller image of asset prices. At the same time, Yahoo backed TaoTao exchange will launch in mid-may and Ripple (XRP)-whose prices are down 5.2 percent, is available for trading.
Ripple Price Analysis
Fundamentals
Four months after a disastrous exposure that saw Coincheck lose 0 million worth of NEM; news began doing rounds that Yahoo was planning on investing million for a 40 percent stake at BitARG, now TaoTao. Through a subsidiary, Nikkei Asian Review reported that the “purchase of BitARG shares would be made through Tokyo’s YJFX, a wholly owned Yahoo subsidiary that operates foreign exchange transaction services” and the exchange planned to “service operation and security expertise of the Yahoo Japan Group.”
Close to a year later and the exchange is launching, and aside from Ripple (XRP), TaoTao accepts other liquid coins including Bitcoin and Litecoin. The exchange will launch in mid-may, but pre-registration is on-going and ends on April 17.
In other news, CoinMarketCap is listening to their users’ feedback, and to prevent a fuller picture of crypto assets, the asset price tracker which recently added two crypto indices will “work hard and add a suite of new metrics.”
To that end, Carylyne Chan, CMC’s head of Marketing said there would be changes in their methodology. That includes “plans to include liquidity measures, hot and cold wallet balances and traffic data for listed exchanges” so as “to provide as much information as possible to our users so that they can form their conclusions and interpretations.”
Candlestick Arrangement
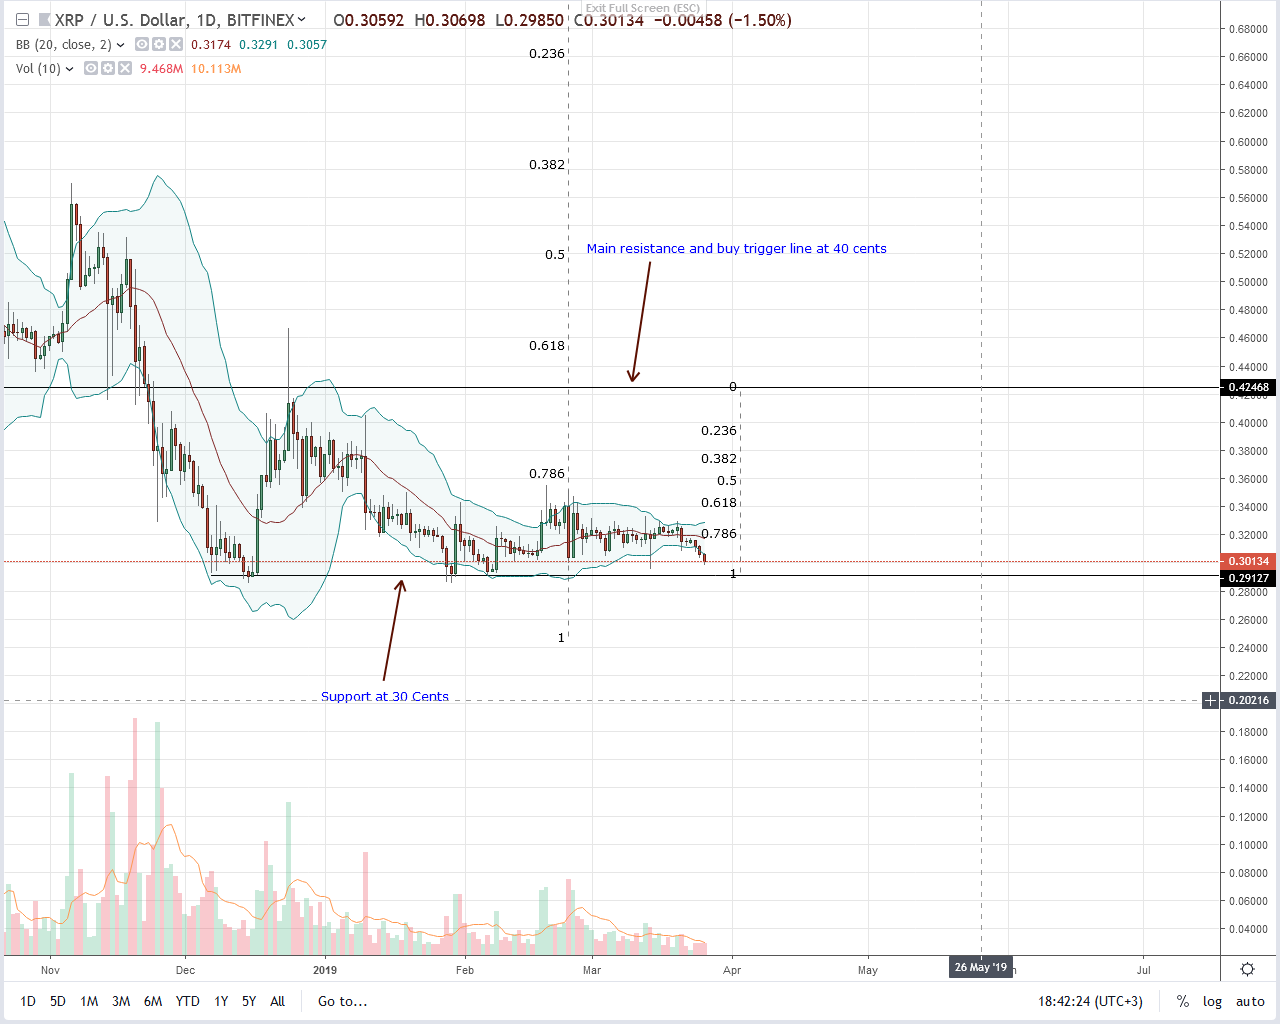
Sellers are stepping up and pressing the gas pedal. Ripple (XRP) is down 5.2 percent from last week’s low, and bear momentum is increasing. As visible from the chart, odds are prices will break lower nullifying our bullish stand as XRP trickle below 30 cents—our first level of support.
That means bears of Feb 24 will be back in contention, but unless otherwise there is a substantial break below Jan 30 lows, we shall retain a neutral—and even bullish outlook.
Note that on more than two occasions, Ripple prices have found strong support at this level and the same may print out along this support zone since we are bullish, expecting bulls of late Sep 2018 to flow back.
Technical Indicators
Any drop below Q1 2019 lows must be with high volumes above 61 million of Feb 24. If not and prices find support, then high participation will mark underlying demand and a possible resumption of buy pressure. Otherwise, wide price ranges below Jan 30 lows must have high participation spike as aforementioned.
Chart courtesy of Trading View
The post Will Ripple (XRP) Bulls of Jan 30 Flow Back and Prop Dropping Prices? appeared first on NewsBTC.
Analysts Expect Bitcoin (BTC) to Climb Higher Before Hitting Resistance and Dropping
Following the crypto market’s quiet weekend trading session, most cryptocurrencies have continued to trade flat, and have thus far maintained nearly all of their recent price gains that were incurred during Friday’s market surge. Bitcoin (BTC) has found stability in the mid-,600 region and appears to be forming ,700 as a level of resistance.
Multiple analysts now expect Bitcoin to form another upwards leg before hitting a strong resistance level, which is unlikely to be swiftly broken above unless the cryptocurrency’s bulls garner a significant amount of buying pressure.
Bitcoin Stable Around ,650, Analysts Bearish on Larger Time Frames
At the time of writing, Bitcoin is trading down marginally at its current price of ,645. Over the weekend, BTC rose to highs of nearly ,700 before swiftly being pushed down towards its current price levels. This signals that ,700 may be a level of relative resistance for the cryptocurrency in the short-term.
In a recent tweet from Mayne, a popular cryptocurrency analyst, he explained that he is still bearish on BTC over high time frames despite Friday’s upwards surge that sent it from lows of ,400 to highs of ,700.
“$BTC…I’m still leaning bearish on the HTF… I think if we make another leg up we top out in the grey zone… If we make a higher high, great, I’ll be bullish. Don’t let your ego or some neckbeard on CT yelling “REKT” stop you from moving with price… Just focus on the chart,” he explained.
I'm still leaning bearish on the HTF.
I think if we make another leg up we top out in the grey zone.
If we make a higher high, great, I'll be bullish. Don't let your ego or some neckbeard on CT yelling "REKT" stop you from moving with price.
Just focus on the chart. pic.twitter.com/YhfpN9HSwb
— Mayne (@Tradermayne) February 11, 2019
Nigel Green, the CEO of the UK-based deVere Group, recently shared a similar sentiment to Mayne while speaking to MarketWatch, noting that Bitcoin has still yet to break above its strong resistance level at ,000.
“It was a relatively sudden jump, and, of course, positive news for those holding bitcoin. However, the price only reached the top of the trading range and investors should not be popping champagne corks just yet,” Green explained.

Although the market’s recent price climb was certainly positive for investors, analysts are still leaning bearish on BTC.
Analyst: Bitcoin Likely to Drop After Climbing Higher
In line with the aforementioned analyst’s bearish assessment of Bitcoin, DonAlt, another popular cryptocurrency trader on Twitter, recently spoke about where he sees Bitcoin heading in the near future, noting that he expects BTC to climb above its previous high in the mid-,700 range before dropping further.
“$BTC daily update: Stopped dead in its tracks… I think for a dump to happen we need to take out the previous high first… If that happens and we get a high momentum dump into the breakout I’ll be shorting to the green line… If we break upwards I’ll long the S/R flip at red.”
$BTC daily update:
Stopped dead in its tracks.
I think for a dump to happen we need to take out the previous high first.
If that happens and we get a high momentum dump into the breakout I'll be shorting to the green line.
If we break upwards I'll long the S/R flip at red. pic.twitter.com/FwkVKB1ZZc— DonAlt (@CryptoDonAlt) February 10, 2019
As the week continues on it is likely that the market’s volatility will gradually begin to increase, which will give investors and traders alike greater insight into which direction the markets are heading next.
Featured image from Shutterstock.
The post Analysts Expect Bitcoin (BTC) to Climb Higher Before Hitting Resistance and Dropping appeared first on NewsBTC.
Ethereum Price Analysis: ETH/USD Price Risk Dropping Below $100
Latest Ethereum News
To mark the 558th of “Dies Academicus”, the University of Basel–which is one of the oldest universities in the world boosting alumni as Leonhard Euler, Daniel Bernoulli and Friedrich Miescher did award the co-Founder of Ethereum, Vitalik Buterin, with a Honorary Doctorate in Economics for “his contribution to promoting decentralization and equal participation in the digital revolution, as well as for his services on cryptocurrencies, smart contracts, and institutional design”.
Read: McAfee Unfazed After SEC Says Promoting ICO Without Disclosing Pay is Fraud
The Department of economics and Business recognize the impact of Vitalik’s contribution in the advancement of blockchain and the crypto industry. The 24 year old co-founder of Ethereum—the world’s first smart contracting platform–has published several scientifically sound papers without a university degree after dropping out of the University of Waterloo at 20 years old to pursue his blockchain passions.
Also Read: CoinBase COO: Crypto is Enabling the Creation of Internet 3.0
He went on to receive 0,000 under the Thiel Fellowship and two years later he went on to create Ethereum—a dApp building and a smart contracting platform where projects can create censorship resistant apps while projects can crowd fund from all and sundry without the need of tedious paperwork.
ETH/USD Price Analysis
Weekly Chart
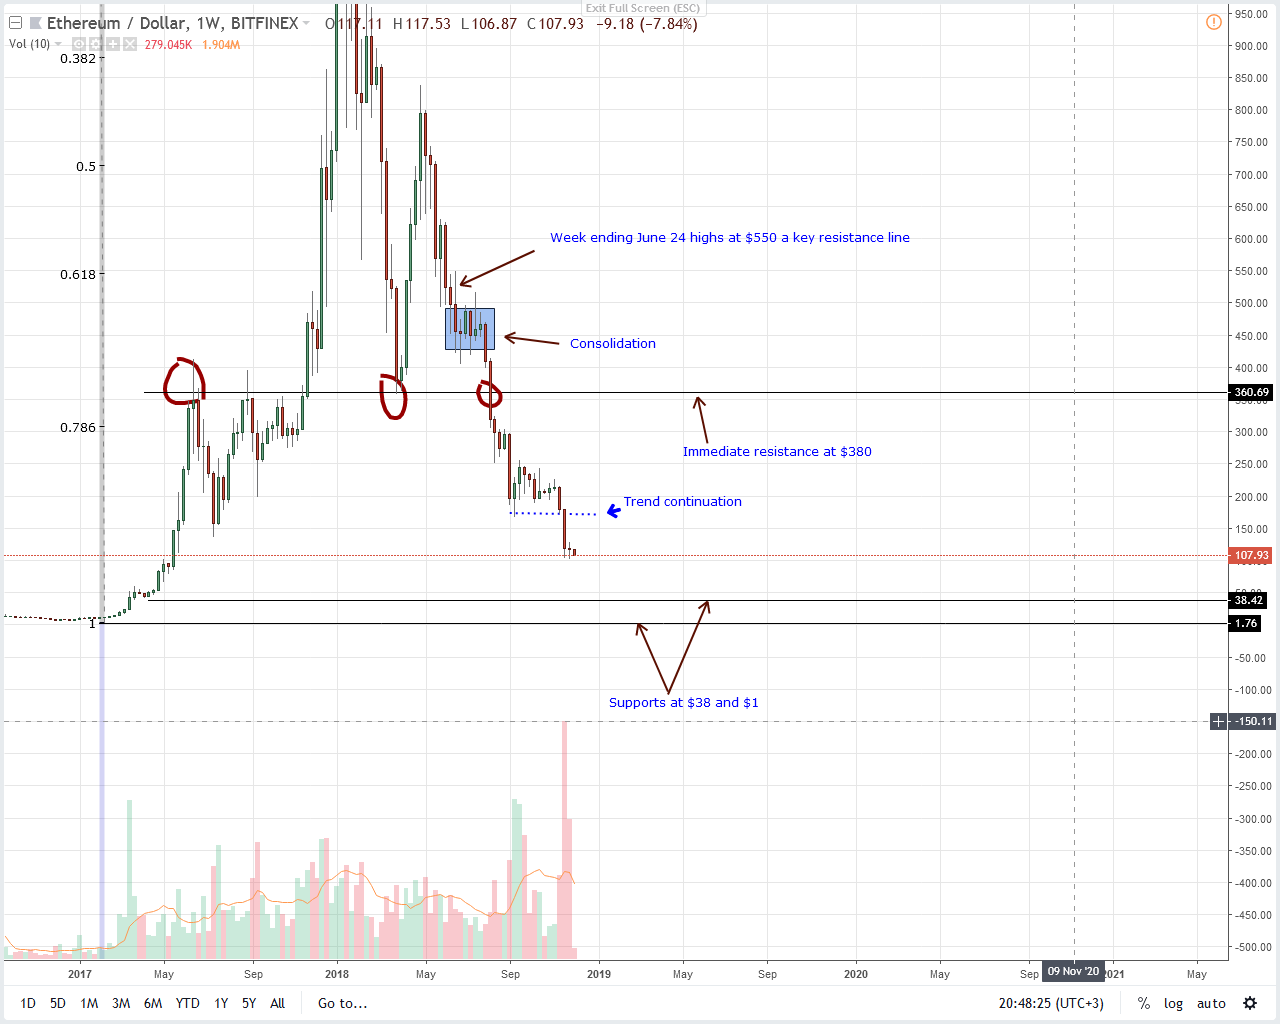
At third, ETH/USD is still liquid though it is down 8.5 percent in the last week and down seven percent in the last day. As expected, the path of least resistance is clear mostly because of that whole bear bar that not only confirmed the bear breakout pattern set in motion by declines of early August but closed below 0 hinting of underlying bear momentum.
As stated in our previous ETH/USD price analysis, all we need are strong gains above 0 and 0 before we can confidently fade the current bear momentum and aim for 0 and later 0. From candlestick arrangement, it’s clear that bear momentum is strong and odds are we might see breaks below psychological 0.
If that undesirable meltdown prints, then we expect ETH to capitulate to and in worst case scenario to .
Daily Chart
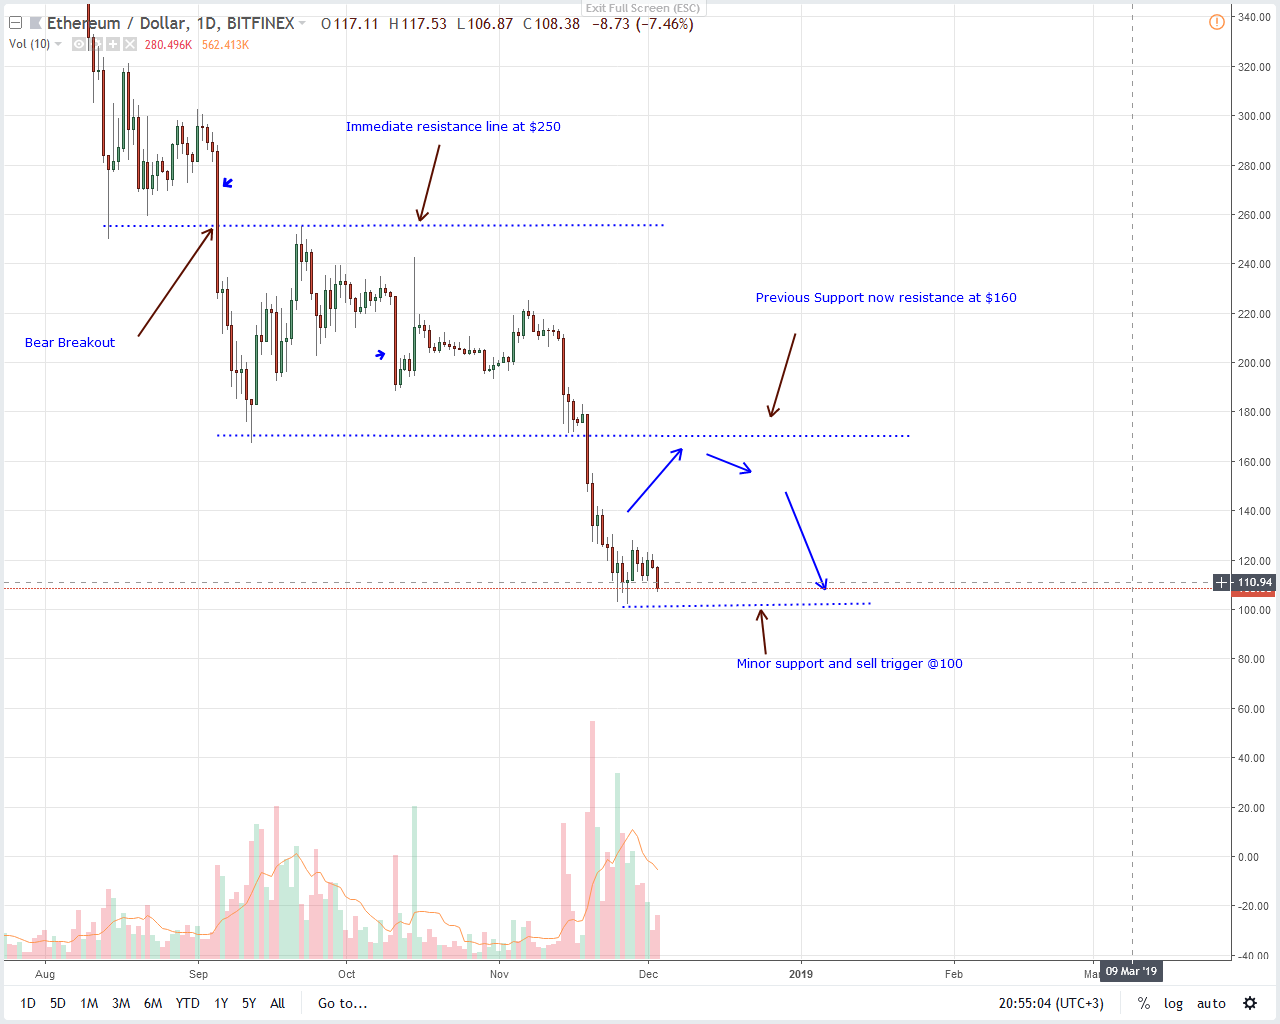
Ideally, what we would like to see is a solid confirmation of the three-bar bull reversal pattern of Nov 28. That, and as laid out in previous ETH/USD price analysis, could help lift prices above 0 and towards 0 in a retest phase of an overall bear breakout pattern.
However, yesterday’s seven percent loss could be exacerbating because if prices drop below 0 at the back of strong volumes then we could see bear resumption and it could be a drain that would push ETH back to , and .
Therefore, because of this likely scenarios, we recommend holding a neutral stand until either prices edge above Nov 28 highs of 0 igniting aggressive traders aiming at 0 or dips below 0 in a trend resumption move.
All Charts Courtesy of Trading View
Disclaimer: Views and opinions expressed are those of the author and aren’t investment advice. Trading of any form involves risk and so do your due diligence before making a trading decision.
The post Ethereum Price Analysis: ETH/USD Price Risk Dropping Below 0 appeared first on NewsBTC.
Winter Cometh: Bitcoin to Equal Four Year Record Dropping Four Months in a Row
Bitcoin has not fallen for four consecutive months and closed November in the red since 2014. As the world’s largest digital currency continues its downward spiral new records are being made, and they are not ones to revere in. It is on track to repeat a record not seen for four years.
Bitcoin Patterns Back to 2014
This milestone has been noted by Marketwatch which made the comparison in a report citing Dow Jones Market data. The four in a row began in August when Bitcoin dropped 8% over the month falling from around ,600 at the beginning to just below ,000 by month end. BTC then dropped below ,000 for the second time this year on August 14 and has fallen every month since.
According to the report the last time this happened was during the crypto winter of 2014. That year saw BTC dump over 70% when it tumbled from a high of ,130 in December to just over 0 by the end of December 2014. The pain did not stop there as the bear market continued deep into 2015 when Bitcoin dropped to a low of 3 in January according to Coinmarketcap.
This represented a fall of 84% from its all-time high. Bitcoin remained on the floor trading around 0 for most of 2015 before finally starting to head upwards in October.
Comparatively, Bitcoin has declined just over 80% this year since its ATH back in December 2017. Since August this year Bitcoin has fallen by half as it hit a new yearly low on Sunday when it dropped below ,600. Yesterday saw another two bounces off ,650 which appears to be a support level soon to break. This sentiment is being echoed by technical analysts that have been correct so far;
HIGHLY speculative, but…: pic.twitter.com/OeUSPcmRTN
— Murad Mahmudov
(@MustStopMurad) November 27, 2018
Analysts are now calling a ,000 bottom where Bitcoin will remain for several months and may not recover until the latter half of 2019. If the 2014-2015 crypto winter is to be repeated things may not improve until around October time when the bears may finally go into hibernation.
Things will go quiet on the crypto trading front, as they did four years ago, but the industry has grown monumentally since then and institutional players are now taking an interest. As crypto leaders, such as Binance boss CZ, likes to say; “Now is the time to Buidl”.
FUD wins in the short term, BUIDL wins in the long term. https://t.co/ikQDNQZI0G
— CZ Binance (@cz_binance) November 26, 2018
Bitcoin appears to be repeating a pattern last seen four years ago but the space is very different now. Either way it looks like the time to batten down the digital hatches and prepare for a long cold spell in crypto land.
Image from Shutterstock
The post Winter Cometh: Bitcoin to Equal Four Year Record Dropping Four Months in a Row appeared first on NewsBTC.
Bitcoin Sets New Low over Weekend, Continues Dropping on Monday
Over the weekend, Bitcoin continued its downwards tailspin due to weak buying volume, and many of the cryptocurrency market’s losses have stretched into Monday. The persisting market decline is now leading traders and investors alike to question how low the markets will go before they hit a bottom.
At the time of writing, Bitcoin is trading up 1% at its current price of ,800. Over this past weekend, Bitcoin set a new yearly low at approximately ,500, from which it temporarily recovered to highs of just over ,100 earlier today before continuing to drop to its current price. Bitcoin has bounced slightly from its daily lows of ,640, but it is unclear how short-lived this move will prove to be.
Bitcoin may not have fallen far enough for it to establish a long-term bottom, and further losses may be necessary in order for macro-reverse to be in play.
Last week, Michael Moro, the trading chief at Genesis Trading, told CNBC’s Squawk on the Street that Bitcoin needs to hit the ,000 level before bottoming and reversing the downwards trend.
“You really won’t find [the floor] until you kind of hit the 3K-flat level. It’s really difficult. There are small levels of resistance. We’ve seen the 4,000 level get tested twice now in the last couple of days, but I really don’t think there’s too much in the mid-3s,” he explained.
This being said, there could be further losses that are necessary before the markets begin a new upwards cycle that could propel the markets to new highs, and the entire world seems to be questioning what the true value of Bitcoin really is.
“There is nothing normal nor positive about this type of price movement so beware of false profits selling soothsayer storylines and never get anchored to a price. Just because BTC is trading below ,000, ,000 or ,000 for that matter, doesn’t mean bitcoin is undervalued even more so when BTC offers up no intrinsic store of value,” said Stephen Innes, the head of Asia Pacific trading at Oanda, while speaking to MarketWatch.
Related Reading: Are We There Yet? When Will Crypto Markets and Bitcoin Hit the Bottom
Altcoins Dragged Down by Bitcoin
This weekend also proved to be turbulent for the altcoin markets, as Bitcoin’s unprecedented drop to new lows sent many altcoins spiraling downwards, with XRP falling to the low-.30 region, and Bitcoin Cash setting new all-time-lows.
At the time of writing, XRP is trading up nearly 3% over a 24-hour trading period at its current price of .352. Over the weekend, XRP followed Bitcoin’s lead and plunged below the .40 region to lows of .32 before bouncing back to highs of .39. Since experiencing a temporary bounce back towards the .40 region, XRP has continued to decline to its current price levels.
Bitcoin Cash, which set a new all-time-low over the weekend, is currently trading up 5% at its current price of 8 but hasn’t rallied much since setting a fresh low of 5 on Sunday.
Ethereum has also had a bad week and flirted with double digits on Sunday. Despite this, its price seemed to find support around the 0 level and has since recovered slightly to its current price of 8.
As the markets continue their downwards descent, investors are becoming increasingly interested as to what price will prove to be a reversal point for the cryptocurrency markets.
Featured image from Shutterstock.
The post Bitcoin Sets New Low over Weekend, Continues Dropping on Monday appeared first on NewsBTC.
Altcoins Price Analysis: LTC/USD Set for $20 after Dropping to 8th
Even with listing at Bitex, LTC/USD is facing upside resistance and is now trading below . Moving on, this is definitely inviting for sellers just like it is with Monero—XMR/USD and at EOS/USD. All in all, before sharp drops print, it is likely that bears will slow down allowing for minor recovery towards immediate resistances.
Let’s have a look at these charts:
EOS/USD Price Analysis
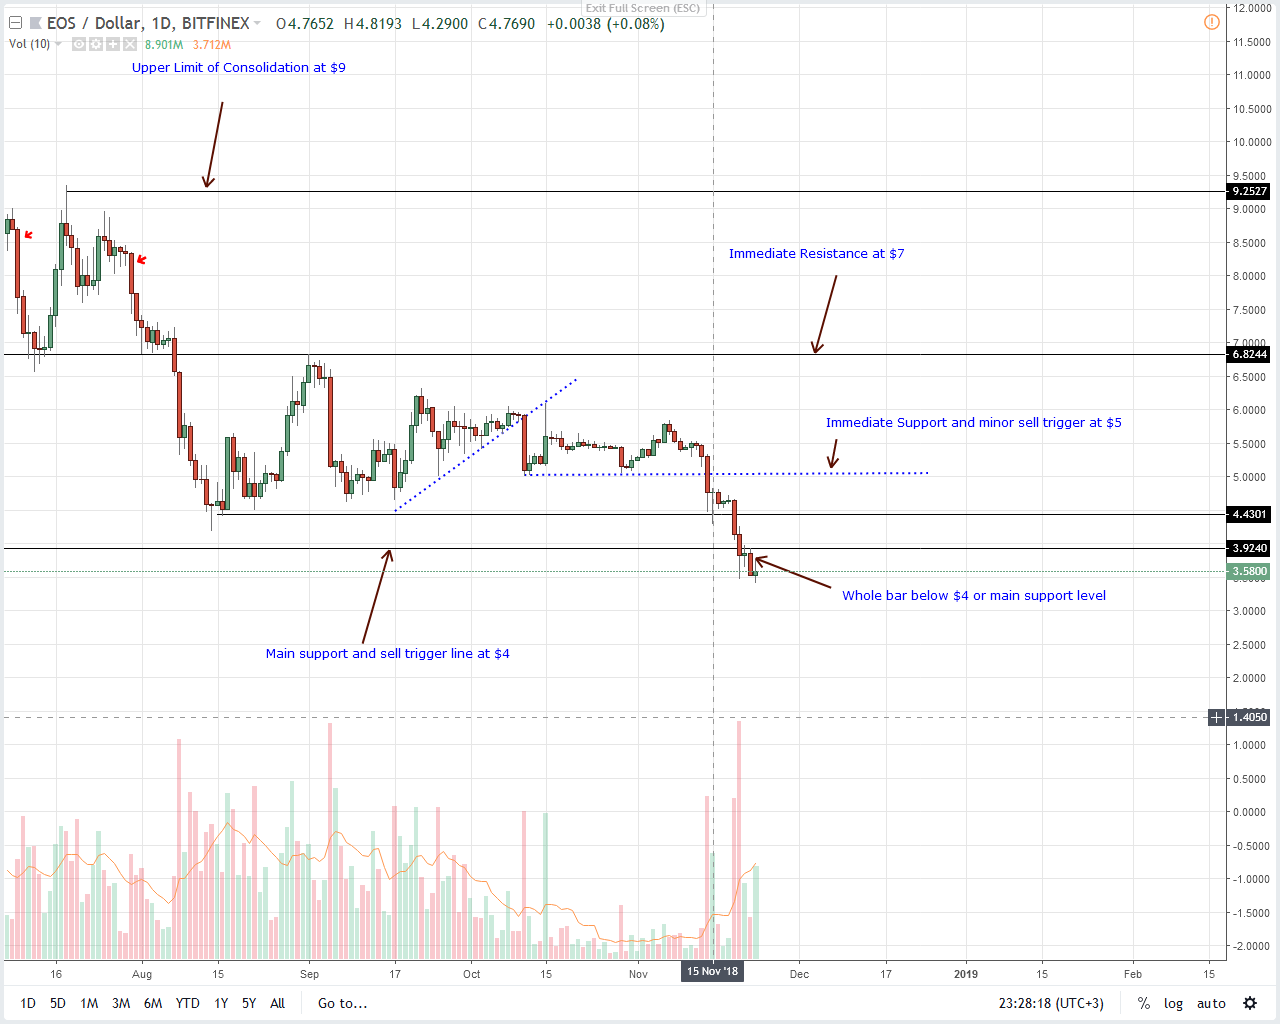
Price movements are tight and previous EOS/USD trade plans are valid. For all we can draw from the charts, EOS/USD is bearish, down 25 percent in the last week and trading within a bear breakout pattern.
Read: Top Tech Stocks Lost More Than Entire Crypto Market Since All-Time High
Since our shorts are live and stops at Nov 20 highs are safe, both set of traders—risk on and aggressive can begin unpacking EOS on every pull back in lower time frames with targets at .5 in line with our previous suggestions.
However, bounce back that will see our stops at cleared would probably ignite a comeback driving prices back to and later as per the Fibonacci Retracement rules.
LTC/USD Price Analysis
Thanks to favorable regulation, a new crypto exchange, Bitex has opened its doors in the UAE. This comes just five months after the country’s regulator the Financial Services Regulatory Authority came up with a comprehensive set of guidelines meant for local firms dealing with digital currencies. The exchange supports fiat deposit and withdrawal as well as Litecoin and three other high liquid coins will sate crypto demands in the Gulf State and surrounding territories. Dubai, which is UAE’s financial hub, plans to conduct 50 percent of all their transaction over blockchain networks as part of the state’s 2021 Blockchain Strategy.
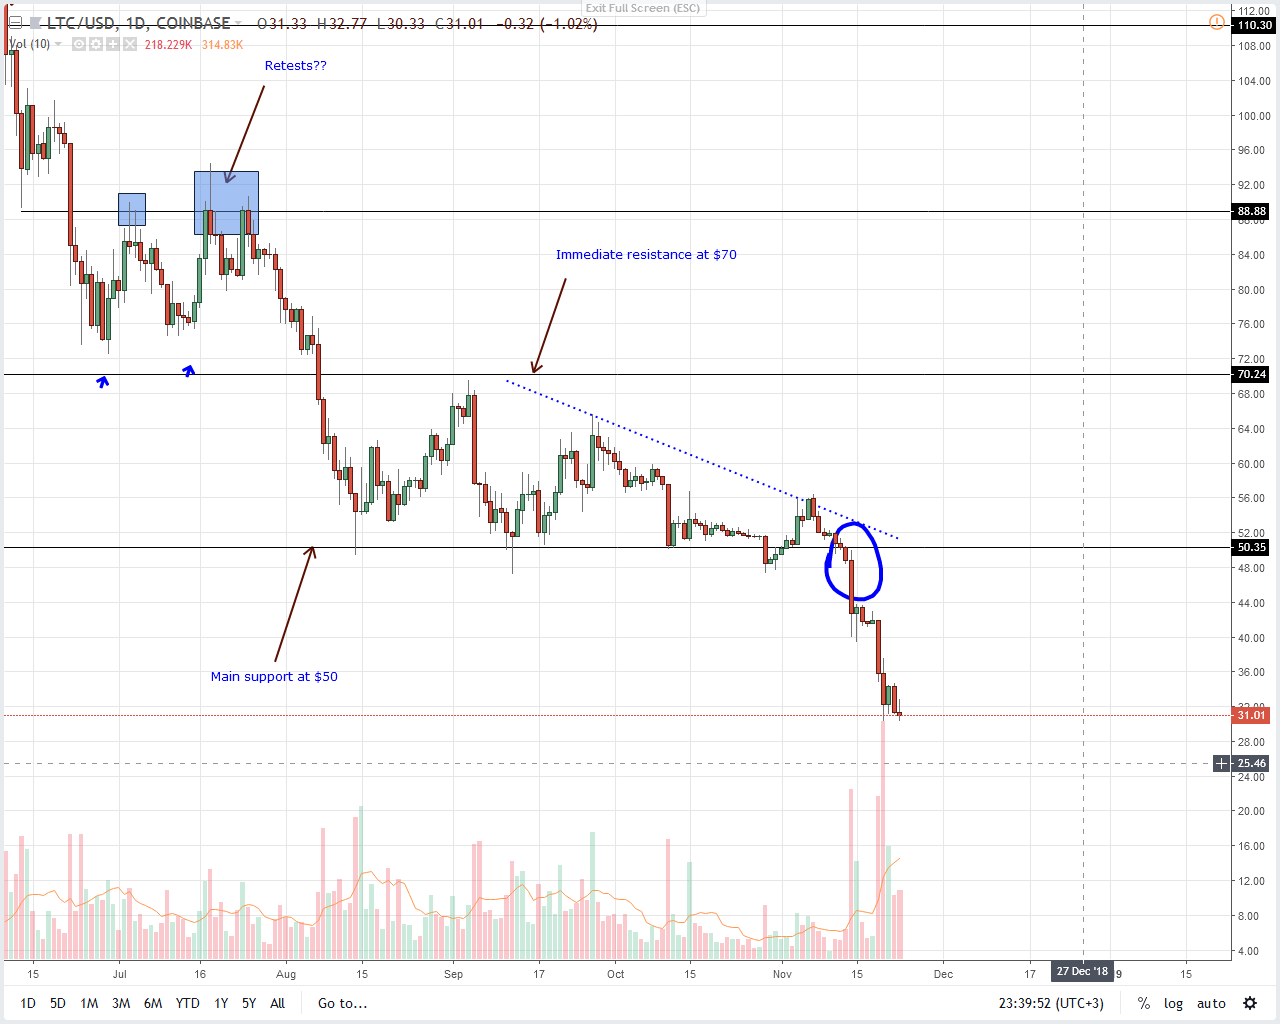
Price wise Litecoin is under immense pressure and faltering. It is down six percent in the last day meaning it is down one spot to eighth and bears could as well drive prices below . Like in our last LTC/USD price analysis, we expect prices to recover from and probably retest before bear trend resumes.
However, headwinds are strong and should today edge lower with a complete bear bar printing below then traders are free to dump more LTC at spot. In that case LTC could drop and find minor support at .
XLM/USD Price Analysis
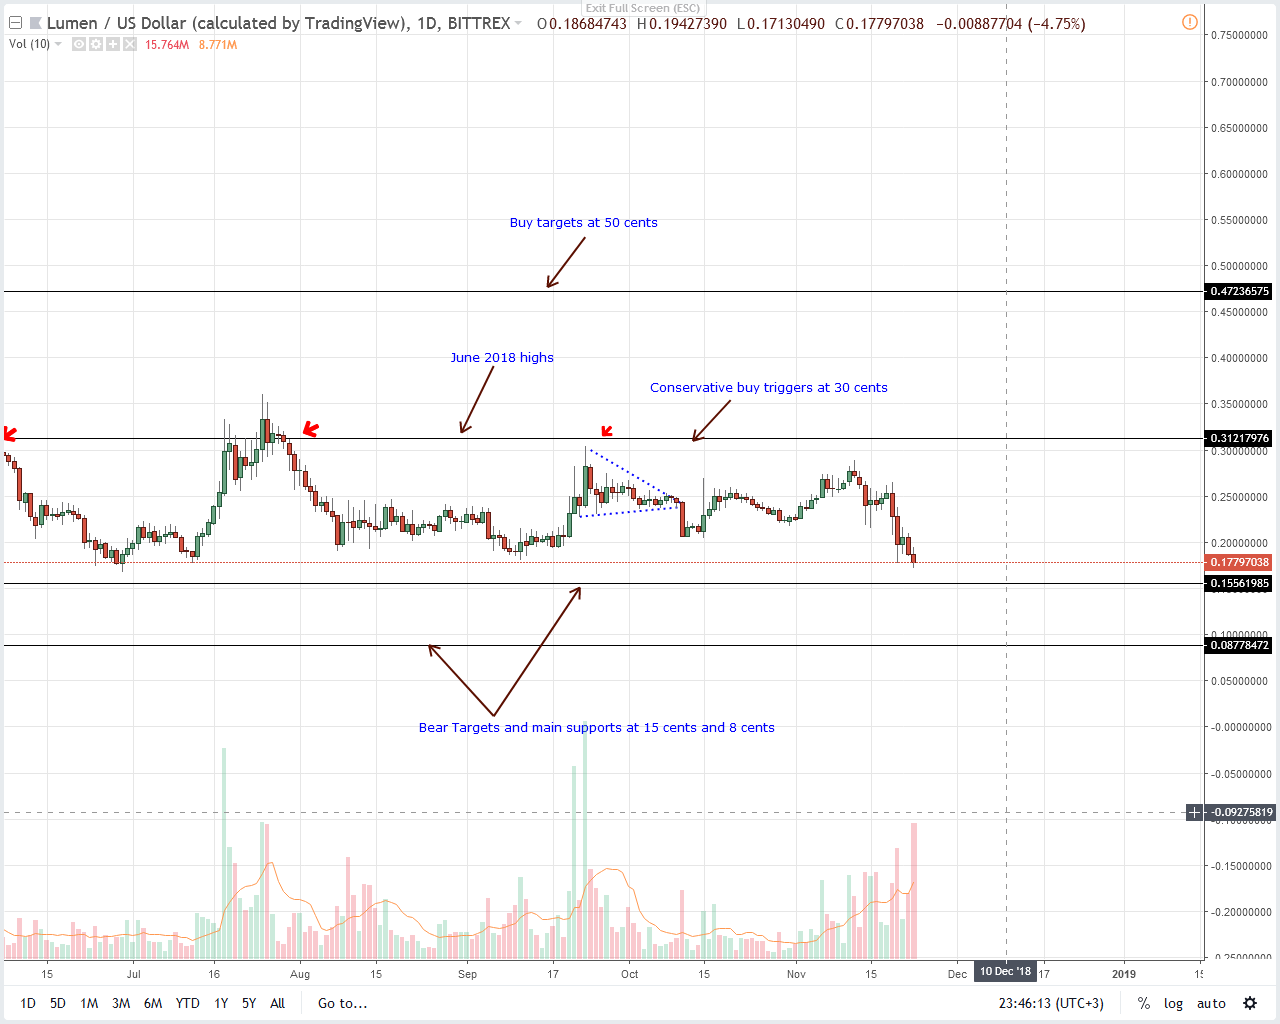
Margins are tight and as Bitcoin Cash drags other altcoins with it, Stellar Lumens could flip it to fifth. The gap between these two coins is less than 0 million but since BCH is dropping drying up liquidity and wiping demand, XLM/USD is a contender as the coin losses are low relative to BCH and is trading within a 15 cent trade range.
Also Read: Minimal Movement as Crypto Markets Find New Plateau
As long as BTC upsides are capped, XLM and most altcoins could sag and probably retest key support line as prices breakout in either direction. In our case, XLM bears are in control and with 2 cents to go, we expect sellers to exert more pressure and this could see XLM/USD printing 8 cents by the end of the year.
ADA/USD Price Analysis
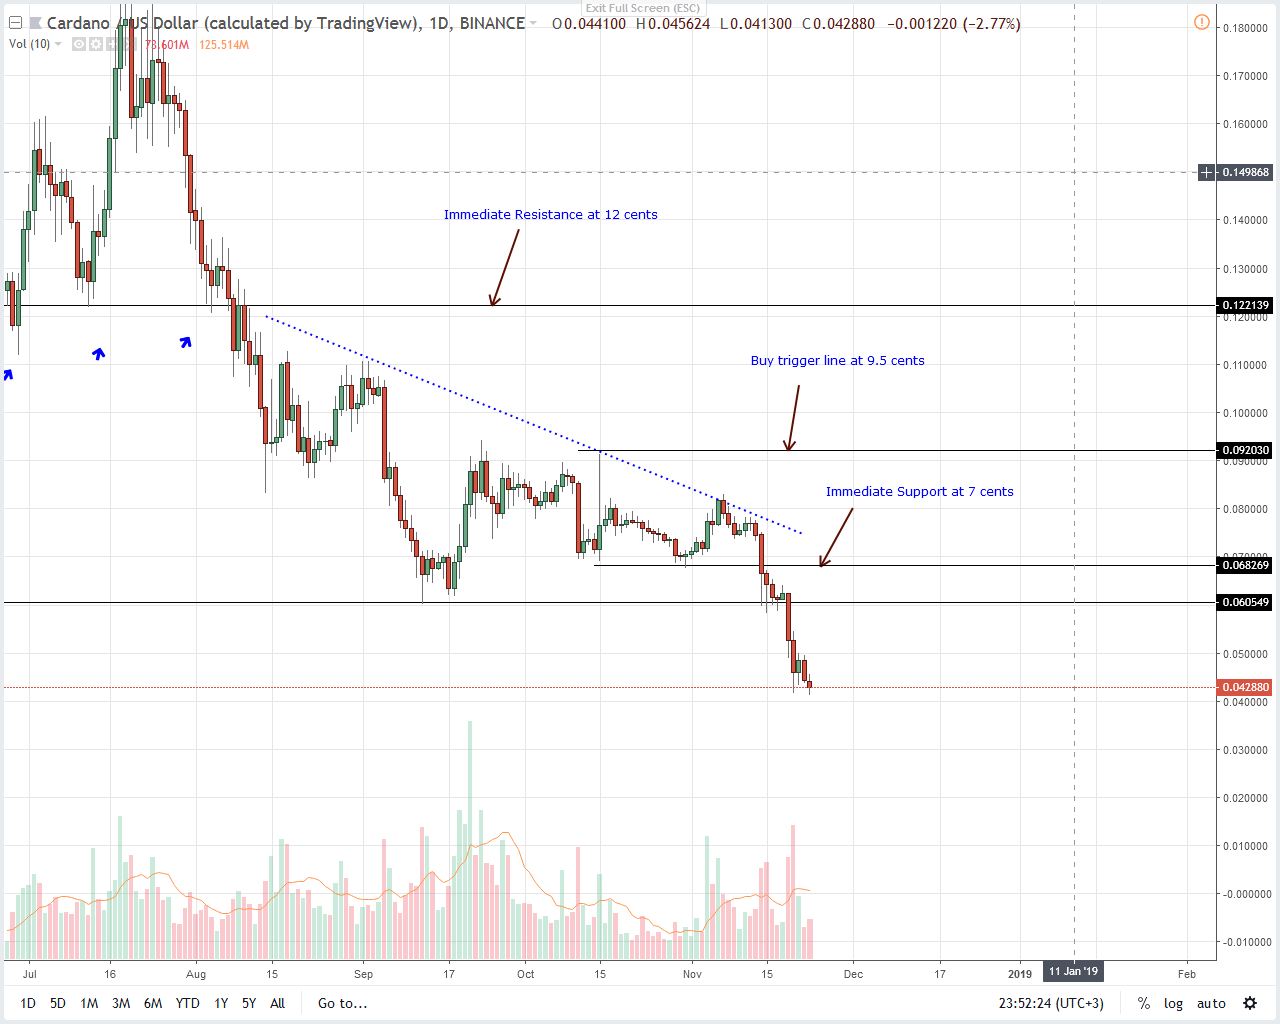
Like the rest of the market, sellers are unforgiving and their relentless pressure has seen Cardano drop 33 percent in the last seven days. Unfortunately for sellers, floors aren’t visible. Furthermore, with a lack of a working project, a heating smart contracting market and a 10 year time frame before Voltaire, declines are inevitable.
As such, sellers should unload ADA on every pull back retesting 6 cents and let the trade run as price action set new lows for the coin. On the flip side sharp gains above Nov 19 could be trend reversing but still sharp volumes must print. That means ADA/USD bulls might first clear 9.5 cents or Oct highs before supporters ramp up longs.
XMR/USD Price Analysis
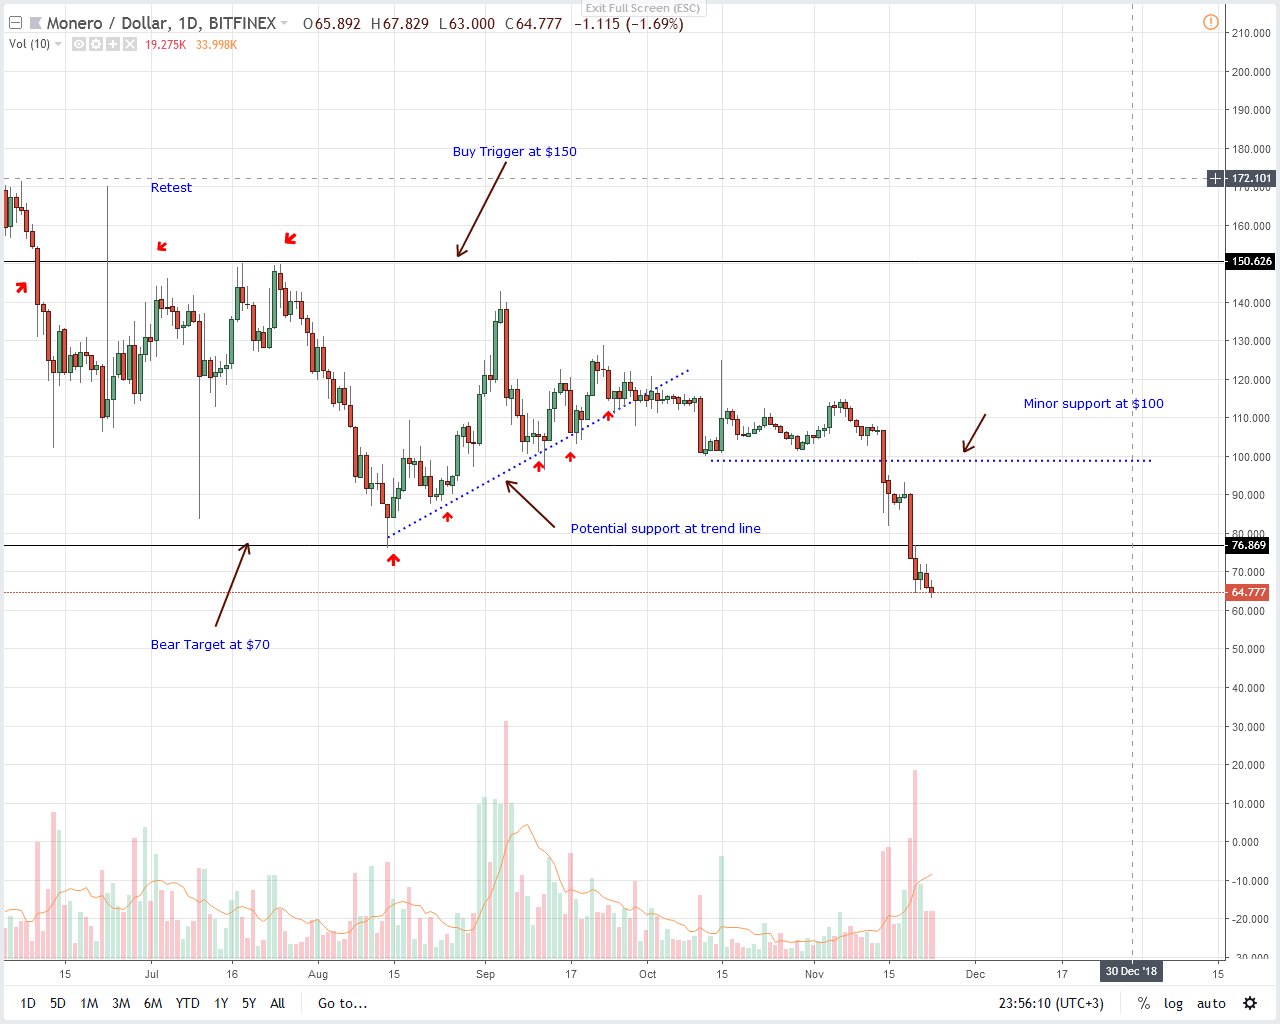
Monero is trading within a bear breakout pattern following Nov 19 sharp drops that saw prices close below . Nov 20 confirmation ushered in sellers and as it stands, traders can continue selling the coin on pull backs just like in our previous XMR/USD trade recommendations. Gains above cancels this move where sellers are aiming at .
All Charts Courtesy of Trading View
Disclaimer: Views and opinions expressed are those of the author and aren’t investment advice. Trading of any form involves risk and so do your due diligence before making a trading decision.
The post Altcoins Price Analysis: LTC/USD Set for after Dropping to 8th appeared first on NewsBTC.
Cardano Price Analysis: ADA/USD Risk Dropping Below 6 Cents
Latest Cardano News
Thing is Cardano is barely a year old but they are clear, sticking to their initial vision and mission statement. Believing that the platform is as good as the community behind it and no one should be an obstruction as the team sweat towards a superior, governable and community centric smart contracting platform, Charles Hoskinson and Ken Kodama of Emurgo led a campaign that saw Michael Parsons resign after a string of what they say was poor performance and wanting leadership. Paul Schmid is the chair of the Cardano Foundation on a temporary basis.
The Babylonian Capitivity of Cardano has Ended https://t.co/S0WeieC2TH pic.twitter.com/kJRLYsvbcN
— Charles Hoskinson (@IOHK_Charles) November 13, 2018
The campaign by Charles Hoskinson to oust Michael is a clear indication that the team is past mediocrity and centralization attempts. Besides, standards are high now that the project is fully funded by the community. As such accountability, transparency and full dedication is expected from the team despite a biting bear market discouraging many from participating or even channeling their money into blockchain projects.
Everything else constant, Cardano is promising. From a technological, risk-ward and adoption level metrics, Weiss Ratings is recommending buy-hold for ADA. This is mostly because of the active community around the project. At the same time, the expectation of future adoption is high as the project seeks to present a superior, peer-reviewed smart contracting system.
ADA/USD Price Analysis
Weekly Chart
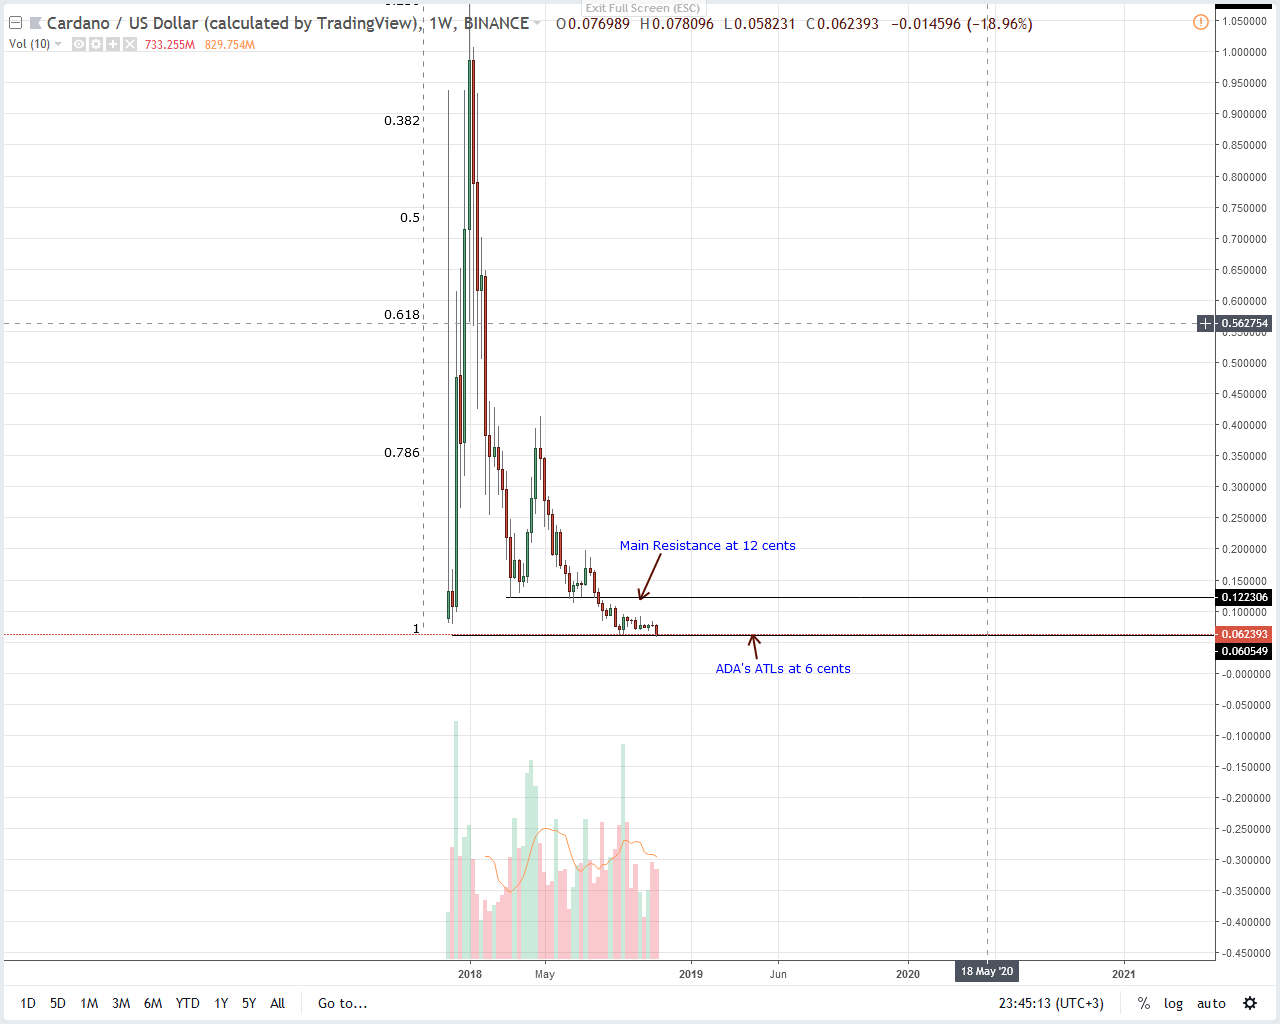
Losses are visible across the market and ADA/USD is no exception. Printing an 18 percent drop in the last week, ADA risks recording new lows if last week’s declines continue through this week. Though technicals point to bears, prices are actually trending inside week ending Sep 23. The bar had superior trading volumes of around 1.75 billion compared to last week’s 900 million.
For our trade conditions to go live then we need to see strong losses below 6 cents. Like in our previous ADA/USD such dips would print new ADA ATLs. As a result, risk-on traders should load at spot in lower time frames with stops at 6 cents and let the trade run.
On the flip side, rejection of lower lows could see prices recover above 7 cents towards 9.5 cents confirming week ending Sep 23 gains igniting buyers aiming at 12 cents just in line with our previous ADA/USD price analysis.
Daily Chart
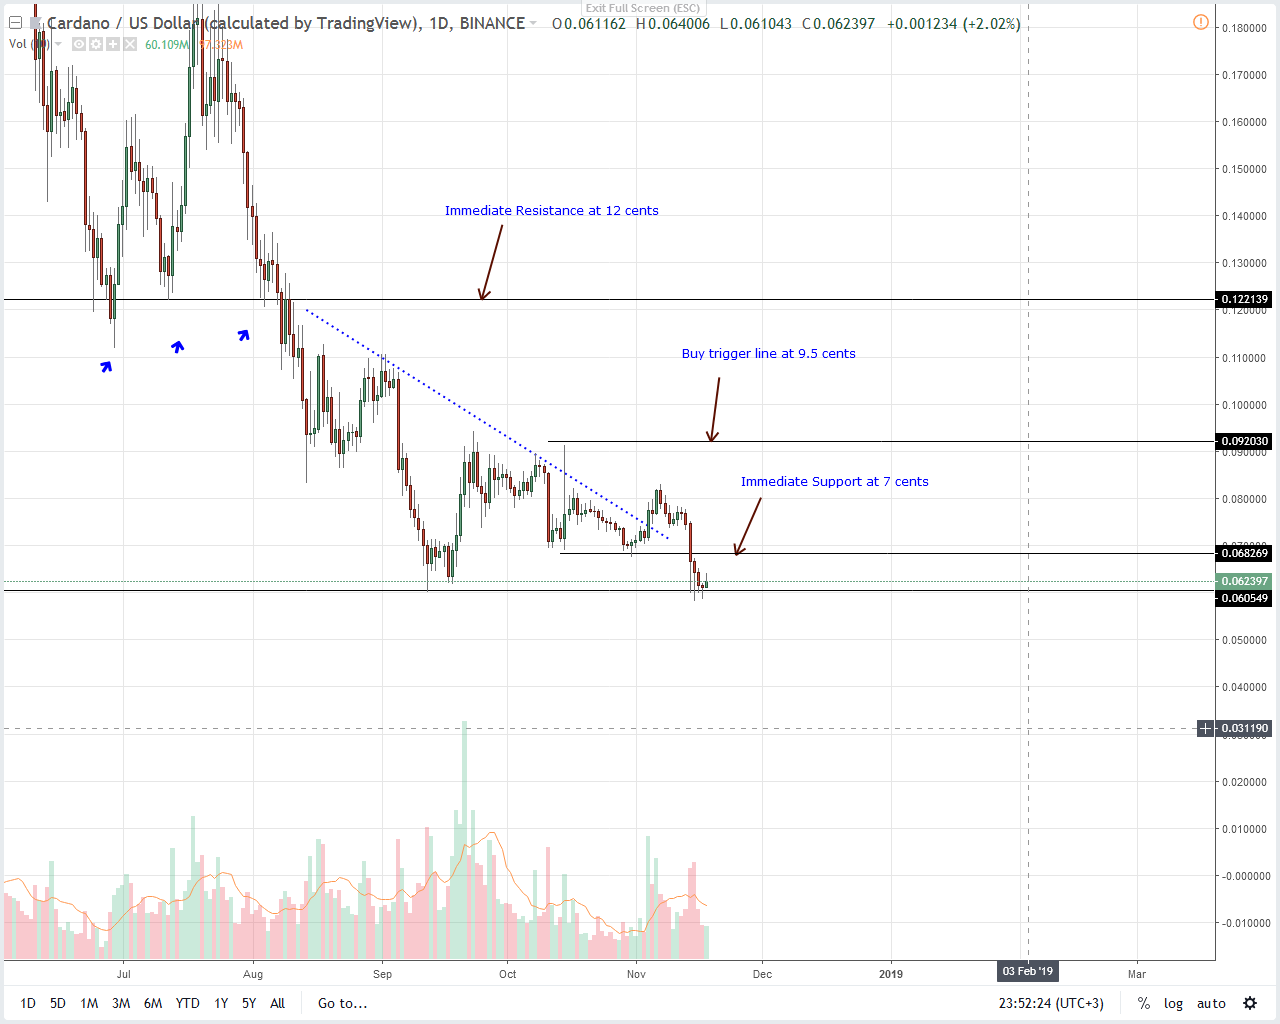
Here, ADA/USD prices are stable but still bearish. As above, we suggest taking a neutral stand since risk-reward considerations isn’t favorable to initiate trades at spot. However, once a whole bar prints below 6 cents then sellers can short at spot.
Alternatively, prices could print higher in response to last week’s rapid losses. In that case, ideal sell zone is between 6.5 cents and 7 cents with stops at 7.5 cents.
All Charts Courtesy of Trading View
Disclaimer: Views and opinions expressed are those of the author and aren’t investment advice. Trading of any form involves risk and so do your due diligence before making a trading decision.
The post Cardano Price Analysis: ADA/USD Risk Dropping Below 6 Cents appeared first on NewsBTC.
Altcoins Keep Dropping While Bitcoin Breaks Another Record of Market Dominance in 2018
n Most altcoins see red, while Bitcoin holds ,200 support and breaks another record of market dominance in 2018n
CryptScout #BitFeed RSS – Bitcoin and Cryptocurrency News 24/7