 According to market data, crypto assets struggled throughout June, with only a select few recording gains. The largest gainer was the meme coin brett (BRETT), which surged 64.9%, while the biggest loser was the meme token maga (TRUMP), plummeting 55.29%. Select Coins Rise Despite Overall Decline This Month June was predominantly bearish for cryptocurrencies, with […]
Bitcoin News
Balaji Srinivasan Explains Why Crypto Will Dominate Post-AI Money Systems
 Balaji Srinivasan argues that in the era of AI, money will become cryptocurrency, providing digital scarcity to complement AI’s digital abundance. “AI is digital abundance but it doesn’t make everything abundant. Crypto is digital scarcity and complements AI’s abundance. So money after AI is crypto,” he detailed. ‘Money Itself Becomes Cryptocurrency’ Balaji Srinivasan, a prominent […]
Bitcoin News
Ethereum Technical Analysis: Bullish Signals Dominate as Ether Trends Higher
 Ethereum’s price on May 27, 2024, stands at ,908, reflecting a strong upward trend in the recent trading sessions. Ether’s intraday range has been between ,795 to ,953 over the past 24 hours. Ethereum Ethereum’s 1-hour chart reveals a steady upward trend starting from May 26, peaking at approximately ,953. After reaching this peak, the […]
Bitcoin News
Season of the Meme Coin: Unconventional Cryptos Dominate 3-Month Gains
 Over the past 90 days, bitcoin has appreciated by 23.4%. However, eight other cryptocurrencies have demonstrated significantly larger gains, each recording triple-digit increases over the same period. 90-Day Trends Propel Niche Tokens to New Heights Statistics from the past week show lackluster performances for cryptocurrencies against the U.S. dollar. Yet, over the past 90 days, […]
Bitcoin News
Lightspark CEO Expects Bitcoin to Dominate AI-Related Monetary Transactions
 David Marcus, the former president of Paypal and the current CEO of Lightspark, envisions bitcoin as the primary currency for artificial intelligence (AI) in the future. He describes bitcoin as “maximally neutral,” highlighting its advantages over conventional fiat currencies like the euro or the U.S. dollar. Bitcoin Poised to Become Default Currency for AI, Says […]
Bitcoin News
DeFi And Web3 Gaming Dominate Q1: Record Transactions Leave Stablecoins In The Dust, Report
In a recent report published by QuickNode, the first quarter of 2024 showed the dominance of decentralized finance (DeFi) and the notable growth of Web3 gaming in the crypto industry, which outperformed the stablecoin sector in key metrics, indicating investor preference and market sentiment during this period.
Hopes For Second ‘DeFi Summer’
Per the report, DeFi experienced a significant resurgence in Q1’24, fueled by a surge in developer and user activity, particularly on chains like Solana (SOL) and Base.
This resurgence has sparked growing hopes of a second ‘DeFi Summer,’ as DeFi projects embrace new concepts such as staking, liquid staking, restaking, and liquid restaking, which have been catalysts for its growth. Notably, staking now represents a substantial portion of DeFi’s Total Value Locked (TVL).
While stablecoins remain the top spot for address activity, DeFi surpassed stablecoins in an essential metric: transaction counts.
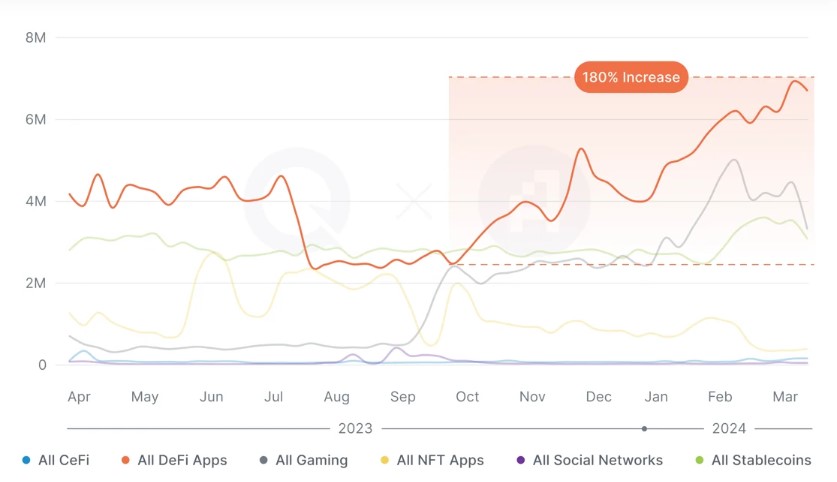
DeFi emerged as the leader in transactions for Q1’24, averaging nearly 7 million daily transactions. Furthermore, DeFi led in fees spent, gas usage, and the overall number of projects despite comprising only approximately 4% of the total crypto market cap.
The TVL for yield-generating protocols within DeFi witnessed steady growth, climbing from .5 billion in Q3’23 to .7 billion in Q1’24. According to QuickNode, this rally signifies a return of confidence and liquidity to the DeFi markets as investors seek opportunities for yield generation.
Players Take Control With Web3 Gaming
In parallel, Web3-based gaming has emerged as a significant departure from conventional gaming platforms. By leveraging cryptocurrencies and non-fungible tokens (NFTs), Web3 gaming offers players new and decentralized gaming.
Players now have the opportunity to actively participate in games and earn rewards, shifting control away from centralized entities within the gaming ecosystem.
The report highlights the growth of Web3 gaming, surpassing stablecoins in transaction volume and achieving the highest year-over-year (YoY) active address growth across all categories, with a 155% increase in active addresses during Q1 ’24.
This surge in player engagement and participation is evident through the exponential growth of transactions within Web3 gaming, which experienced a staggering 370% YoY increase.
The Appeal Of Stablecoins
Although stablecoins continue to lead in daily active users, representing over 41% of all Web3 user activity, other categories have shown higher quarter-over-quarter (QoQ) activity growth, indicating potential catch-up.
Tether’s USDT remains the dominant stablecoin, controlling approximately 75% of the market cap. Notably, Circle’s USDC has taken the lead in volume and average transaction size, partly due to Coinbase’s efforts to integrate USDC on its platform and promote its use on its Layer 2 network, Base.

In addition, the report notes that stablecoins have proven attractive to both new and experienced users, offering stability and value predictability, especially during periods of market uncertainty.
QuickNode attributes the surge in stablecoin user activity in Q1’24 to several factors, including the approval and listing of spot Bitcoin ETFs in the US, the anticipation of Bitcoin’s next Halving event, the devaluation of fiat currencies, the popularity of low-volatility assets, and the strength of the USD, to which over 90% of stablecoin transactions are anchored.
Featured image from Shutterstock, chart from TradingView.com
BTC and ETH Derivative Tokens Dominate by Securing Several Top Positions in the Crypto Economy
 Throughout this month, bitcoin and ethereum have risen to their highest valuations in years. These two pivotal crypto assets have substantially influenced the cryptocurrency market, with bitcoin currently holding a 51.9% market dominance and ethereum at 17% as of mid-March 2024. Furthermore, in recent years, derivative tokens of bitcoin and ether have garnered significant popularity. […]
Bitcoin News
Bitcoin Technical Analysis: Sharp Downturns as Bearish Trends Dominate Price Movements
 Bitcoin witnessed a notable intraday swing from ,569 to ,794, reflecting a volatile market environment. Despite this turbulence, its market capitalization still holds strong at just over .3 trillion, supported by a substantial 24-hour trading volume of billion. Bitcoin The analysis of bitcoin’s (BTC) oscillators and moving averages (MAs) presents a mixed signal for […]
Bitcoin News
Cardano Bulls Come Out To Play: Buy Orders Dominate As ADA Price Soars
Cardano is currently riding on the back of a modest 3.76% gain in the past seven days with the cryptocurrency on its way to the .55 level which will define its short-term price trajectory. On-chain data shows that the bulls are working hard in the background to push the crypto toward this price point, as evidenced by the buy orders piling up.
Particularly, Cardano has experienced a surge in buy orders, tipping the bid-ask volume imbalance in the direction of the bulls. With so many buyers and so few sellers, the price of ADA has only one way to go.
At the same time, activity on the Cardano blockchain is exploding but the question remains whether this interest and optimism will continue to drive ADA prices up or whether the rally will run out of steam as some traders take profits.
Buy Orders Tip By 678% In The Way Of The Bulls
On-chain data show that Cardano bulls are currently out in full force, driving a huge imbalance in buy and sell orders that’s currently sending the bid volume outpacing ask volume by 678%. This strong imbalance tells the current bullish sentiment among Cardano investors.
The dynamic nature of the battle between buyers and sells means the imbalance can change at any time. If the spread narrows, it could signal that the rally is losing steam and a reversal may be on the horizon.
However, Cardano seems to be holding on, as indicated by this week’s price action. Presently trading at .5361, Cardano has shown incredible resilience to continue trading above the .50 price level throughout the week.
Price Targets For Cardano (ADA)
ADA is still down in a monthly timeframe, but many crypto analysts are hopeful on the crypto’s future price trajectory. The first step in establishing a very bullish run is a break over the psychological price resistance at .55 which it has tested in the past 24 hours. Failure to break over this resistance would either mean a continued range trading between .55 and .50 or a bearish breakout below .50.
According to crypto analyst Ali Martinez, ADA might continue consolidating until April before going on a sustained breakout past its current all-time high to reach by January 2025.
For Cardano to maintain this momentum, it is necessary for the cryptocurrency to continue demonstrating robust market fundamentals and meaningful advances within its ecosystem. Despite facing multiple criticisms,
Cardano remains one of the most actively developed blockchains, with a vibrant open-source community. According to founder Charles Hoskinson, Cardano’s main hurdle is not technological but human in the aspect of decentralized on-chain governance.
Featured image from Adobe Stock, chart from TradingView
Ethereum Technical Analysis: Bearish Trends Dominate Across Multiple Timeframes

Similarly to bitcoin’s action, the second largest crypto asset by market cap, ethereum, has seen some market turmoil and a distinct downtrend. As of Jan. 22, 2024, ether has shown a notable decrease, registering a 3.3% drop in 24 hours and a 5.7% decline over the past week.
Ethereum
Ethereum’s (ETH) market capitalization stands at 7 billion, a reflection of its significant presence in the crypto market. However, its 24-hour trading range of ,364 to ,479 and a 24-hour trade volume of .84 billion indicate a period of heightened volatility and trader caution. This is underscored by the current price of ,380 per ETH, which is down from recent highs, suggesting a bearish sentiment among traders.
The oscillators paint a picture of neutrality with a slight inclination towards bearishness. The relative strength index (RSI) at 48.8, Stochastic at 47.1, and the commodity channel index (CCI) at -10.3 all indicate a neutral stance. However, the momentum indicator at -127.9 signals bullish sentiment, whereas the moving average convergence/divergence (MACD) level at 46.8 suggests bearish action, highlighting the mixed signals in the current market.
Ethereum’s moving averages (MAs) predominantly suggest a bearish outlook. The short-term exponential moving averages (EMAs) at 10 and 20 days, along with the simple moving averages (SMAs) at the same periods, show bearish sentiment. In contrast, longer-term MAs, particularly the EMAs and SMAs for 50, 100, and 200 days, indicate bullish opportunities. This divergence between short-term and long-term MAs could suggest a potential shift in market dynamics.
The 4-hour chart analysis presents a marked downtrend, marked by successive declines, signaling robust bearish momentum. A slight uptick on Monday morning at 9 a.m. Eastern Time hints at a possible recovery, but the subdued trading volume implies a weak buying interest. For traders, considering entry points would depend on a clear trend shift, while opportunities for exiting or engaging in short-selling might emerge with the confirmation of a persistent downtrend.
Parallel to the 4-hour chart, the daily chart underscores this downtrend through a sequence of unbroken drops. A significant sell-off, characterized by heavy volume, underscores the prevailing bearish mood. The subsequent price action indicates a state of market uncertainty. Savvy traders eyeing long positions should be vigilant for signs of bullish trend reversals, whereas those looking to exit or take short positions may find opportunities in the ongoing downtrend. Currently, the trend appears to be inclined towards a downward trajectory.
On the one-hour chart, the detailed view corroborates the bearish trend observed in the longer-term analyses, as evidenced by a consistent pattern of declines forming lower lows. This morning’s rise may suggest a temporary trend reversal; however, the modest volume accompanying this increase still warrants caution.
Bull Verdict:
The current ETH market, while showing signs of bearish trends in the short term, holds the potential for a bullish reversal. Key indicators such as the long-term moving averages and certain oscillator readings suggest underlying strength. This, coupled with the potential for market dynamics to shift rapidly in the ethereum trading arena, could pave the way for a bullish resurgence.
Bear Verdict:
Ether’s market analysis, predominantly driven by the current bearish sentiment visible in the short-term moving averages and oscillator readings, indicates a continuation of the downward trend. The consistent pattern of declining prices across various time frames, coupled with high volatility and cautious trader behavior, suggests a bear market scenario.
Register your email here to get weekly price analysis updates sent to your inbox:
What do you think about ether’s market action on Monday morning? Share your thoughts and opinions about this subject in the comments section below.