 On Wednesday at 11 a.m. EDT, bitcoin hovered just around the ,000 mark. QCP Capital published its market commentary, attributing the downturn in the crypto economy to a lack of news flow and stagnant markets. In such a market, with minimal positive news to spur buying, existing crypto holders may lose confidence and patience. Crypto […]
Bitcoin News
Polygon In Peril: Will MATIC Bounce Back Or Stay Stuck In The Sub-$1 Doldrums?
Polygon (MATIC), the high-speed scaling solution for Ethereum, has been on a rollercoaster ride this month. After a brutal price correction that saw MATIC tumble over 20%, a recent 24-hour surge has injected a dose of optimism into the market. But is this a sign of a full recovery, or a temporary reprieve before further decline?
Polygon’s Price Plunge: A Reality Check
CoinMarketCap data paints a sobering picture. MATIC has been steadily dropping down the ranks of the top 20 cryptocurrencies, currently sitting at number 18. This decline coincides with a significant price drop, with MATIC losing over a quarter of its value in the last 30 days.
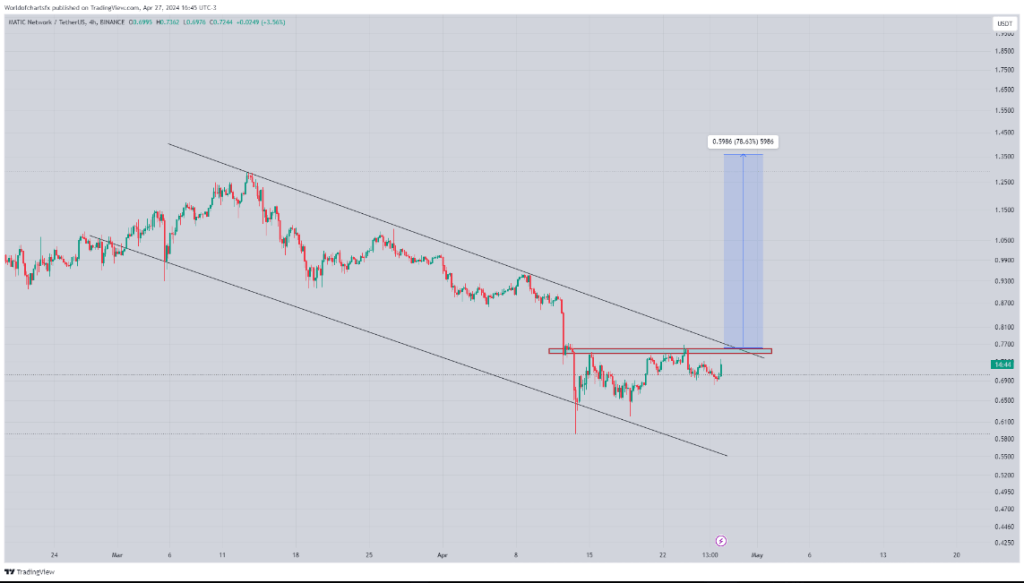
Analysts like World of Charts point to the descending channel pattern on MATIC’s daily chart, a classic indicator of a bearish trend. For a true price recovery, MATIC needs to overcome a crucial hurdle: the .77 resistance level. A breakout above this point could trigger a significant bull run to the dollar level, but the climb won’t be easy.
$Matic#Matic Still Nothing Has Changed Consolidating In Descending Channel Successful Breakout Can Lead Massive Bullish Wave In Coming Days https://t.co/RBiSg4kaGb pic.twitter.com/fUwIbyW2hA
— World Of Charts (@WorldOfCharts1) April 27, 2024
Pulse On Investor Sentiment
The past 24 hours have offered a glimmer of hope for Polygon bulls. The token price surged by 5%, briefly eclipsing the .74 mark. This uptick coincides with an improvement in the MVRV ratio, which suggests a rise in the number of profitable MATIC investors.
Additionally, the bullish crossover on the MACD indicator hints at a potential increase in buying pressure. However, beneath the surface, some concerning trends remain.
Despite the recent price uptick, data suggests substantial selling pressure on Polygon. The exchange inflow has increased significantly, indicating investors moving tokens onto exchanges, often a precursor to selling. This trend is further corroborated by a rise in MATIC’s supply on exchanges, while the supply held outside of exchanges has dwindled.
Technical Indicators Paint A Mixed Picture
While the MACD offers a glimmer of hope, other technical indicators remain bearish. The Bollinger Bands suggest reduced volatility, which can be a sign of consolidation before a breakout or a further price drop. Both the Money Flow Index (MFI) and Chaikin Money Flow (CMF) have registered downticks, potentially signaling the end of the short-lived bull rally.
Polygon’s Path Forward
While the technical outlook for Polygon remains uncertain, a complete reversal isn’t out of the question. Continued positive developments within the Polygon ecosystem, coupled with broader market recovery, could propel MATIC upwards.
However, overcoming the selling pressure and technical resistance levels will be crucial for a sustained bull run. Investors should exercise caution and closely monitor market developments before making any investment decisions.
Featured image from Pexels, chart from TradingView
NFT Sales Doldrums: 30-Day Plunge Sees 34% Decline Amidst Chilling Digital Collectible Sector

Fresh data indicates a continuing decline in non-fungible token sales, dipping 3.2% in the last week and plummeting 34% over the past month. As September nears its end with six days remaining, NFT sales have tallied up to 1.37 million since August 24.
NFT Sales Still Can’t Escape Crypto Winter’s Wrath
This September, over the last seven days, NFT sales touched .88 million, marking a 3.2% dip from the preceding week, according to cryptoslam.io stats. 2023 has seen a consistent slump in digital collectible sales, and September is no exception.

The monthly tally stands at 1.37 million, a sharp 34.08% decline from the previous month. Ethereum continues its dominance in NFT sales, raking in 7,743,112 over the last month.

However, it’s worth noting that ETH-centric NFT sales have dropped by 41.84% since the month prior. Trailing Ethereum is the Mythos blockchain, registering .89 million in sales — a notable 24.86% surge from the month before. Following Mythos are Polygon, Solana, Immutable X, and Bitcoin in terms of 30-day sales.
Dmarket, Draftkings, Bored Ape Yacht Club, Gods Unchained, and Sorare top the charts in 30-day sales records. However, the latter three NFT collections faced setbacks this month, while Dmarket and Draftkings enjoyed upticks ranging between 15% and 24%.
Ethereum’s crowning NFT sale this month was a “Mega Zombie,” fetching a price of 0,044. Immutable X’s “Cross the Ages #223963” took second place, selling for 1,012. Rounding off the top three was a Bitcoin-based NFT from the “OCM Dimensions” collection, which garnered 6,708.
2023 has proven challenging for NFT investors, with prices taking a substantial hit. It’s been a chilling crypto winter, and NFTs haven’t been spared its icy grasp. The industry awaits, with bated breath, to see if NFT markets will find their spring resurgence.
What do you think about the last 30 days of NFT sales? Share your thoughts and opinions about this subject in the comments section below.