 Despite a general decline in cryptocurrency markets this week, non-fungible token (NFT) sales rose by 4.52% compared to the previous week. NFT sales totaled approximately 1,467,710 over the past seven days, with Ethereum-based digital collectibles dominating the market. NFT Landscape Shifts This week, the leading top five blockchains for NFT sales were Ethereum, Polygon, Bitcoin, […]
Bitcoin News
CoinShares: Altcoins Defy Trends As Bitcoin Faces $600M in Outflows – What’s Next?
The Bitcoin market has witnessed significant shifts recently, influenced by macroeconomic factors and changing investor sentiments. Last week, digital asset investment products saw substantial outflows, which CoinShares attributed to several key economic updates.
These included the release of US CPI data, the Federal Open Market Committee (FOMC) meeting, and Producer Price Index (PPI) figures. These events seemed to spark a rapid surge in Bitcoin price, pushing it briefly towards the ,000 mark before a swift downturn adjusted the valuation back to around ,000.
Market Shifts: BTC Faces Major Outflows While Some Altcoins Attract Investment
So far, this fluctuation in Bitcoin’s price is part of a broader pattern of volatility that has characterized the digital currency market. Just last week alone, institutional and retail investors pulled back approximately 0 million from crypto funds, marking a significant retreat.
CoinShares suggests that this could signal a growing trend of caution, amplified by a “hawkish stance” at the recent FOMC meeting, which may have encouraged investors to reduce their exposure to volatile assets like cryptocurrencies.
Bitcoin, notably the most impacted, faced outflows totaling 1 million. Despite this, there was a silver lining as altcoins like Ethereum, Litecoin, and others saw minor inflows. Ethereum led with a million increase, suggesting divergent investor confidence in altcoins compared to Bitcoin.
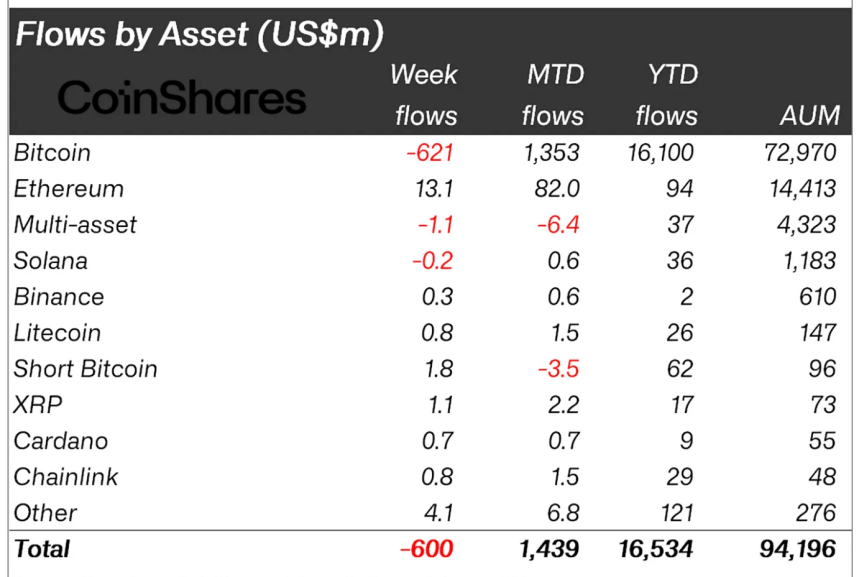
This scenario presents a mixed view where Bitcoin struggles under selling pressure while select altcoins gain marginal traction. Meanwhile, the overall impact on the market has been palpable, with total assets under management dropping from over 0 billion to billion within a week.
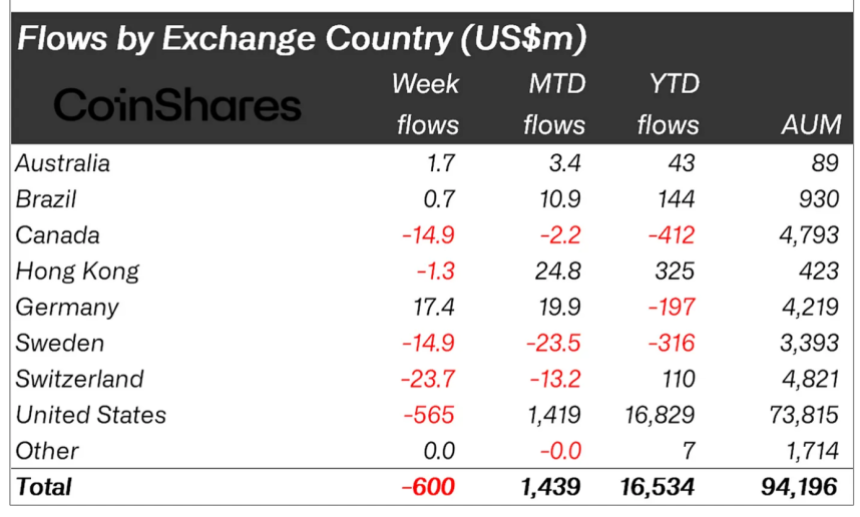
Trading volumes also dipped significantly from their annual average, indicating a cautious approach by traders across the board. Regionally, while the US experienced the brunt of the outflows, countries like Germany saw inflows, suggesting a varied global response to the current economic climate.
Bitcoin ETFs See Mixed Fortunes
Despite a steady increase in the overall net inflows into US spot Bitcoin exchange-traded funds (ETFs), which reached .11 billion in recent weeks, the sector experienced a downturn last week with a net outflow of 0 million per day, based on data from SoSoValue.
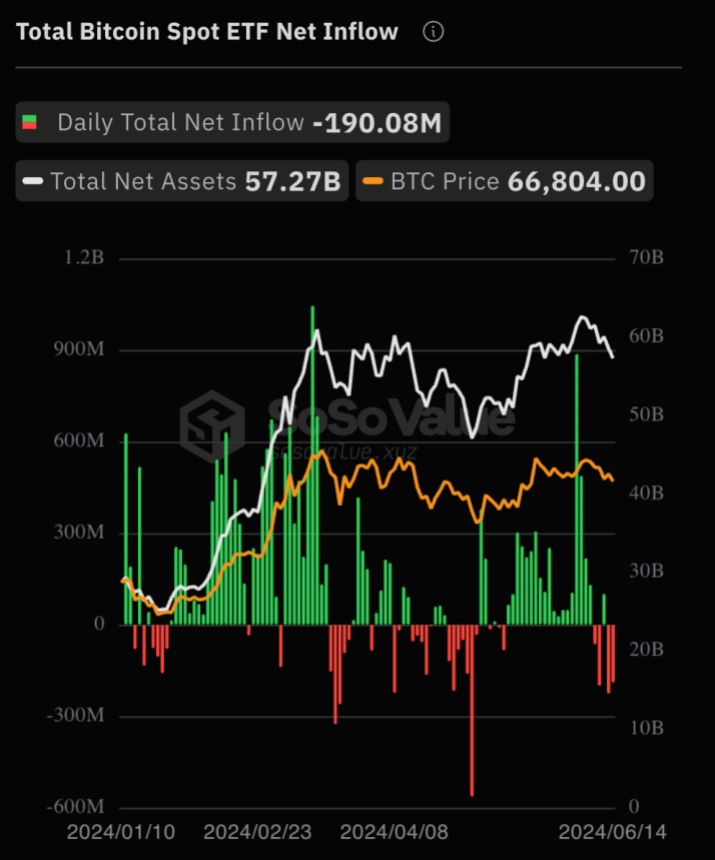
In terms of market performance, Bitcoin’s value sharply declined, hitting a low of ,398 last Friday. However, as of today, Bitcoin’s price has slightly recovered to ,552, though it still shows a decline of 1.1% in the past day and 5.5% over the week.
Speaking on Bitcoin spot ETFs, BlackRock’s Chief Investment Officer, Samara Cohen, has observed a gradual but steady interest in them despite their slower-than-expected uptake.
According to Cohen, currently, the majority of Bitcoin ETF transactions, approximately 80%, are conducted by “self-directed investors” using online brokerage platforms.
Cohen added that the iShares Bitcoin Trust (IBIT) is one of the ETFs launched this year, attracting attention from individual investors and hedge funds and brokerages, as indicated in the recent 13-F filings.
However, participation from registered investment advisors remains comparatively low, Cohen discussed during the recent Crypto Summit.
Featured image created with DALL-E, Chart from TradingView
South Korea’s Crypto Market Continues to Defy Global Trends With Premium Prices
 Metrics reveal that cryptocurrency premiums in South Korea consistently outpace the global average. As of now, bitcoin exchanges hands at ,245 per piece globally, while on the South Korean platform Upbit, it’s being traded at ,513 each. Additionally, March witnessed a notable increase in Upbit’s trade volume, skyrocketing by 172.25% from February’s data. Ethereum, Solana, […]
Bitcoin News
Underdogs Defy Odds, Shaking up NCAA Tournament Brackets
 With the dust settling from Thursday’s upsets, attention shifts to an equally promising lineup of games in the South and Midwest Regions, where teams like Marquette, NC State, Houston, and Duke vie for dominance in their quest for the Final Four. March Madness Delivers Rising Underdogs and Steadfast Favorites Statistically, this tournament has been one […]
Bitcoin News
Bitcoin Ordinal Inscriptions Defy Downturn, Embark on Resurgence as Daily Counts Soar
Over the weekend, the cumulative count of Ordinal inscriptions briskly surpassed the 36 million milestone, signaling a departure from the month-long downturn in daily onchain inscription issuances. While the staggering peaks of early September still remain unreached, a discernible resurgence has unfolded since October 25, with daily inscriptions once more eclipsing the 100,000 benchmark.
From Slump to Surge, Bitcoin Ordinal Count Ignites Onchain Revival
Unfolding over 33 days from September 24, 2023, the realm of Ordinal inscriptions witnessed a pronounced decline, presenting a vivid contrast to September 15, when an astonishing 440,760 inscriptions were orchestrated within a mere 24-hour span.
The ensuing period was characterized by a substantial descent, reaching a low on October 13, with less than 10,000 inscriptions minted. Yet, a week later, the winds of change began to stir, hinting at a potential renaissance of Ordinal inscriptions. The pivot materialized on October 24, and on that day, approximately 74,257 inscriptions were tendered to the Bitcoin blockchain.
Following suit, on the 25th, a robust 184,480 inscriptions were minted. Since that juncture, daily inscriptions have consistently surpassed the 125,000 threshold. Mirroring the manner in which daily inscriptions accumulate transactions in Bitcoin’s mempool or transaction backlog, a similar trend is re-emerging. Presently, over 29,000 to 40,000 unconfirmed transactions are in a holding pattern, awaiting miner validation.
Commencing October 25, the Bitcoin blockchain has leaped from the former 250,000-300,000 transactions per day spectrum to the current 400,000-475,000 transfers per day. To this point, solely from inscription minting, bitcoin miners have amassed 2,137 BTC, valued at approximately million. On October 28, the tally of daily inscriptions ascended to 283,950, surpassing October 25 by a substantial 99,470 inscriptions.
What do you think about the revival of Ordinal inscriptions over the past week? Share your thoughts and opinions about this subject in the comments section below.
Will XRP Price Defy A 50% Stock Market Crash? Analysts Share Predictions
The financial world is abuzz with speculations on the resilience of cryptocurrencies amidst potential global financial upheavals and a looming recession in the United States. XRP, with its unique standing, has become the centerpiece of these discussions, following a series of comments and analyses from renowned crypto analyst Egrag Crypto.
XRP Price Amid A 50% Stock Price Crash
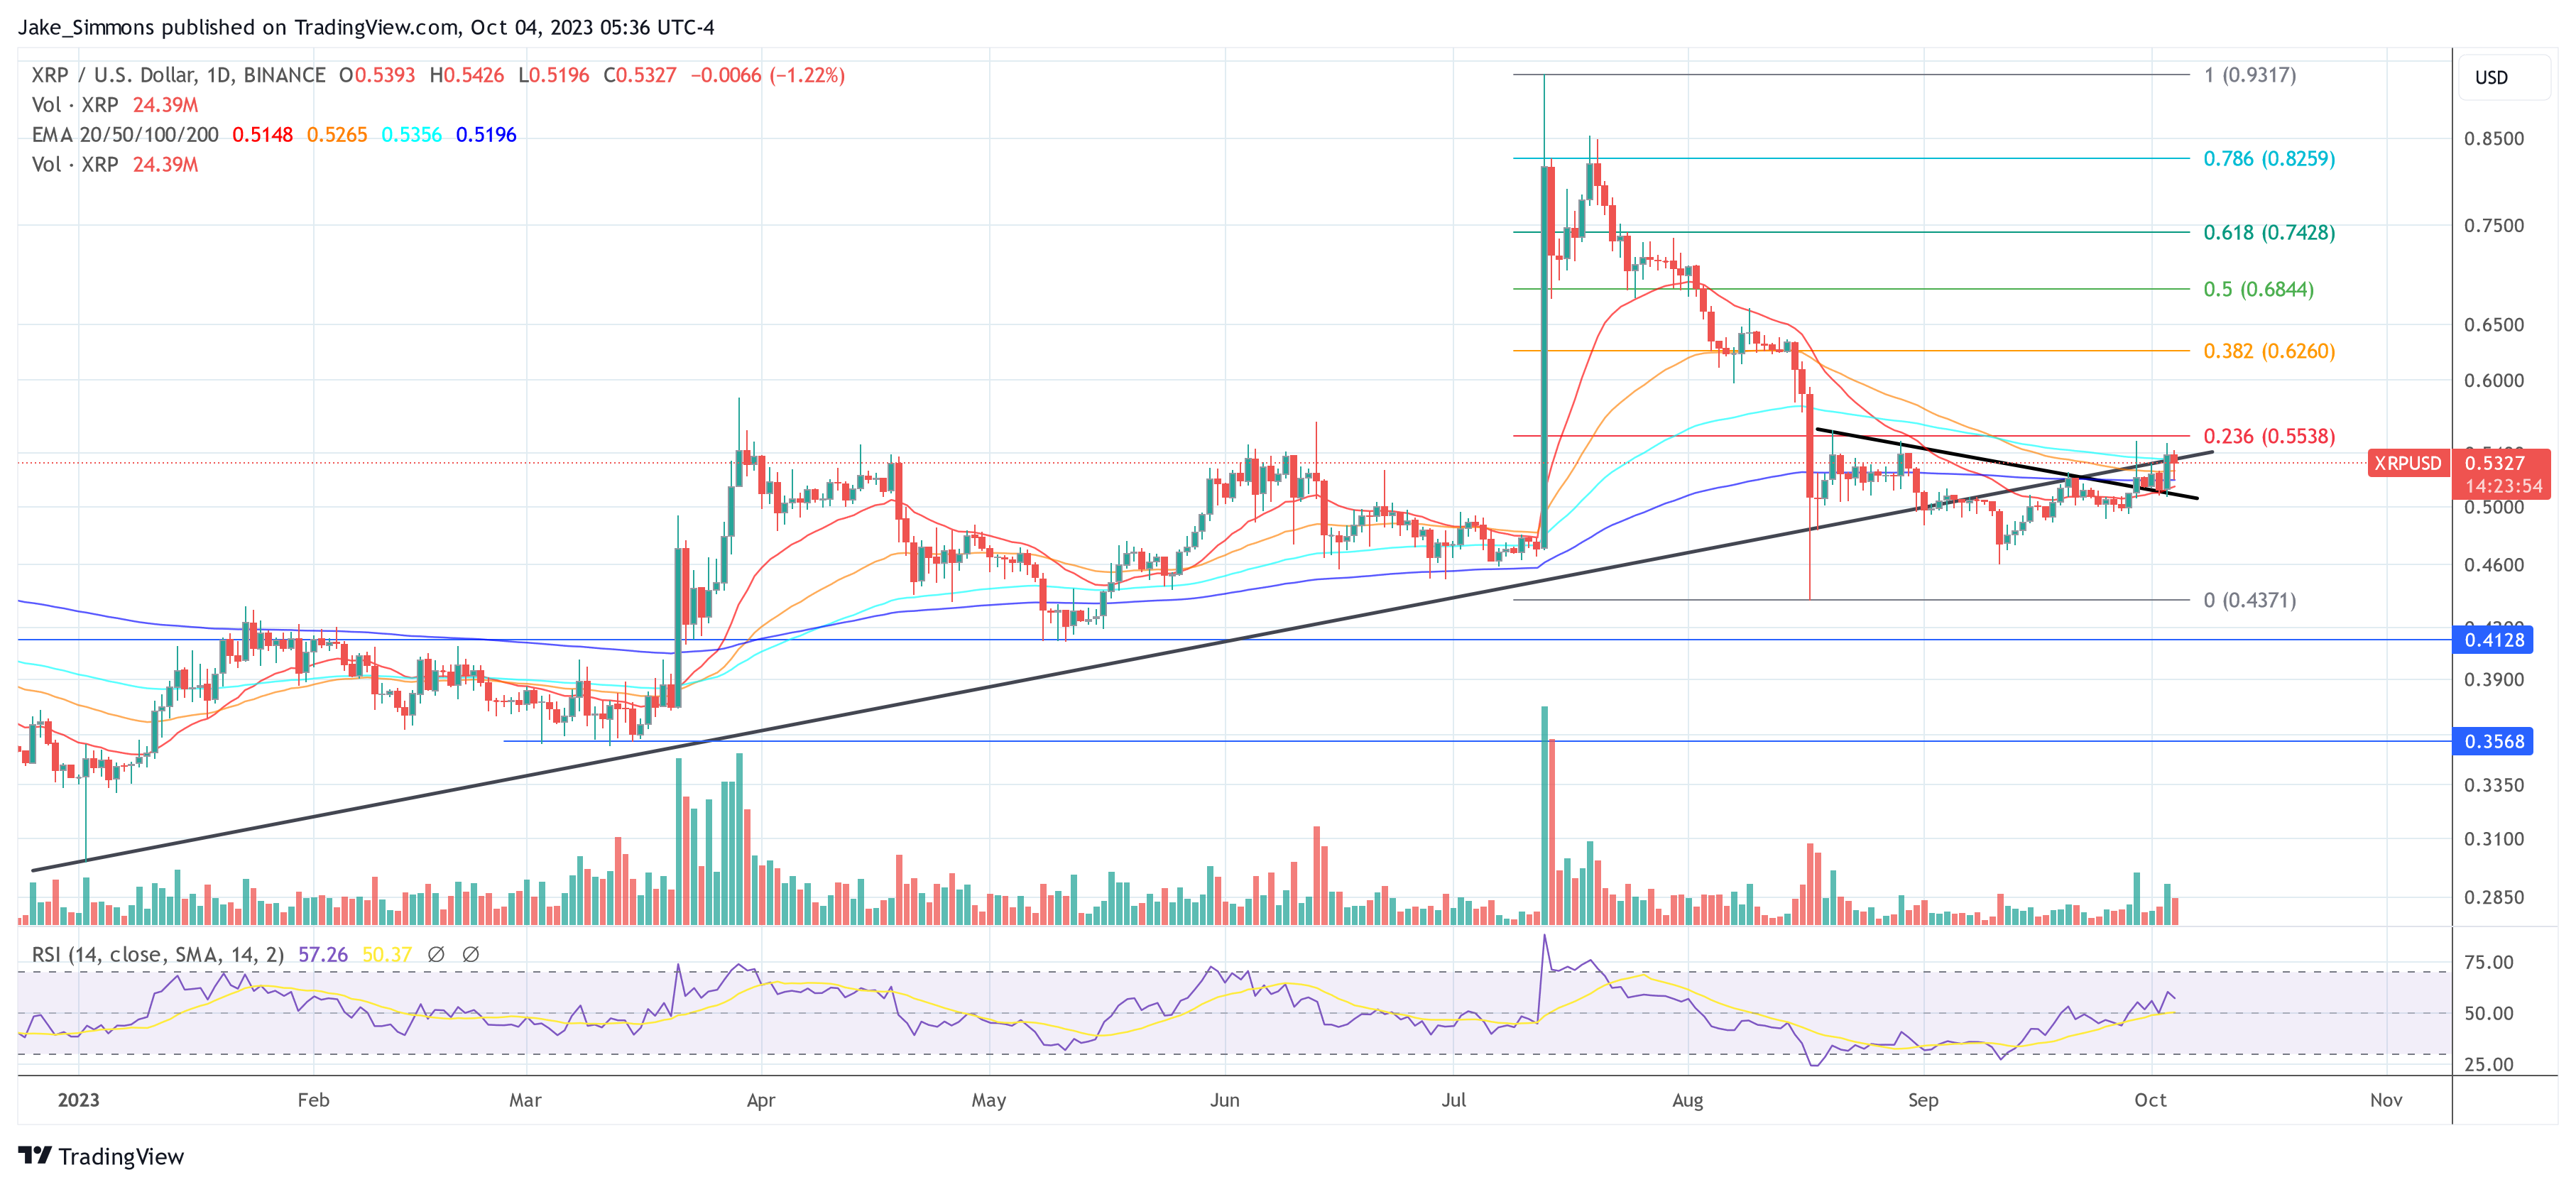
On X (formerly Twitter), Egrag took a comprehensive look at the six-month chart of the XRP price, presenting two scenarios that couldn’t be more different: a crash to .017 and a rally to .
The analyst emphasized XRP’s pioneering nature due to the remarkable degree of legal clarity it offers, setting it apart from other digital assets. “The current state of XRP offers a remarkable degree of legal clarity, making it a pioneering digital asset in terms of regulatory acknowledgment,” Egrag stated.
This legal acknowledgment, combined with its designed role to simplify cross-border payment solutions, strengthens the case for XRP to potentially rise to a price target, Egrag claims. But his analysis wasn’t purely optimistic. He alerted followers to looming shadows in the broader financial spectrum.
A significant number of technical analysts have forecasted a drastic 40%-50% downturn in global equity and stock markets. Egrag pondered the implications of such a downturn on cryptocurrencies, particularly XRP. He shared the following chart and warned of a potential sharp XRP price crash:
Under such circumstances, a measured move of 0.017c becomes a pertinent consideration. I find myself somewhat perplexed by the dichotomy presented by certain technical analysts who foresee a collapse in traditional markets while advocating for crypto to adhere to its four-year cycle.
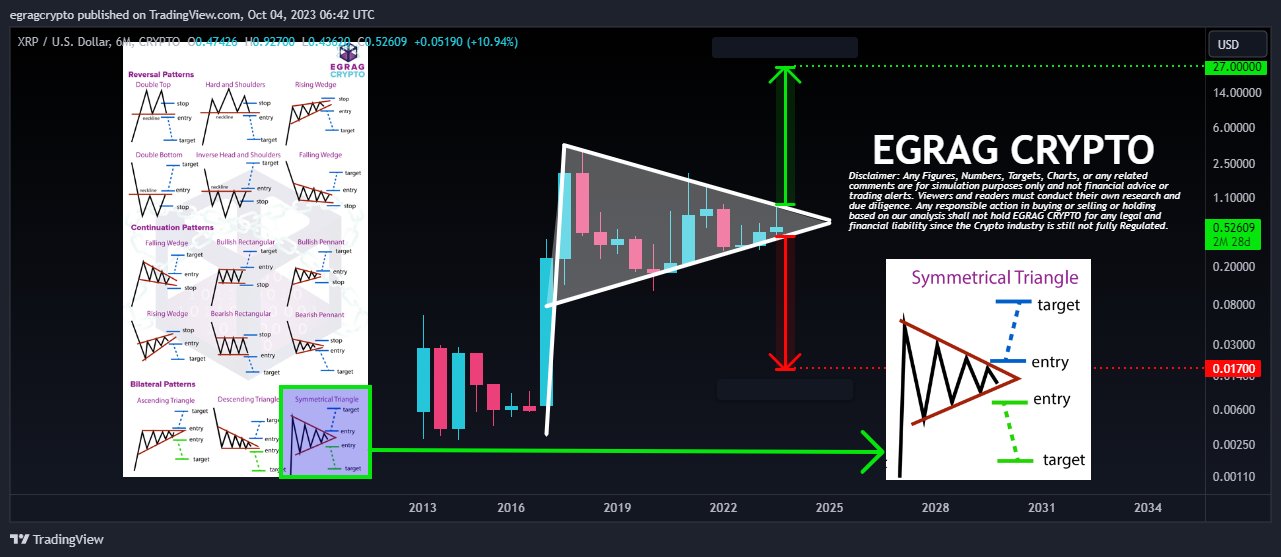
He further remarked that “it’s imperative to maintain a consistent and non-contradictory thesis when assessing these scenarios,” highlighting the inconsistency of predicting both a market collapse and a steady crypto four-year cycle.
Community’s Mixed Responses
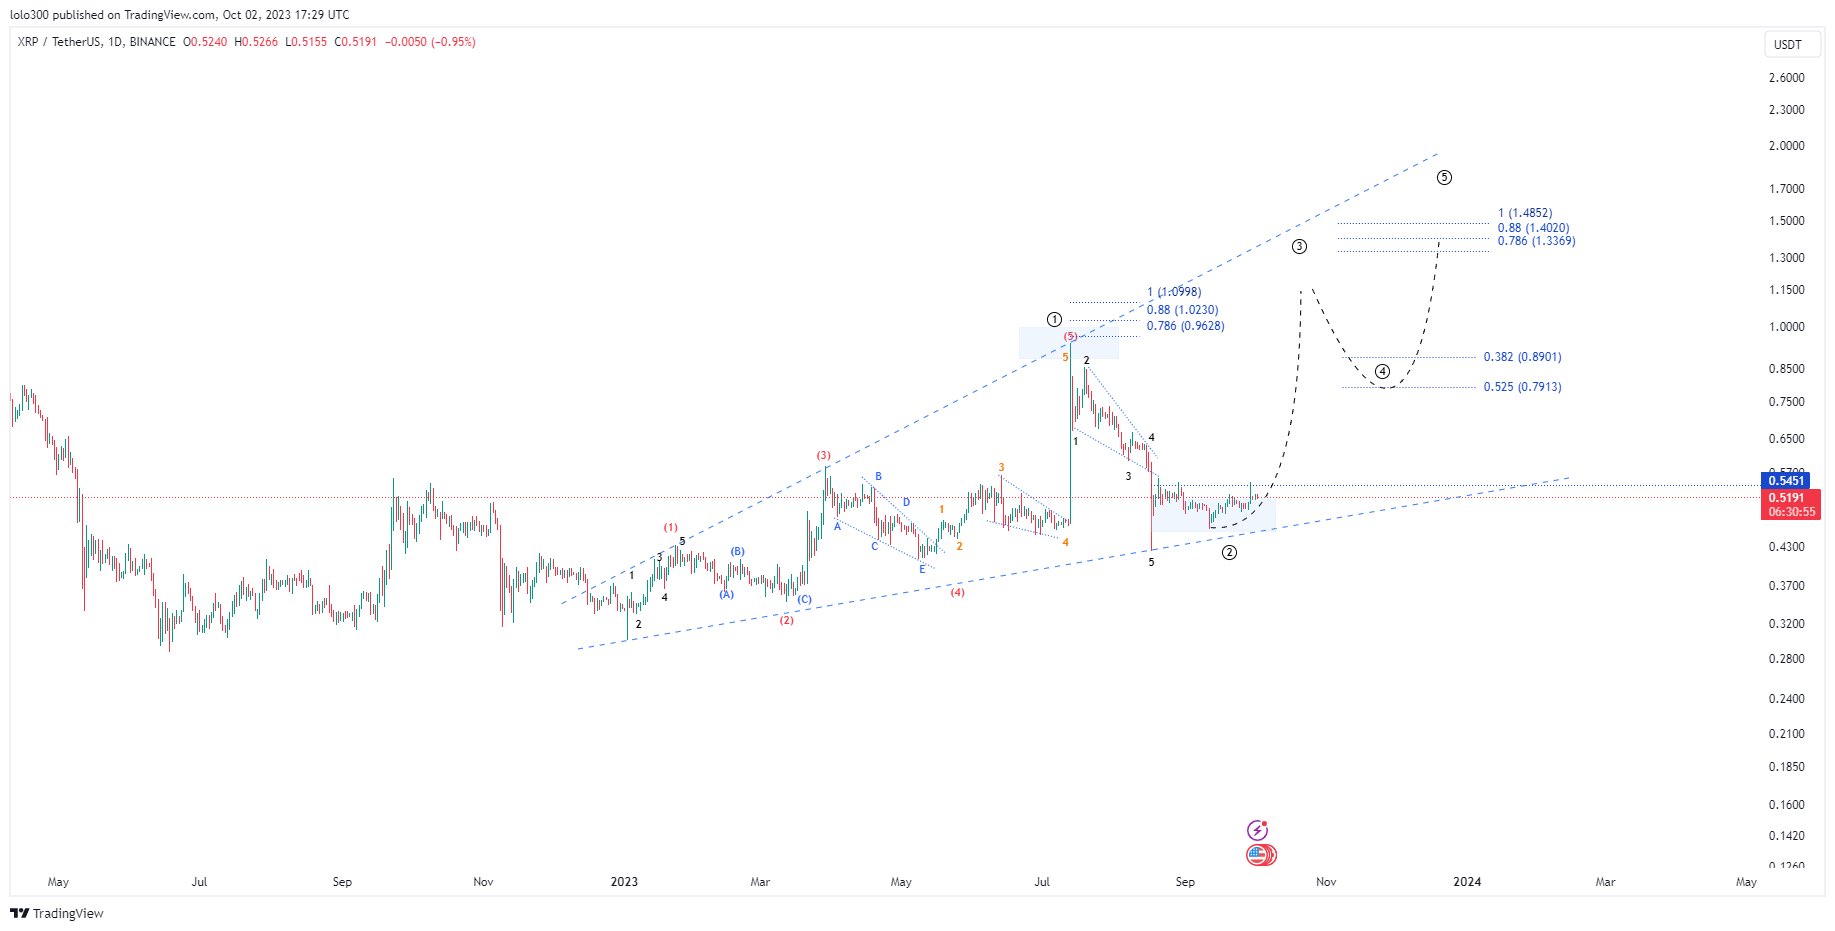
Feedback on Egrag’s analysis was multifaceted. @300Mill300, a prominent voice in the crypto space, extrapolated from Egrag’s initial analysis and offered a chart that was bullish for XRP. He projected a rally to .15 by early 2024, followed by a brief retraction to .79, and a subsequent bullish surge to reach .40 by the close of 2024.
However, the sentiment wasn’t unanimously optimistic. Rainmaker, a crypto aficionado with nearly a decade’s experience, struck a cautionary note. He predicted a pronounced “wash out” preceding each Bitcoin halving event, pushing the XRP price down, possibly to the mid .20s.
Responding to this, Egrag showcased his balanced stance. While agreeing with Rainmaker about the potential drag of macroeconomic elements on XRP, he remained bullish about XRP’s intrinsic strengths. He noted, “I think the general macro will drag it down but other than that it is solid like a rock.”
Stepping into the discussion, Analyst Ata Yurt had a different take. He expressed skepticism about XRP achieving the mentioned price points, stating, “At .017 there would be no sellers nor buyers… At , there will be no buyers either apart from a small group of FOMO orders, majority will FOMO in at or as those are the expected levels considering previous ATH.”
Yurt proposed a more pragmatic approach, suggesting a blend of technical analysis and market psychology. He believes that the mark for XRP is more attainable, urging the community to consider a linear chart for assessment.
Egrag, not one to step back from a discussion, retorted with a thought-provoking question, “Good idea but what if the equity and stock markets crashed 40-50%? Then what?” Yurt countered by estimating the potential fall of Bitcoin in such a scenario, speculating that if Bitcoin were to lag behind and drop by 60%, XRP, in relation to BTC, might settle around the .22-.25 range, a figure he deemed more realistic than the prediction of Egrag at .017.
The Bullish Case: XRP To ?
Egrag recently took to social media, highlighting a potential roadmap for XRP’s ambitious journey to through his interpretation of the “XRP ATLAS LINE”.
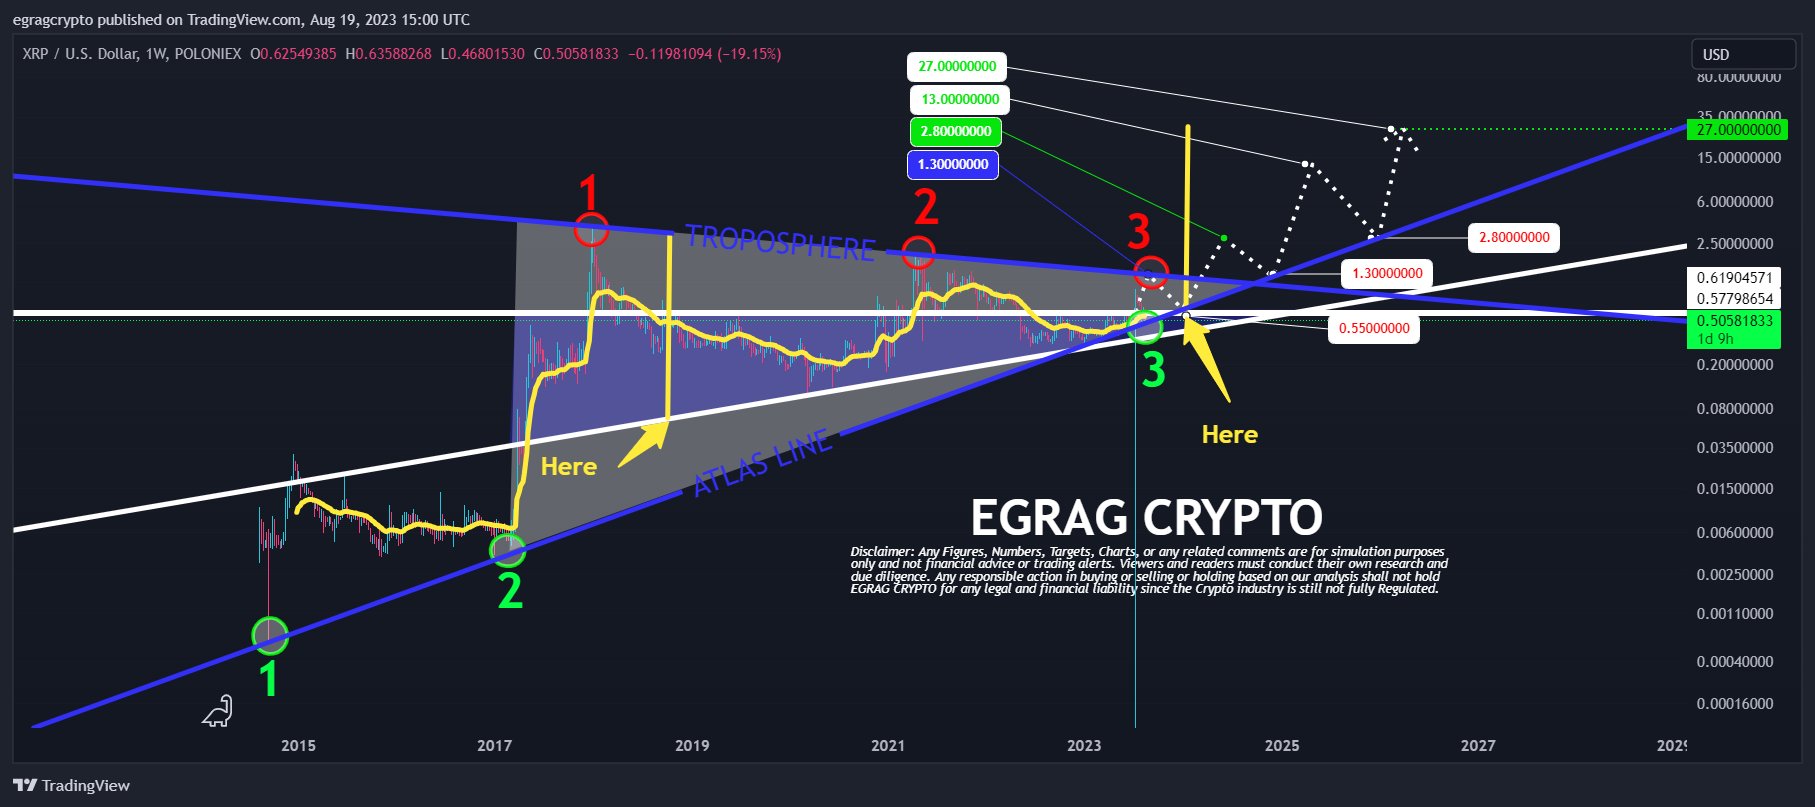
Egrag predicts a near-term positive momentum that could push XRP into the .3-.5 zone. However, the digital currency might not stay there long, as he anticipates a dip back to the .55 region, a crucial breakout retest. Once this phase passes, he sees a dynamic resurgence propelling XRP to its previous highs of .8-.0.
But that’s not the ceiling. Egrag envisions a more aggressive leap into the – bracket, although he also foresees a significant sell-off around this price point. His analysis then steers back to a reconnection with earlier levels around .8-.0 before finally culminating at the coveted mark.
At press time, XRP traded at .5327.
Crypto’s Six-Week Bleed Out: XRP And Solana Defy The Outflow Downtrend
With contrasting events in the industry, crypto investment products have witnessed a continuous outflow for the sixth week. Some altcoins demonstrate resilience in this trend, defying the broader market sentiment.
Dissecting The Crypto Outflow Trend
Crypto funds have witnessed a net outflow of million in the past week, taking the total to roughly 4 million over the last ten weeks, according to Coinshares’ latest digital asset fund flow weekly report.
Relevant digital asset management players like CoinShares, Grayscale, 21Shares, Bitwise, and ProShares have felt the heat of this ongoing trend.
To put things into perspective, the outflows have cooled from the previous week’s million, but they still extend the continuous ten-week streak of net capital movement away from these products.
A closer look into the report reveals this trend isn’t uniform across regions. Europe has somewhat resisted this wave, recording inflows of million. James Butterfill, Research Head at CoinShares, pinpoints the regional sentiment divergence to varying reactions to the regulatory environment.
According to Butterfill, European investors see the “recent regulatory disappointment as an opportunity,” while their US counterparts have pulled out million, possibly due to dismay over recent events.
Moreover, trading volumes in crypto funds have reflected the same caution. From exceeding billion in the previous week, the volume plunged to 0 million, substantially less than the yearly average of .3 billion.
Not All Assets Feel The Pinch
Bitcoin, the flag bearer of crypto, hasn’t been immune to this trend, registering outflows for three consecutive weeks, with a dip of million in the past week alone. Interestingly, Short-Bitcoin products, which gain when Bitcoin prices fall, have seen outflows of .8 million.
This suggests a larger narrative where investors may unwind their bearish bets on Bitcoin. According to Butterfill, this outflow signifies a reduction of 78% in those assets under management over the past 22 weeks.
Ethereum, another heavyweight in the crypto arena, has also felt the pinch, with outflows recorded for six weeks consecutively, resulting in a recent reduction of .2 million.
In contrast to the major players, XRP and Solana are bright spots in the market. This week, they registered inflows of 0,000 and 0,000, respectively. Interestingly, this isn’t the first time these two altcoins have shone amidst the gloom.
Last week, both assets witnessed significant inflows. Solana led the way with 0,000, followed by Cardano and XRP, which attracted inflows of 0,000 and 0,000, respectively.
While Cardano didn’t cut notable inflows this week, XRP and Solana’s positive inflows amid broader negativity suggest a selective and value-driven approach by some investors in the altcoin market, according to the report.
Meanwhile, despite their recorded upward capital movements, XRP and Solana still feel the brunt of the global crypto market downturn.
Particularly, both assets have been in red, with XRP down by 1.5% in the past day with a current price of .50 and Solana seeing a slight 0.5% upward move over the same period with a trading price of .60 at the time of writing.
Featured image from iStock, Chart from TradingView
China-Africa Economic and Trade Expo Aims to Defy Western ‘Debt Trap’ Accusations, Generating $19 Billion in Trade Deals
According to a report from the third annual China-Africa Economic and Trade Expo, Africa and China are continuing to strengthen their long-term trade ties. China wants to be one of Africa’s largest trading partners, and reports revealed on Friday that this year’s expo is expected to generate billion in deals.
Annual Trade Event Between Africa and China Highlights ‘Western Smears’ and Multi-Billion-Dollar Trade Deals
After 2010, trade between Africa and China increased a great deal and in 2011, trade between Africa and China increased by 33% from the previous year to 6 billion. The following year, trade increased further by over 22% year-over-year. China and Africa have significantly increased their trade in 2023 through a variety of initiatives and investments. Reports further indicate that China aims to surpass the European Union as Africa’s largest trading partner by 2030.
Trade between China and Africa grew by 9% year-on-year to reach .4 billion in the first four months of 2023, according to statistics. This week, leading members from African governments and the continent’s private sector have convened for the third annual China-Africa Economic and Trade Expo held in Changsha, Hunan Province, China. The annual event is a platform for China and African countries to promote economic and trade cooperation. This year’s Expo is themed “Common Development for a Shared Future.”
Regional reports indicate that this year’s expo is expected to generate billion in deals. According to Chinese media, many African officials and business representatives have rejected Western accusations of a “debt trap” in China-Africa cooperation, and have expressed their desire for closer ties with China. Anna A Wapalila, CEO of Herbanna General Supply Co in Tanzania, was quoted in the Chinese media report as saying, “China is the biggest market. If you can get any products to China, it means that you [don’t need to] look for any other countries in the world.”
James Kimonyo, the Rwandan Ambassador to China, also spoke about the United States claiming China is setting Africa up to fall into a debt trap. “In any economic structure, you look at the pillars and the projects that are going to support your growth,” Kimonyo said. “Once you have identified them, then you look for the resources to implement them. And then in the process of looking for the resources, then you engage the partners. China happens to be a partner that is very open in terms of what we discuss in terms of the financing of projects.” Kimonyo added:
I think that narrative is wrong. China is not putting Africa in a debt trap.
The People’s Daily explained that there was a lot of talk about the “Western smear” and statements against the alleged Western countries’ attempt to “decouple” Africa from China. China is now the fourth largest investor in Africa, and its investments in African countries have exceeded billion in the last ten years. “There is no point in complaining when you get money from China as long as the money is invested in the projects that are going to make a difference in the lives of all people,” Kimonyo added.
What are your thoughts on China’s efforts to strengthen trade ties with Africa and the alleged Western accusations of a ‘debt trap’? Share your thoughts and opinions about this subject in the comments section below.
Top 4 Altcoins That Defy The FTX Fiasco – TWT, LTC, GMX, CHZ
The price action displayed by top altcoins in recent times has yet to be encouraging with the market’s erratic price movement after a cascading effect suffered by FTX led to many altcoins, including the price of Ethereum (ETH), battling for survival. The Domino effect of the FTX saga and other huge investors has left the market at a standstill as the market has yet to make a major move. Still, there have been some great price movements by these top 4 altcoins lately despite the uncertainty surrounding the crypto market, leading to much fear about where the market could be headed. (Data from Binance)
Disclaimer: The picks listed in this article should not be taken as investment advice. Always do your research and invest only what you can afford to lose.
Top 4 Altcoins- Trustwallet Token (TWT) Price Analysis On The Daily Chart

The past few days have been filled with so much turbulence in the crypto space as many altcoins have struggled to show strength after losing their key support holding off price decline.
The current uncertainty surrounding the market has resulted in reluctance on the part of traders and investors to make altcoin purchases, as there is no assurance if they would be heading up any time soon.
A standout performer in these times has been TWT as the price rallied with over 100% gains in less than 48hours as the price broke out with strong bullish sentiment above , rallying to a high of .7 before facing rejection to a region of .
The price of TWT trades at .1, holding up well above the 50 and 200 Exponential Moving Averages as the price eyes further movement to the upside. If the price maintains its structure and bullish movement, we could see the price rallying to .
Price Analysis Of Litecoin (LTC) On The Daily (1D) Chart

LTC’s price has recently outperformed BTC after showing a bullish trend despite the market’s uncertainty due to the FTX fiasco.
Despite facing rejection to a region of , the price of LTC bounced off from this area as the price rallied to reclaim the 50 EMA acting as strong support for the price of LTC.
If the price of LTC holds above , we could see the price rally to a high of – in no time.
Price Analysis Of GMX On The Daily (1D) Chart

The price of GMX was rejected from its resistance of and is currently trading at .
GMX has maintained its bullish structure despite the rejection and market turmoil that has affected most crypto projects. The price of GMX needs to hold above the region of to avoid the price going lower.
Top 4 Altcoins- Price Analysis Of Chiliz (CHZ) On The Daily (1D) Chart

The price of CHZ has continued to show bullish trends holding well above the 50 EMA.
Despite the pullback across crypto assets in the market, CHZ has continued to look strong, respecting the bullish trendline.
The price of CHZ broke the resistance at .236, a close above this region could send the price to a region of .3.
Featured image from zipmex, Charts from TradingView.com
NewsBTC
3 Top Altcoins That Defy The Market Retracement- REEF, LINK, VET
- LINK’s price holds strong as price eyes a rally to after breaking out of its long-range accumulation zone.
- REEF’s price continues to trend above key support as price broke out of its downtrend with eyes set for .01.
- VET’s price remains strong, holding key support on the daily timeframes as the price trades above the 50 Exponential Moving Average (EMA).
Previous weeks saw the price of most altcoins trend higher this has put these 3 top altcoins in the spotlight, considering how the crypto market has been fairing after the market saw its price decline with the price of Bitcoin (BTC) and Ethereum (ETH) not looking too good as the week has continued to look unprecedented with the current market looking choked with the current issue between Binance and FTX creating a fear of uncertainty and doubt for most traders and investors. (Data from Binance)
3 Top Altcoins – Chainlink (LINK) Price Analysis On The Daily Chart

The previous week saw many altcoins produced over 200% gains over the past 7 days of breaking out of their range-bound movement, as many believe more hope is returning to the crypto space.
The new week hasn’t kicked in like the last as most altcoins have begun to look shaky, dropping off from their weekly highs, including the price of Ethereum (ETH) and Bitcoin (BTC) suffering a minor price retracement back to a region of ,540 and ,600 respectively. Still, the price of LINK has continued to show strength after breaking out successfully from its downtrend. With the current outlook of LINK, the price of LINK could rally to a region of as things have continued to look strong for LINK’s price.
After having a weekly close above , the price of LINK has looked more decent, as the price aims to create more bullish signs that have attracted so much attention in the past few days.
Weekly resistance for the price of LINK – .2.
Weekly support for the price of LINK – .
Price Analysis Of REEF Protocol On The Daily (1D) Chart

The REEF price remains strong in the daily timeframe as it holds above its critical support at .0055, rallying from its daily downtrend and breaking above with good volume.
REEF’s price needs to hold above its .005 value, which corresponds to the 50 EMA holding the price of REEF from sell-off, considering how uncertain the market has become of late.
The price of REEF trades at .0055 after rejection from a daily high of .006 as the price tried to break above this region.
Daily resistance for the REEF price – .0065.
Daily support for the REEF price – .0051.
3 Top Altcoins- Price Analysis Of Vechain (VET) On The Daily (1D) Chart
The VET price remains strong in the daily timeframe as it holds above its critical support at .025 after rallying from a daily low of .02, but the price faced resistance to breaking higher in price to a region of .03.
The price of VET needs to hold above .025 to have more chances of trending higher to a region of .03.
Featured Image From zipmex, Charts From Tradingview
NewsBTC